| Citation: | Robert E. Criss. Hydrologic Time Scale: A Fundamental Stream Characteristic. Journal of Earth Science, 2022, 33(5): 1291-1297. doi: 10.1007/s12583-022-1655-8

|
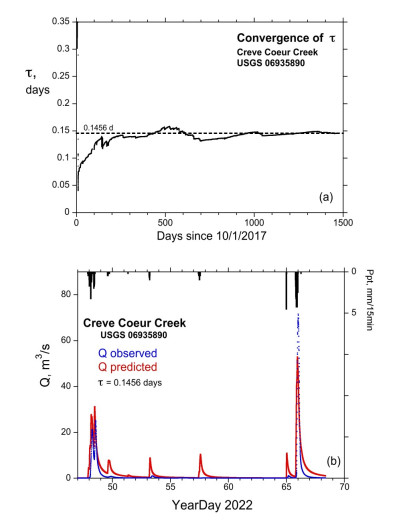
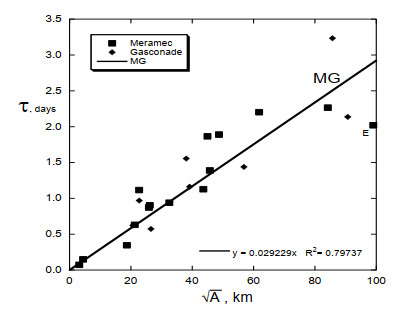
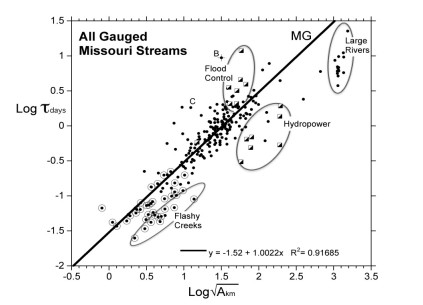
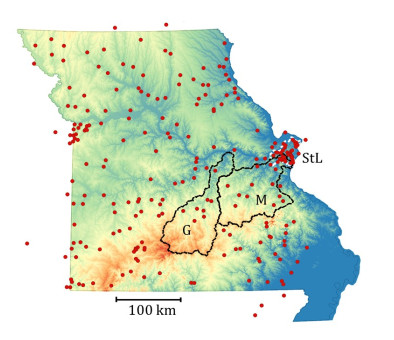
A new, fundamental catchment attribute called the hydrologic time scale

| Baker, D. B., Richards, R. P., Loftus, T. T., et al., 2004. A New Flashiness Index: Characteristics and Applications to Midwestern Rivers and STREAMS1. JAWRA Journal of the American Water Resources Association, 40(2): 503–522. https://doi.org/10.1111/j.1752-1688.2004.tb01046.x |
| Bhunya, P. K., Berndtsson, R., Ojha, C. S. P., et al., 2007. Suitability of Gamma, Chi-Square, Weibull, and Beta Distributions as Synthetic Unit Hydrographs. Journal of Hydrology, 334(1/2): 28–38. https://doi.org/10.1016/j.jhydrol.2006.09.022 |
| Criss, R. E., 2018. Theoretical Link between Rainfall and Flood Magnitude. Hydrological Processes, 32(11): 1607–1615. https://doi.org/10.1002/hyp.11511 |
| Criss, R. E., Winston, W. E., 2003. Hydrograph for Small Basins Following Intense Storms. Geophysical Research Letters, 30(6): 1314. https://doi.org/10.1029/2002gl016808 |
| Criss, R. E., Winston, W. E., 2008. Discharge Predictions of a Rainfall-Driven Theoretical Hydrograph Compared to Common Models and Observed Data. Water Resources Research, 44(10): W10407. https://doi.org/10.1029/2007wr006415 |
| Ehlmann, B. L., Criss, R. E., 2006. Enhanced Stage and Stage Variability on the Lower Missouri River Benchmarked by Lewis and Clark. Geology, 34(11): 977. https://doi.org/10.1130/g22754a.1 |
| Frederickson, G. C., Criss, R. E., 1999. Isotope Hydrology and Residence Times of the Unimpounded Meramec River Basin, Missouri. Chemical Geology, 157(3/4): 303–317. https://doi.org/10.1016/S0009-2541(99)00008-x |
| Funk, J. L., Robinson, J. W., 1974. Changes in the Channel of the Lower Missouri River and Effects on Fish and Wildlife: Missouri Department of Conservation, Aquatic Series 11, Jefferson City |
| Luo, M. M., Criss, R. E., 2018. Increasing Stage Variability of the Mississippi River. Journal of Hydrologic Engineering, 23(8): 05018016. https://doi.org/10.1061/(asce)he.1943-5584.0001678 |
| MSDIS, 2022. Missouri Spatial Data Information Service, State-extent DEM. https://www.msdis.missouri.edu/data/elevation/index.html (last accessed in March 2022). |
| Southard, R., Veilleux, A., 2014. Methods for Estimating Annual Exceedance-Probability Discharges and Largest Recorded Floods for Unregulated Streams in Rural Missouri. USGS Scientific Investigations Report, SIR 2014-5165, 39 |
| USGS, 2022a. USGS Current Water Data for Missouri. https://waterdata.usgs.gov/mo/nwis/rt (last accessed in March 2022) |
| USGS, 2022b. StreamStats: Streamflow Statistics and Spatial Analysis Tools for Water-Resources Applications. https://streamstats.usgs.gov (last accessed in March 2022) |
| Vineyard, J., Feder, G., 1982. Springs of Missouri. Missouri Geological Survey and Water Resources, WR 29, 212 |
| Winston, W. E., Criss, R. E., 2016. Dependence of Mean and Peak Streamflow on Basin Area in the Conterminous United States. Journal of Earth Science, 27(1): 83–88. https://doi.org/10.1007/s12583-016-0631-6 |
Figures(5) / Tables(1)
Copyright © 2013-2020 Journal of Earth Science 鄂ICP备15021562号-2
Tel: +86-27-67885075 Fax: +86-27-67885075 E-mail: xbb@cug.edu.cn
Address: Editorial Office of Journal, China University of Geosciences, Yujiashan, Wuhan, Hubei 430074, P. R. China
Supported by:
Beijing Renhe Information Technology Co. Ltd
E-mail:
info@rhhz.net


 DownLoad: