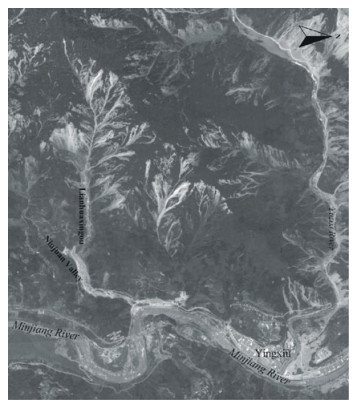
Advanced Search

Indexed by SCI、CA、РЖ、PA、CSA、ZR、etc .

Fangqiang Wei, Chernomorets Sergey, Aristov Konstantin, Petrakov Dmitry, Tutubalina Olga, Pengcheng Su, Yuhong Jiang, Aisong Xu, Petrasov Alexey. A Seismically Triggered Landslide in the Niujuan Valley near the Epicenter of the 2008 Wenchuan Earthquake. Journal of Earth Science, 2010, 21(6): 901-909. doi: 10.1007/s12583-010-0143-8
Citation: Fangqiang Wei, Chernomorets Sergey, Aristov Konstantin, Petrakov Dmitry, Tutubalina Olga, Pengcheng Su, Yuhong Jiang, Aisong Xu, Petrasov Alexey. A Seismically Triggered Landslide in the Niujuan Valley near the Epicenter of the 2008 Wenchuan Earthquake. Journal of Earth Science, 2010, 21(6): 901-909. doi: 10.1007/s12583-010-0143-8

A Seismically Triggered Landslide in the Niujuan Valley near the Epicenter of the 2008 Wenchuan Earthquake

doi: 10.1007/s12583-010-0143-8
Funds:

This study was supported by the NSFC-RFBR Projects 40911120089

This study was supported by the NSFC-RFBR Projects 08-05-92206 NSFCa

Russian Leading Science Schools Programme НШ-3405.2010.5

International Cooperation Project of the Ministry of Science and Technology of China 2009DFR20620

International Cooperation Project of the Department of Science and Technology of Sichuan Province 2009HH0005

More Information
  • Corresponding author: Fangqiang Wei, fqwei@imde.ac.cn
  • Received Date: 03 Jun 2010
  • Accepted Date: 10 Aug 2010
  • Publish Date: 01 Dec 2010
  • The Wenchuan (汶川) earthquake on 12 May 2008 induced a large number of landslides, collapses, and rockfalls along the Longmenshan (龙门山) fault. The landslide in Niujuan (牛圈) Valley (named Niujuan landslide), close to the epicenter, is one that travelled a long distance with damaging consequences. Using QuickBird satellite images and GIS tools, the seismogenic mass movements are analyzed, and the movement phases, travel path, and post-catastrophic processes of Niujuan landslide are described and discussed. Image interpretation and a GPS survey showed that the mass movements denuded 37% of the research area. The Niujuan landslide moved 1 950 m along the Lianhuaxingou (莲花心沟) stream, transformed to a debris avalanche, and accumulated in the downstream bed of Niujuan Valley, where they formed a dam 30 m in height, blocking the Niujuan stream and creating a barrier lake basin with 0.11 million m3 storage capacity. Subsequent to the Niujuan landslide, debris flows have been more active in Lianhuaxingou and Niujuan valleys because of the accumulated mass of debris.


  • The 2008 Wenchuan earthquake induced many landslides, rockfalls, and debris flows. According to the systematic investigation by the Ministry of Land and Resources of China, landslides, rockfalls, and debris flows induced by the earthquake were observed in 15 000 sites (Yin et al., 2009). The landslide in the Niujuan Valley, near the earthquake epicenter, is an example. The Niujuan landslide, the largest landslide around the epicenter, blocked the Niujuan Valley, formed a landslide barrier lake, and resulted in three deaths, the destruction of one house, and burial of 1 km of road. The subsequent debris flows induced by landslide destroyed part of the highway from Dujiangyan to Wenchuan and delivered copious sediment to the Minjiang River. Some characteristics of the landslide, for example, volume, travel distance, velocity, and initiation mechanism are noteworthy and have yet to be described in earlier publications.

    A number of publications have described many landslides triggered by the 2008 Wenchuan earthquake. Landslides were triggered more than 100 km north of the epicenter along the trace of the Longmenshan fault. Kusky et al. (2010) considered that the concentration of landslides and ground deformation so far north of the epicenter may have been related to the Mode II–III fracture propagation focusing the energy along the fault toward the north. Cui et al. (2009) included the Niujuan landslide barrier lake in a list of important lakes produced by the Wenchuan earthquake but did not describe the landslide. Xu et al. (2009) described landslide dams triggered by the earthquake, but the Niujuan landslide, dam, and lake were not included. Yin et al. (2009) analyzed the distribution of seismically triggered landslides and described the characteristics of 33 typical landslides but did not include the Niujuan landslide. Wang et al. (2009) presented preliminary observations on some large landslides (not including the Niujuan landslide) triggered by the 2008 Wenchuan earthquake. Sato and Harp (2009), using images taken on 15 May, 2008 and published by Google Earth, interpreted landslides triggered by the Wenchuan earthquake in the Beichuan area, but Wenchuan area, where the Niujuan landslide is located, was not included in their analysis. In this article, we describe the area where the Niujuan landslide occurred and analyze the landslide characteristics using remote sensing image interpretation and field surveys.

    Niujuan Valley, a right tributary of the Minjiang River, is located near Xuankou Town, Wenchuan County, Sichuan Province (Fig. 1). The geographical coordinates of its embouchure are 31°02′44.3″N and 103°28′26.3″E, where the highway from Dujiangyan to Wenchuan (Highway #317) intersects it. The linear distance from Niujuan Valley to Wenchuan is 53 km, to Dujiangyan is 15 km, and to Yingxiu, the epicenter of 2008 Wenchuan earthquake, is only 2 km. The Niujuan Valley is located at the end of the backwater zone of the Zipingpu Reservoir, the largest one on the Minjiang River with a holding capacity of over 1.12 billion m3. The straight-line distance from the Niujuan Valley to the Zipingpu Reservoir dam is just 10 km. Because of the proximity to the Wenchuan earthquake epicenter, earth surface features and processes in the study area were dramatically influenced.

    Figure  1.  Location of the Niujuan Valley and surrounding area.

    The study region is located on the eastern margin of Qinghai-Tibet plateau, in the high relief transition zone between the plateau and the Sichuan basin, a zone where crustal uplift and stream incision are strong. The catchment area of Niujuan Valley is 10.9 km2, and the length of the main stream is 6.2 km. With the highest elevation at 2 610 m and the lowest elevation at 858 m, the total topographic relief of the Niujuan Valley is 1 752 m, making the average gradient of the trunk stream 283‰. Lianhuaxingou, a downstream tributary of Niujuan River, is the primary study site because the Niujuan landslide event occurred in its upper reach (Fig. 2). Its catchment area is 2.1 km2, steam length is 3.2 km, average stream gradient is 392‰, and stream gradient of upper stream raises up to 643‰.

    Figure  2.  3D map of the Niujuan Valley.

    Because the study region is located in the transition zone between the Qinghai-Tibet plateau and Sichuan basin, lies on the border between the Yangtze platform and Yunnan-Tibet margin of the Eurasian plate, and is influenced by the crustal uplift of Qinghai-Tibet plateau, the neotectonics are very active. Most of tectonic lineaments in the region are in an SW to NE direction or WSW to ENE direction (Fig. 3), which is identical to the direction of gravity and Moho depth contours.

    Figure  3.  Longmenshan tectonic zone. F1. Maoxian-Wenchuan fault belt; F2. YingxiuBeichuan fault belt; F3. Pengzhou-Guanxian fault belt.

    The study region lies in the Mesozoic fold belt that formed through the subduction of the Indian plate in Indo-Chinese epoch. In the Himalayan movement, the Himalaya and the Qinghai-Tibet plateau uplifted under the action of continental collisions, raising the study region of northwest of Sichuan at the same time. Thus, the study region is a strongly uplifting area with active new and old faults. Niujuan Valley is located close to the Beichuan-Yingxiu fault belt of the Longmenshan tectonic zone (Fig. 3). The BeichuanYingxiu fault belt, the central fault of Longmenshan tectonic zone, has been an active dextral reverse fault belt during Holocene. Historically, there have been frequent and strong earthquakes. This active fault belt crosses the Niujuan Valley, and the Niujuan landslide occurred near this fault.

    The two major lithological units in the Niujuan Valley are Precambrian medium-grained granite and Triassic sandstone interlayered with shale and coal. The granite, which is distributed in the upstream and northwest part of Niujuan Valley, has a high-intensity coefficient and good engineering property with weak penetrability. The sandstone is distributed in southeast part and downstream part of Niujuan Valley. As shown in Fig. 4, the Yingxiu-Beichuan fault belt crosses Niujuan Valley from southwest to northeast.

    Figure  4.  Geological map of Niujuan Valley.

    The Wenchuan earthquake was a direct triggering factor for the Niujuan landslide. The earthquake with a magnitude of 8.0 Ms occurred at 14:28 (Beijing time) on the 12th of May 2008. Its epicenter was located at Yingxiu, Wenchuan, Sichuan Province (Fig. 5), and the depth of focus was 14 km.

    Figure  5.  Seismic intensity zones in the Wenchuan earthquake. F1. Maoxian-Wenchuan fault belt; F2. Yingxiu-Beichuan fault belt; F3. Pengzhou-Guanxian fault belt.

    Wang et al. (2008) indicated that the surface rupture originated at the epicenter and extended NE to the boundary of Longmenshan tectonic zone; the whole process lasted for 110 s. Only 7.2 s after the main shock, the Pengzhou-Guanxian fault belt began to activate due to the right-lateral strike-slip and reverse thrust. The average distance of strike-slip was 155.0 cm, and the average amount of dip-slip was 118.6 cm. At 12–34 s after the main shock, a larger slip occurred from Yingxiu to Hanwang along the YingxiuBeichuan fault belt, and 37% of the earthquake energy was released by this event. During this period, dislocation occurred in both the Yingxiu- Beichuan fault belt and the Pengzhou-Guanxian fault belt. Dislocation was up to 516 cm in the Pengzhou-Guanxian fault belt at the depth 9.1 km and 1 249 cm in the Yingxiu-Beichuan fault belt at the depth 15.5 km. We infer that the Niujuan landslide most probably occurred during this period as well. The highest seismic intensity on the surface is estimated to have been in Category XI of the M.M scale, and the research site is located in this zone (Fig. 5).

    Because the epicenter of the Wenchuan earthquake was very close to Niujuan Valley and the upstream and northern part of the Niujuan Valley is located on the hanging wall of seismogenic thrust fault, numerous landslides were triggered in this area. The Niujuan landslide, the largest, occurred at the headwall of the Lianhuaxingou Valley (Fig. 6a). The landslide moved down to the headwall foot where it joined the Lianhuaxingou streambed and channel and moved rapidly to the confluence with the Niujuan Valley (Fig. 6b). The original slide mass fractured during its movement and transformed to a debris avalanche. At the confluence with the Niujuan Valley, the debris avalanche was obstructed by the right bank slope where it turned downstream, accumulating in the Niujuan streambed and channel forming a dam and blocking the stream and causing a lake to form (Fig. 6c). In the Niujuan landslide event, three persons were killed, and a farmer's house was destroyed.

    Figure  6.  (a) Valley headwall source area of the Niujuan landslide; (b) streambed and channel of Lianhuaxingou and debris avalanche mark; (c) landslide/debris avalanche dam and lake in the Niujuan Valley

    Remote sensing imagery was the primary tool for the study of the Niujuan landslide. Three satellite images were selected to compare the situation before and after the earthquake and landslide.

    Two types of satellite images, QuickBird (including quicklooks images with a resolution of 7 m and initial QuickBird images with resolution of 0.6 m) and Resurs-DK with a resolution of 2 m, were used in this research. The quicklooks of QuickBird images include two covering the Niujuan Valley region before and after the Wenchuan earthquake. Because of the poor weather prevailing in the study region at the time of the earthquake, it was difficult to select two images without cloud cover close to 12 May, 2008. Thus, an image taken on 26 June, 2005 was selected as the before image, and an image taken on 2 June, 2008 was selected as the after image. All were downloaded from www.digitalglobe.com and were used for comparison of denudation before and after the Wenchuan earthquake. The initial QuickBird image, taken on 2 June, 2008, covers only the main part of the Niujuan landslide. It was purchased through ScanEx Research and Development Center and was used in interpreting the landslide.

    Because there are only red, green, and blue spectral band in the quicklooks images, it was difficult to create a denudation classification. Special haze removal algorithms (separation of the image into 'haze' and 'no haze' areas) were applied before the supervised image classification. First, areas covered by clouds and water objects (rivers and reservoir) were manually masked using vector data from visual interpretation. Then, the image was separated into haze and no haze areas to make supervised image classifications for both parts. Finally, "haze" and "no haze" classified images were combined.

    The Resurs-DK image taken on 3 June, 2009 covers the Niujuan drainage basin and part of Minjiang River valley. It was purchased from JSC Russian Space Systems and was used to interpret debris flow events after the Niujuan landslide.

    Figure 7, the quicklooks of QuickBird images, shows the status of Niujuan area and surrounding region before and after the Wenchuan earthquake. In the before image, most of the study area is covered by vegetation except the river bed and residential areas. Less than 1% of the study area is shown as denuded. In the after image, 37% of the study area is shown as denuded. The earth surface at the upper wall of the Yingxiu-Beichuan fault was disturbed more than at the lower wall. The boundary between disturbed and less disturbed surface is very clear along the fault line and the Niujuan landslide on the upper wall of the fault.

    Figure  7.  Comparison between the images before (a) and after (b) the Wenchuan earthquake.

    Figure 8 is a subset of the initial QuickBird image of Lianhuaxingou drainage basin taken on 2 June, 2008. Lianhuaxingou is the tributary in the Niujuan basin influenced mostly by the Wenchuan earthquake. The seismogenic mass movements, Niujuan landslide phases, and the travel path were interpreted using this image.

    The Wenchuan earthquake induced numerous mass movements, including landslides, collapses, and rockfalls, etc.. The QuickBird image (Fig. 8) shows that the mass movements were concentrated in the middle and upper reaches of Lianhuaxingou basin. The Niujuan landslide initiated on the right bank and moved down valley to the Niujuan channel. Other landslides, collapses, and rockfalls were registered mainly on the left bank and headwall of the Lianhuaxingou basin. Their volumes were not large, and run out distances were limited, but their number is very large. In Fig. 9, the result of visual interpretation and mapping of slope processes in ArcGIS Desktop module ArcMap 9.2 shows all slope processes in Lianhuaxingou interpreted from the QuickBird image taken on 2 June, 2008. The area of mass movement is 0.42 km2 and occupies 21% of the whole catchment of the Lianhuaxingou.

    Figure  8.  Lianhuaxin gully after earthquake and the travel path of the Niujuan landslide.
    Figure  9.  Comparison between the images before (a) and after (b) the Wenchuan earthquake.

    There is a large elevation difference and a steep gradient along the Lianhuaxingou channel from the head to outlet. Figure 10, the longitudinal profile of landslide/debris avalanche path, was compiled using the 1 : 50 000 topographic map. The distance from the stream head to outlet is 1 950 m, and the mean gradient is 28%. The Niujuan landslide/debris avalanche did not stop at the foot of the valley but moved down the Niujuan channel, stopping just short of the Minjiang River. During the event, the landslide body disaggregated under the influence of the rough surface and its bounding motion, changing the movement type to a debris avalanche.

    Figure  10.  Longitudinal profile of the landslide and debris avalanche path.

    The QuickBird image interpretation and field investigation suggest that the whole movement process could be divided into three phases: initial landslide, debris avalanche, and debris accumulation. Zone I, the initial landslide, is shown in brown in Fig. 9. The distance of the initial landslide movement is 445 m, the area is 149 500 m2, and the volume is assessed as 3.0–4.0 million m3. Zone II, the debris avalanche, is shown in orange in Fig. 9. The distance of movement is 1 005 m, the width is 130–170 m, and the depth is 30–40 m. Zone III, debris accumulation phase, is shown in yellow in Fig. 9. The accumulation area covers 123 000 m2 with 960 m in length and 220 m in the maximum width. Comparison between a digital topographic map and the results of field surveying with a GPS (Trimble R8) yields a maximum depth of the accumulation deposit of 38 m and a total volume of approximately 2.3 million m3. The high mark of the debris avalanche on the right bank of the Niujuan channel is 84 m above the streambed.

    The travel path of the landslide/debris avalanche was controlled by the topography of the Lianhuaxingou and Niujuan channels and is shown in Fig. 10 as interpreted from the QuickBird image.

    The debris avalanche stopped, and its deposit formed a dam and barrier lake in the Niujuan Valley (Fig. 10). According to the QuickBird image interpretation, the area of the lake was 9 760 m2, the maximum height of the dam was 30 m, and the maximum lake storage capacity was 0.11 million m3. The dam is stable at present after being strengthened, following the construction of a rapid flood passage.

    The Niujuan landslide and other seismogenic slope processes deposited large amounts of debris in the Lianhuaxingou and of Niujuan channels. Debris flows became more active, following the earthquake and the seismogenic slope processes. The QuickBird image shows that a debris flow event that occurred in the Lianhuaxingou channel before 2 June, 2008. The magnitude of this event was small, possibly because the initiating rainfall was limited. The debris flow stopped in the middle of Lianhuaxingou channel (Fig. 9). A large debris flow event that occurred on 24 September, 2008, induced by the heavy rainfall. This debris flow carried masses of sediments from the Lianhuaxingou channel and the debris avalanche deposit in the Niujuan Valley to its outlet near the Minjiang River. Some houses and portions of highway were destroyed and damaged in this event. Figure 11 is a part of the Resurs-DK image taken on 3 June, 2009 and shows extensive debris flow deposits extending to the lower reach of the Niujuan channel, indicating that post-earthquake debris flows probably contributed to the sediment load of the Minjiang River.

    Figure  11.  Postcatastrophic slope processes and debris flow activity in the Niujuan Valley.

    The Wenchuan earthquake triggered numerous slope failures, such as landslides, collapses, topples, and rock falls, in the Niujuan Valley, a tributary of the Minjiang River close to the earthquake epicenter. The seismogenic processes denuded 37% of the Niujuan basin. The Niujuan landslide, which occurred in the upstream area of the Lianhuaxingou tributary, was the largest landslide near the earthquake epicenter. The landslide moved 1 950 m down the Lianhuxingou channel, transformed to debris avalanche, and accumulated in the downstream bed of the Niujuan Valley. The deposit formed a barrier dam 30 m high, creating a lake basin with a capacity of 0.11 million m3. Following the earthquake and the seismogenic slope failures, debris flows became more active in the Niujuan drainage basin due to the debris accumulated in the Niujuan and other channels. These debris flows proved to be a secondary hazard to roads and communication infrastructure for many months following the earthquake, a pattern observed elsewhere in the Wenchuan earthquake region.

  • Cui, P., Zhu, Y. Y., Han, Y. S., et al., 2009. The 12 May Wenchuan Earthquake-Induced Landslide Lakes: Distribution and Preliminary Risk Evaluation. Landslides, 6(3): 209–223 doi: 10.1007/s10346-009-0160-9
    Kusky, T. M., Ghulam, A., Wang, L., 2010. Poster Focusing Seismic Energy along Faults through Time-Variable Rupture Modes: Wenchuan Earthquake, China. EOS Trans. AGU, 88(54): NH43B–1321
    Sato, H. P., Harp, E. L., 2009. Interpretation of Earthquake-Induced Landslides Triggered by the 12 May 2008, M7.9 Wenchuan Earthquake in the Beichuan Area, Sichuan Province, China Using Satellite Imagery and Google Earth. Landslides, 6(2): 153–159 doi: 10.1007/s10346-009-0147-6
    Wang, F. W., Cheng, Q. G., Highland, L., et al., 2009. Preliminary Investigation of Some Large Landslides Triggered by the 2008 Wenchuan Earthquake, Sichuan Province, China. Landslides, 6(1): 47–54 doi: 10.1007/s10346-009-0141-z
    Wang, W. M., Zhao, L. F., Li, J., et al., 2008. Rupture Process of the Ms 8.0 Wenchuan Earthquake of Sichuan, China. Chinese J. Geophys. , 51(5): 1403–1410 (in Chinese with English Abstract)
    Xu, Q., Fan, X. M., Huang, R. Q., et al., 2009. Landslide Dams Triggered by the Wenchuan Earthquake, Sichuan Province, South West China. Bulletin of Engineering Geology and the Environment, 68(3): 373–386 doi: 10.1007/s10064-009-0214-1
    Yin, Y. P., Wang, F. W., Sun, P., 2009. Landslide Hazards Triggered by the 2008 Wenchuan Earthquake, Sichuan, China. Landslides, 6(2): 139–152 doi: 10.1007/s10346-009-0148-5
  • Relative Articles

    [1]Yangyang Wang, Sijia Li, Shiyuan Wang, Deyang Shi, Weibing Shen. Comparative Mineralogical and Geochemical Compositions within the Fault Gouge in the Surface Exposures of the Mw7.9 Wenchuan Earthquake Fault and Their Implications for Mass Removal and Fluid-Rock Interactions[J]. Journal of Earth Science, 2025, 36(1): 266-274. doi: 10.1007/s12583-021-1572-2
    [2]Xuyang Xiang, Wenping Gong, Fumeng Zhao, Zhan Cheng, Lei Wang. Earthquake-induced Landslide Mapping in Mountainous Areas Using A Semantic Segmentation Model Combined with A Dual Feature Pyramid[J]. Journal of Earth Science. doi: 10.1007/s12583-023-1956-6
    [3]Hao Zheng, Mingtao Ding, Tao Huang, Zemin Gao. Benefit Evaluation of Geotechnical Projects for Debris Flow Prevention and Control Based on Projection Pursuit in Wenchuan County, SW China[J]. Journal of Earth Science, 2025, 36(2): 700-716. doi: 10.1007/s12583-022-1730-1
    [4]Liang Yang, Yang Wang, Kang Liao, Longfei Zhang, Aiyun Chen, Juan Du. Initiation and Kinematic Process of Debris Flow with the Existence of Terraced Fields at the Sources[J]. Journal of Earth Science, 2024, 35(5): 1613-1625. doi: 10.1007/s12583-022-1633-1
    [5]Yuzhu Bai, Chong Xu. Qualitative Analyses of Correlations between Strong Ground Motions of the Three Large Earthquakes and Landslide Distributions[J]. Journal of Earth Science, 2023, 34(2): 369-380. doi: 10.1007/s12583-021-1496-x
    [6]Siyuan Ma, Chong Xu. Applicability of Two Newmark Models in the Assessment of Coseismic Landslide Hazard and Estimation of Slope-Failure Probability: An Example of the 2008 Wenchuan Mw7.9 Earthquake Affected Area[J]. Journal of Earth Science, 2019, 30(5): 1020-1030. doi: 10.1007/s12583-019-0874-0
    [7]Jiwei Jiang, Wei Xiang, Wei Zhang, Jiajun Pan. Deformation forecasting of huangtupo riverside landslide in the case of frequent microseisms[J]. Journal of Earth Science, 2016, 27(1): 160-166. doi: 10.1007/s12583-016-0617-4
    [8]Zon-Yee Yang, Hamid Reza Pourghasemi, Yen-Hung Lee. Fractal analysis of rainfall-induced landslide and debris flow spread distribution in the Chenyulan Creek Basin, Taiwan[J]. Journal of Earth Science, 2016, 27(1): 151-159. doi: 10.1007/s12583-016-0633-4
    [9]Chong Xu, Xiwei Xu, Yingying Tian, Lingling Shen, Qi Yao, Xueqiang Huang, Junxue Ma, Xi Chen, Siyuan Ma. Two comparable earthquakes produced greatly different coseismic landslides: The 2015 Gorkha, Nepal and 2008 Wenchuan, China events[J]. Journal of Earth Science, 2016, 27(6): 1008-1015. doi: 10.1007/s12583-016-0684-6
    [10]Xianghui QIN, Chengxuan TAN, Qunce CHEN, Manlu WU, Chengjun FENG. Crustal stress state and seismic hazard along southwest segment of the Longmenshan thrust belt after Wenchuan Earthquake[J]. Journal of Earth Science, 2014, 25(4): 676-688. doi: 10.1007/s12583-014-0457-z
    [11]Zhiqiang Yin, Wuji Zhao, Xiaoguang Qin. Distribution Characteristics of Geohazards Induced by the Lushan Earthquake and Their Comparisons with the Wenchuan Earthquake[J]. Journal of Earth Science, 2014, 25(5): 912-923. doi: 10.1007/s12583-014-0471-1
    [12]Hongjuan Yang, Fangqiang Wei, Kaiheng Hu. Mean Velocity Estimation of Viscous Debris Flows[J]. Journal of Earth Science, 2014, 25(4): 771-778. doi: 10.1007/s12583-014-0465-z
    [13]Zhikun Ren, Zhuqi Zhang, Jinhui Yin, Fuchu Dai, Huiping Zhang. Morphogenic Uncertainties of the 2008 Wenchuan Earthquake: Generating or Reducing?[J]. Journal of Earth Science, 2014, 25(4): 668-675. doi: 10.1007/s12583-014-0456-0
    [14]Huali Pan, Jiangcheng Huang, Ren Wang, Guoqiang Ou. Rainfall Threshold Calculation Method for Debris Flow Pre-Warning in Data-Poor Areas[J]. Journal of Earth Science, 2013, 24(5): 854-862. doi: 10.1007/s12583-013-0377-3
    [15]Fangqiang Wei, Hongjuan Yang, Kaiheng Hu, Sergey Chernomorets. Measuring Internal Velocity of Debris Flows by Temporally Correlated Shear Forces[J]. Journal of Earth Science, 2012, 23(3): 373-380. doi: 10.1007/s12583-012-0258-1
    [16]Chong Xu, Xiwei Xu, Fuchu Dai, Jianzhang Xiao, Xibin Tan, Renmao Yuan. Landslide Hazard Mapping Using GIS and Weight of Evidence Model in Qingshui River Watershed of 2008 Wenchuan Earthquake Struck Region[J]. Journal of Earth Science, 2012, 23(1): 97-120. doi: 10.1007/s12583-012-0236-7
    [17]Wenbin Shen, Dijin Wang, Cheinway Hwang. Anomalous Signals Prior to Wenchuan Earthquake Detected by Superconducting Gravimeter and Broadband Seismometers Records[J]. Journal of Earth Science, 2011, 22(5): 640-640. doi: 10.1007/s12583-011-0215-4
    [18]Kusky Timothy M, Abduwasit Ghulam, Lu Wang, Jianguo Liu, Zhongquan Li, Xiao Chen. Focusing Seismic Energy along Faults through Time-Variable Rupture Modes: Wenchuan Earthquake, China[J]. Journal of Earth Science, 2010, 21(6): 910-922. doi: 10.1007/s12583-010-0144-7
    [19]Huiming Tang, Hongbiao Jia, Xinli Hu, Dewei Li, Chengren Xiong. Characteristics of Landslides Induced by the Great Wenchuan Earthquake[J]. Journal of Earth Science, 2010, 21(1): 104-113. doi: 10.1007/s12583-010-0008-1
    [20]Kunlong Yin, Guirong Zhang, Liangfeng Zhu. Overview Landslide Hazard Assessment of China[J]. Journal of Earth Science, 2004, 15(3): 306-311.
  • Created with Highcharts 5.0.7Amount of accessChart context menuAbstract Views, HTML Views, PDF Downloads StatisticsAbstract ViewsHTML ViewsPDF Downloads2024-062024-072024-082024-092024-102024-112024-122025-012025-022025-032025-042025-0502468
    Created with Highcharts 5.0.7Chart context menuAccess Class DistributionFULLTEXT: 42.8 %FULLTEXT: 42.8 %META: 57.2 %META: 57.2 %FULLTEXTMETA
    Created with Highcharts 5.0.7Chart context menuAccess Area Distribution其他: 1.8 %其他: 1.8 %China: 61.3 %China: 61.3 %Reserved: 2.7 %Reserved: 2.7 %Russian Federation: 5.9 %Russian Federation: 5.9 %Spain: 2.3 %Spain: 2.3 %United States: 26.1 %United States: 26.1 %其他ChinaReservedRussian FederationSpainUnited States

Catalog

    通讯作者: 陈斌, bchen63@163.com
    • 1. 

      沈阳化工大学材料科学与工程学院 沈阳 110142

    1. 本站搜索
    2. 百度学术搜索
    3. 万方数据库搜索
    4. CNKI搜索

    Figures(11)

    Article Metrics

    Article views(999) PDF downloads(23) Cited by()
    Proportional views
    Related

    /

    DownLoad:  Full-Size Img  PowerPoint
    Return
    Return