Processing math: 100%
Advanced Search

Indexed by SCI、CA、РЖ、PA、CSA、ZR、etc .

David A. Wood. Re-Establishing the Merits of Thermal Maturity and Petroleum Generation Multi-Dimensional Modeling with an Arrhenius Equation Using a Single Activation Energy. Journal of Earth Science, 2017, 28(5): 804-834. doi: 10.1007/s12583-017-0735-7
Citation: David A. Wood. Re-Establishing the Merits of Thermal Maturity and Petroleum Generation Multi-Dimensional Modeling with an Arrhenius Equation Using a Single Activation Energy. Journal of Earth Science, 2017, 28(5): 804-834. doi: 10.1007/s12583-017-0735-7

Re-Establishing the Merits of Thermal Maturity and Petroleum Generation Multi-Dimensional Modeling with an Arrhenius Equation Using a Single Activation Energy

doi: 10.1007/s12583-017-0735-7
More Information
  • Corresponding author: David A. Wood, dw@dwasolutions.com
  • Received Date: 25 Feb 2017
  • Accepted Date: 03 May 2017
  • Publish Date: 01 Oct 2017
  • Thermal maturation and petroleum generation modeling of shales is essential for successful exploration and exploitation of conventional and unconventional oil and gas plays. For basin-wide unconventional resource plays such modeling, when well calibrated with direct maturity measurements from wells, can characterize and locate production sweet spots for oil, wet gas and dry gas. The transformation of kerogen to petroleum is associated with many chemical reactions, but models typically focus on first-order reactions with rates determined by the Arrhenius Equation. A misconception has been perpetuated for many years that accurate thermal maturity modeling of vitrinite reflectance using the Arrhenius Equation and a single activation energy, to derive a time-temperature index (∑TTIARR), as proposed by Wood (1988), is flawed. This claim was initially made by Sweeney and Burnham (1990) in promoting their "EasyRo" method, and repeated by others. This paper demonstrates through detailed multi-dimensional burial and thermal modeling and direct comparison of the ∑TTIARR and "EasyRo" methods that this is not the case. The ∑TTIARR method not only provides a very useful and sensitive maturity index, it can reproduce the calculated vitrinite reflectance values derived from models based on multiple activation energies (e.g., "EasyRo"). Through simple expressions the ∑TTIARR method can also provide oil and gas transformation factors that can be flexibly scaled and calibrated to match the oil, wet gas and dry gas generation windows. This is achieved in a more-computationally-efficient, flexible and transparent way by the ∑TTIARR method than the "EasyRo" method. Analysis indicates that the "EasyRo" method, using twenty activation energies and a constant frequency factor, generates reaction rates and transformation factors that do not realistically model observed kerogen behaviour and transformation factors over geologic time scales.


  • Since the early 1970's attempts have been made to model thermal maturity of sediments in terms of their time-temperature history derived from burial history modeling (Pigott, 1985; Nunn et al., 1984; Royden and Keen, 1980; Hood et al., 1975; Lopatin, 1971). Waples (1982) developed the Lopatin time-temperature index (TTILOP) to model the evolution of vitrinite reflectance (a direct measure of thermal maturity) with the over-simplistic assumption that the vitrinite reaction rate doubled for every 10 ℃ increase in temperature. Following the work of Tissot and Espitalié (1975) expanded in Tissot and Welte (1984) the significance of first-order reactions with rates determined by the Arrhenius Equation became the focus for explaining the transformation of kerogen to petroleum and modeling vitrinite reflectance.

    Since the 1980s several models based upon the Arrhenius Equation were proposed to model the thermal maturity to predict vitrinite reflectance (Ro). Lerche et al. (1984) suggested Arrhenius Equation modeling with a single activation energy (E), which varied as a function of temperature. Wood (1988) proposed the ∑TTIARR method involving cumulative integration of the Arrhenius Equation based upon a single E value and pre-exponential factor (A), derived from published kerogen kinetic data representative of Type Ⅱ and Type Ⅲ kerogens. That method significantly improved upon the Lopatin method, and highlighted the importance of using the gradient relationship of E versus loge A, spanning a wide range of E values for known kerogens at that time, to calculate the transformation factors of specific shales. Larter(1989, 1988) proposed using a normal distribution of activation energies representing a series of parallel first-order Arrhenius reactions to model vitrinite maturation.

    Sweeney and Burnham (1990) dismissed all the thermal maturation models based on the Arrhenius Equation that applied just a single activation energy (e.g., including the ∑TTIARR method of Wood, 1988) as "flawed" with the single statement (quote) "[such models of vitrinite maturation] are flawed because a single reaction does not adequately model complex reactions over a wide range of temperatures and heating rates (Braun and Burnham, 1987)" (unquote). Based on a chemical kinetic model (Burnham & Sweeney, 1989), the models of Wood (1988) and Larter(1989, 1988) were further described as "limited" because their correlations with vitrinite reflectance were focused upon the oil window. Judging by citations of the alternative Sweeney and Burnham (1990) "EasyRo" maturation model using a distribution of twenty activation energies (centred close to the E value proposed by Wood, 1988) but with a constant pre-exponential factor, it seems, unfortunately, that many researchers and basin-model providers to the industry have accepted the semis leading assertions. The objectives of this study are to demonstrate that not only are these assertions inaccurate, but also such single-activation-energy thermal maturity models can be used to advantage, compared to "EasyRo", to flexibly model in multiple dimensions the thermal maturation and petroleum transformation factors associated with a range of kerogen types. Nielsen and Barth (1991a) questioned the kinetic validity of the "EasyRo" model, as it did not adequately explain the observed vitrinite——Rock-Eval Tmax relationships, but there are no other published criticisms of that method.

    Several studies since the 1990s have reviewed thermal maturation modeling methodologies involving distributions of Arrhenius equations to model vitrinite and other kerogens (Cornford, 2009; Stainforth, 2009; Dieckmann, 2005; Pepper and Corvi, 1995). Some experiments have been conducted to evaluate the various factors influencing vitrinite maturation (Huang, 1996), concluding that temperature and time are the primary factors, with pressure, fluid chemistry and fluid flow playing minor roles. The effects of sulphur and some metals in accelerating kerogen reactions are well known (Eglinton et al., 1990; Orr, 1986; Lewan et al., 1985). Lewan (1997) demonstrated that water plays an important role in kerogen and petroleum cracking reactions.

    Many studies and experiments since the 1980s have focused on kerogen kinetics (Burnham, 2017; Ducros, 2016; Lehne and Dieckmann, 2007; Schaefer et al., 1999; Tegelaar and Noble, 1994; Klomp and Wright, 1989; Ungerer et al., 1988; Ungerer and Pelet, 1987; Lewan et al., 1985; Mackenzie et al., 1984; Snowdon, 1979), cracking of oil and liquid products (Ma, 2016; Vandenbroucke et al., 1999; Schenk et al., 1997) pyrolysis analysis methodologies (Behar et al., 1997; Reynolds et al., 1995; Ritter et al., 1995; Espitalié et al., 1988; Peters, 1986), attempts to correlate Rock-Eval Tmax values with vitrinite reflectance (Jarvie, 2014, 1991; Sykes and Snowdon, 2002; Jarvie and Lundell, 2001; Espitalié, 1986; Saxby et al., 1986), and to extract kinetic data from Rock-Eval results (Chen et al., 2017).

    Disagreements have persisted between laboratories since the 1980s regarding the accuracy and suitability of various pyrolysis methods. For example: (1) hydrous pyrolysis (Lewan and Ruble, 2002; Lewan, 1997; Marzi et al., 1990; Nielsen and Barth, 1991a; Lewan et al., 1985) versus open-system pyrolysis (Burnham, 1998) involve discrepancies in the transformation ratios for source rocks derived from them; (2) one run, open-system pyrolysis (cheap and quick to perform) using a single-heating ramp and fixed frequency factor (Waples, 2016; Waples and Nowaczewski, 2013) versus multiple-ramp (time consuming and expensive) open-system pyrolysis with frequency factors optimized for each analysis rather than fixed (Peters et al., 2015) are known to produce different results for the same shales. These disagreements over the validity and errors associated with pyrolysis-derived kinetic variables for source rocks is relevant to this work, because it adds uncertainties to the appropriate kinetic values to use for specific rock formations in thermal maturation models. These ongoing discrepancies between pyrolysis methods and laboratories reduce confidence in the petroleum transformation factors derived from specific kinetic assumptions.

    There are three key objectives of the work presented.

    (A) To confirm, using detailed multi-dimensional burial and thermal model comparisons, that the Arrhenius thermal maturity index method (∑TTIARR) proposed by Wood (1988) is not only effective, but also can be used in a more computationally effective, flexible and transparent way than the "EasyRo" method. The mathematical basis for the model and its relationship with actual kerogen kinetics published since the 1970s and displayed on geological time scale is clearly established, together with its systematic relationship with vitrinite reflectance.

    (B) To consider the relationship between the calculated ∑TTIARR thermal maturity index and oil and gas generation (i.e., the transformation of kerogen into oil and/or gas). Whereas the (∑TTIARR) thermal maturity index and its relationship to Ro can meaningfully be based on a single set of Arrhenius Equation kinetics (i.e., one pair of A-E values), oil and gas generation (in terms of transformation factors) often require two or more A-E pairs to reproduce petroleum generation from specific source rocks.

    (C) To demonstrate that petroleum generation from a source rock can typically be effectively modeled by the (∑TTIARR) method with the Arrhenius Equation using just two or three A-E pairs, without recourse to large distributions of kerogen kinetics. Such an approach greatly simplifies adapting the model for multi-dimensional burial histories involving variable heating rates and periods of uplift (cooling), non-deposition and erosion.

    The detailed formulation of (∑TTIARR) is provided by Wood (1988). It involves an integration of the Arrhenius Equation. Svante Arrhenius proposed his useful relationship in 1889 (1) (Arrhenius, 1889).

    KARR=AeE/RT (1)

    where KARR is the reaction rate coefficient (constant) of a first-order Arrhenius reaction, expressed in laboratory experiments in s-1 (per second) but in geological time scales more usefully expressed in Ma-1 (per millions of years). A first-order reaction depends on the concentration of only one reactant (typically a unimolecular reaction). As kerogens have complex molecular structures the first-order assumption is clearly an approximation. Where e signifies the mathematical exponent (exp); A is the pre-exponential factor, a constant (Ma-1) related to the frequency of collisions at the molecular level for reactions to proceed; E is the activation energy for the reaction (typically expressed in kJ/mol; although, U.S. laboratories use kcal/mol); R is the universal gas constant (0.008 314 kj/mol); T is the absolute temperature (in degrees Kelvin oK).

    The exp(-E/RT) component of the Arrhenius Equation indicates the temperature dependence of a reaction determined by its activation, whereas A is independent of temperature but determines the time scale over which a reaction completes. The incremental progression of a reaction over time (t) towards complete transformation of reactants to products is related to KARR in expression (2).

    dXdt=KARRX (2)

    where X is the amount of reactant (kerogen) yet to be converted into (petroleum-type) products. The Arrhenius Equation can also be used to calculate a time-temperature index for a reaction to measure its progress over a defined scale. To achieve this, it is necessary to multiply the integral of Eq. (1) by the time spent at each specific temperature (A/qn) (3) (Eq. 11, Wood, 1988).

    TTIARR(tntotn+1)=Aqntn+1tneE/RTdT (3)

    where TTIARR is the component of the time-temperature index for a specific time interval (tn to tn+1). qn is the heating rate, which in basin scale terms is determined by the geothermal gradient. The time intervals are typically selected such that geothermal gradients are constant for each time interval, but can vary over the burial history as a whole. At the rock formation scale heating rate is also dependent upon its thermal conductivity determining the heat flux to which individual kerogen fragments contained within it are subjected.

    The integral in Eq. (3) can be determined to sufficient accuracy applying Gorbachev's (1975) for each specific temperature (Tn+1 in oK) relative to the initial point on the temperature scale (i.e., Tn=0 oK) (Eq. 12, Wood, 1988).

    TTIARR(tntotn+1Tn=0K)=AqnRT2n+1E+2RTn+1eE/RTn+1 (4)

    Tn=0 oK refers to a starting temperature of zero degrees Kelvin (0 oK). Equation (4) is more usefully expressed by the difference between its values between the starting and ending temperatures of a specified time interval (in cases where the temperature does not remain constant) (5) (Eq. 13, Wood, 1988).

    TTIARR(tntotn+1TnTn+1)=Aqn[RT2n+1E+2RTn+1eE/RTn+1RT2nE+2RTneE/RTn] (5)

    Equation (5) adequately determines TTIARR for most burial (or erosion/uplift) intervals, which involve a change in temperature for a specific rock formation. However, in some time intervals temperature remains constant and Eq. (5) does not meaningfully determine the time-temperature reaction increment for that period of time. In such cases Eq. (6) (Eq. 14, Wood, 1988) is applied.

    TTIARR(tntotn+1Tn=Tn+1)=(tn+1tn)AeE/RTn (6)

    To provide a multi-dimensional time-temperature index over an entire burial history (involving m discrete burial intervals and potentially including some intervals of uplift and erosion) the values of Eqs. (5) or (6) (as applicable) for each interval are summed to provide the cumulative integral ∑TTIARR for each horizon modeled at each geological time specified. This is achieved by Eq. (7) (abbreviated Eq. 14, Wood, 1988).

    TTIARR=n=mn=1Tn=Tn+1Eq.(5)+n=mn=1Tn=Tn+1Eq.(6) (7)

    Although these equations are lengthy to write they are easily programmed, requiring only the standard burial history inputs of formation thicknesses, age (Ma), geothermal gradient for each period of burial and surface temperature. From those inputs a burial history algorithm will calculate the temperatures at the beginning and end of each burial interval at each horizon modeled for a multi-dimensional model. For a specified value(s) of the Arrhenius Equation kinetic metrics (A and E), Eq. (7) can provide the ∑TTIARR for each formation at each interval of burial (or uplift). This author has been using spreadsheet-based models (some driven by VBA code to facilitate rapid sensitivity analysis) to derive this index in applied burial and thermal history and petroleum generation studies since the 1980s (Wood, 1990).

    As pointed out by Wood (1988) the detailed transformation of kerogen to petroleum, based on the widely-accepted Tissot and Espitalié (1975) concepts, can be approximated by a series of weighted parallel, first-order reactions, the weightings of which will vary according to kerogen type. However, for calculating a general-purpose scale of thermal maturity that could be calibrated universally to direct measures of thermal maturity (e.g., vitrinite reflectance Ro; other optical measures (Hartkopf-Fröder et al., 2015); C-29 sterane ratios or other geochemical metrics) a single first-order Arrhenius reaction, with values of A and E close to the average reaction rates of kerogens over geological time scales, could be used. Figure 1 supports that claim.

    Figure  1.  Correlation between calculated vitrinite reflectance (Ro) (EasyRo method) and ∑TTIARR thermal maturity index (Wood, 1988 method). ∑TTIARR is calculated using a single activation energy of 218 kJ/mol (52.1 kcal/mol) by the exact method proposed by Wood (1988). The 155 data points come from eleven-varied burial-history cases modeled (including six cases from Wood, 1988), representative of the multiple dimensions of petroleum producing basins.

    For each first-order Arrhenius reaction a transformation factor can be readily calculated. The concentration of kerogen yet-to-be transformed into petroleum at time t (Yt) can be related to kerogen available for transformation initially (i.e., before petroleum generation commences Yo) by Eq. (8) (Eq. 17, Wood, 1988).

    Yt=Yoekt (8)

    If Yo is set to 1 then Yt expresses the fraction of convertible kerogen remaining at time t (Xt). ∑TTIARR represents the (-kt) component in Eq. (8). Therefore, Eq. (8) can be expressed on a scale of 1 (no conversion) to 0 (full conversion) by Eq. (9) (Eq. 18, Wood, 1988).

    Xt=eTTIARR (9)

    This is often more usefully expressed in basin modeling as a transformation factor (TFt), applying a scale of 0 (transformation of kerogen to petroleum not yet commenced) to 1 (transformation of kerogen to petroleum completed) by Eq. (10).

    TFt=1Xt (10)

    Hence, Eqs. (7), (9) and (10) represent the basis of the method described and evaluated here and proposed by Wood (1988). The scale ∑TTIARR varies from initial values of less than 1E-15 (log10 ∑TTIARR= -15) at shallow burial for short periods, to 1E+11 (log10 ∑TTIARR= +11) in the deepest parts of sedimentary basins buried over long periods of geological time. For the petroleum generation window, and the correlation applied in this study (updated from Wood, 1988) between ∑TTIARR scale and vitrinite reflectance, the ∑TTIARR scale varies from < 1E-4 ( < log10 ∑TTIARR of -4) for Ro ~0.5% to 1E+3 (1 000) (log10 ∑TTIARR of +3) for Ro ~2.0%.

    The wide (eight orders of magnitude) ranging ∑TTIARR scale across the oil and gas generation window has useful benefits for detailed petroleum-basin modeling. For instance, it can be used to provide detailed maturity characterization of potential production sweet spots in mature shale plays, linked to features such as ethane C-isotope rollovers and reversals and gas wetness reversals (Yang et al., 2017; Tilley and Muehlenbachs, 2013). The Ro-scale is not always sensitive enough to achieve such distinctions. Although it is used almost universally as a maturity indicator, Ro is well known to provide scattered values in many formations (e.g., Hackley and Cardott, 2016). Hence, the direct measurement of Ro by petrographic techniques cannot always be relied upon to provide consistent results (Hackley et al., 2015).

    To compare the performance of the ∑TTIARR (Wood, 1988) thermal maturity index with the "EasyRo" method (Sweeney and Burnham, 1990) for modeling vitrinite reflectance eleven detailed, and in some cases complex, burial-history cases are analysed and presented. These include the six cases (examples 1 to 6) presented by Wood (1988), and five new ones (examples 7 to 11) to explore the wide range of burial scenarios typically found in petroleum-generating sedimentary basins around the world. Examples 7 to 11 are added specifically to provide greater coverage of higher thermal maturities associated with the gas window and beyond (1% < Ro < 4.0%).

    Tables 1 to 11 summarize the results of multi-dimensional burial history models calculating thermal maturity using the ∑TTIARR and "EasyRo" methods comparing the calculated vitrinite reflectance of each method. The two thermal maturation models, developed in Excel spreadsheets driven by VBA macros by this author, use the exact formulations of the two techniques as originally presented, with the exception that an updated correlation with Ro is applied to the ∑TTIARR method.

    Table  1.  Multi-dimension thermal maturation model summary for Example 1 burial history comparing calculated Ro for ArrTTI and EasyRo methods
    Multi-dimensional burial and thermal history generated from inputing the deepest formation as a burial history Arrhenius equation time-temperature index (TTI) single activation energy model: E=218 kj/mol (52.1 kcal/mol); A=5.45E26 Ma-1 EasyRo model 20-variably-weighted activation energies
    Burial interval Depth to formation tops (m) Time/age (Ma) Burial rate dz/dt (m/Ma) Temperature gradient (ºC/m) Heating rate dT/dt (ºC/Ma) Temperature (ºC) Thermal maturity index modelled ∑TTIARR Thermal maturity index modelled log10 ∑TTI Model calculated vitrinite reflectance (Ro Calc) Fraction of kerogen converted to liquid petroleum Fraction of kerogen converted to gaseous petroleum EasyRo calculated vitrinite reflectance (Ro "Easy")
    Multiple burial intervals modeled Time (b.p.) Burial and thermal history of deepest horizon (Top FM11) Example 1 Oil window Gas window Example 1
    Surface interval 0 25 Deposition of FM11 begins 21.0 Deposited Deposited Deposited Deposited Deposited Deposited
    End interval 1 500 20 100.0 0.036 3.60 39.0 1.81E-10 -9.74 0.23 0 0 0.28
    End interval 2 1 300 15 160.0 0.036 5.76 67.8 1.63E-07 -6.79 0.36 0 0 0.36
    End interval 3 1 540 14 240.0 0.036 8.64 76.4 8.18E-07 -6.09 0.39 0 0 0.39
    End interval 4 1 780 13 240.0 0.036 8.64 85.1 4.95E-06 -5.31 0.43 0 0 0.43
    End interval 5 2 020 12 240.0 0.036 8.64 93.7 2.88E-05 -4.54 0.48 0 0 0.48
    End interval 6 2 260 11 240.0 0.036 8.64 102.4 1.56E-04 -3.81 0.53 0 0 0.53
    End interval 7 2 500 10 240.0 0.036 8.64 111.0 7.84E-04 -3.11 0.58 0.001 0 0.59
    End interval 8 3 000 5 100.0 0.036 3.60 129.0 4.26E-02 -1.37 0.76 0.042 0.000 4 0.75
    End interval 9 3 900 3 450.0 0.036 16.20 161.4 1.49E+00 0.17 0.99 0.776 0.014 8 0.99
    End interval 10 4 600 2 700.0 0.036 25.20 186.6 2.92E+01 1.47 1.34 1 0.253 4 1.36
    End interval 11 5 000 0 200.0 0.036 7.20 201.0 5.31E+02 2.73 1.80 1 0.995 1 1.85
    Formation name Depth to base FM (m) Age of formation top (Ma) Present-day depth profile of each formation top modeled One-dimensional thermal maturity of present-day formation sequence What is calculated by one-dimensional EasyRo model
    FM1 400 2 35.4 3.28E-11 -10.48 0.20 0 0 0.26
    FM2 1 100 3 60.6 2.33E-08 -7.63 0.32 0 0 0.33
    FM3 2 000 5 93.0 2.88E-05 -4.54 0.48 0 0 0.48
    FM4 2 500 10 111.0 8.97E-04 -3.05 0.58 0.001 0 0.60
    FM5 2 740 11 119.6 4.18E-03 -2.38 0.65 0.004 0 0.65
    FM6 2 980 12 128.3 1.82E-02 -1.74 0.71 0.018 0 0.71
    FM7 3 220 13 136.9 7.48E-02 -1.13 0.79 0.072 0.001 0.77
    FM8 3 460 14 145.6 2.89E-01 -0.54 0.87 0.251 0.003 0.85
    FM9 3 700 15 154.2 1.06E+00 0.03 0.97 0.654 0.011 0.95
    FM10 4 500 20 183.0 5.65E+01 1.75 1.44 1 0.432 1.45
    FM11 5 000 25 201.0 5.31E+02 2.73 1.80 1 0.995 1.85
     | Show Table
    DownLoad: CSV
    Table  2.  Multi-dimension thermal maturation model summary for Example 2 burial history comparing calculated Ro for ArrTTI and EasyRo methods
    Multi-dimensional burial and thermal history generated from inputing the deepest formation as a burial history Arrhenius equation time-temperature index (TTI) single activation energy model: E=218 kj/mol (52.1 kcal/mol); A=5.45E26 Ma-1 EasyRo model 20-variably-weighted activation energies
    Burial interval Depth to formation tops (m) Time/age (Ma) Burial rate dz/dt (m/Ma) Temperature gradient (ºC/m) Heating rate dT/dt (ºC/Ma) Temperature (ºC) Thermal maturity index modelled ∑TTIARR Thermal maturity index modelled log10 ∑TTI Model calculated vitrinite reflectance (Ro Calc) Fraction of kerogen converted to liquid petroleum Fraction of kerogen converted to gaseous petroleum EasyRo calculated vitrinite reflectance (Ro "Easy")
    Multiple burial intervals modeled Time (b.p.) Burial and thermal history of deepest horizon (Top FM12) Example 2 Oil window Gas window Example 2
    Surface interval 0 112 Deposition of FM12 begins 21.0 Deposited Deposited Deposited Deposited Deposited Deposited
    End interval 1 625 111 625.0 0.040 0 25.00 46.0 1.72E-10 -9.76 0.23 0 0 0.27
    End interval 2 1 250 110 625.0 0.040 0 25.00 71.0 7.82E-08 -7.11 0.34 0 0 0.34
    End interval 3 2 000 107 250.0 0.040 0 10.00 101.0 1.04E-04 -3.98 0.51 0 0 0.51
    End interval 4 2 500 105 250.0 0.040 0 10.00 121.0 4.02E-03 -2.40 0.64 0.004 0 0.65
    End interval 5 2 980 103 240.0 0.040 0 9.60 140.2 1.01E-01 -1.00 0.81 0.096 0 0.78
    End interval 6 3 220 102 240.0 0.040 0 9.60 149.8 4.47E-01 -0.35 0.90 0.360 0.004 0.88
    End interval 7 3 700 100 240.0 0.040 0 9.60 169.0 7.20E+00 0.86 1.16 0.999 0.069 1.17
    End interval 8 4 000 95 60.0 0.040 0 2.40 181.0 1.24E+02 2.09 1.55 1 0.710 1.56
    End interval 9 4 800 65 26.7 0.035 0 0.27 189.0 2.50E+03 3.40 2.12 1 1.000 2.12
    End interval 10 5 300 40 20.0 0.030 0 -0.36 180.0 4.37E+03 3.64 2.24 1 1 2.23
    End interval 11 5 300 25 0.0 0.027 5 -0.88 166.8 4.66E+03 3.67 2.26 1 1 2.24
    End interval 12 6 000 0 28.0 0.027 5 0.77 186.0 5.46E+03 3.74 2.29 1 1 2.26
    Formation name Depth to base FM (m) Age of formation top (Ma) Present-day depth profile of each formation top modeled One-dimensional thermal maturity of present-day formation sequence What is calculated by one-dimensional EasyRo model
    FM1 700 25 40.3 1.19E-09 -8.92 0.26 0 0 0.30
    FM2 700 40 40.3 1.21E-09 -8.92 0.26 0 0 0.30
    FM3 1 200 65 54.0 4.50E-08 -7.35 0.33 0 0 0.35
    FM4 2 000 95 76.0 8.39E-06 -5.08 0.45 0 0 0.45
    FM5 2 300 100 84.3 5.13E-05 -4.29 0.49 0 0 0.51
    FM6 2 780 102 97.5 8.10E-04 -3.09 0.58 0.001 0 0.61
    FM7 3 020 103 104.1 3.05E-03 -2.52 0.63 0.003 0 0.65
    FM8 3 500 105 117.3 3.92E-02 -1.41 0.75 0.038 0 0.75
    FM9 4 000 107 131.0 5.04E-01 -0.30 0.91 0.396 0.005 0.89
    FM10 4 750 110 151.6 1.95E+01 1.29 1.29 1 0.177 1.27
    FM11 5 375 111 168.8 3.53E+02 2.55 1.73 1 0.971 1.71
    FM12 6 000 112 186.0 5.46E+03 3.74 2.29 1 1 2.26
     | Show Table
    DownLoad: CSV
    Table  3.  Multi-dimension thermal maturation model summary for Example 3 burial history comparing calculated Ro for ArrTTI and EasyRo methods
    Multi-dimensional burial and thermal history generated from inputing the deepest formation as a burial history Arrhenius equation time-temperature index (TTI) single activation energy model: E=218 kj/mol (52.1 kcal/mol); A=5.45E26 Ma-1 EasyRo model 20-variably-weighted activation energies
    Burial interval Depth to formation tops (m) Time/age (Ma) Burial rate dz/dt (m/Ma) Temperature gradient (ºC/m) Heating rate dT/dt (ºC/Ma) Temperature (ºC) Thermal maturity index modelled ∑TTIARR Thermal maturity index modelled log10 ∑TTI Model calculated vitrinite reflectance (Ro Calc) Fraction of kerogen converted to liquid petroleum Fraction of kerogen converted to gaseous petroleum EasyRo calculated vitrinite reflectance (Ro "Easy")
    Multiple burial intervals modeled Time (b.p.) Burial and thermal history of deepest horizon (Top FM9) Example 3 Oil window Gas window Example 3
    Surface interval 0 10.0 Deposition FM9 begins 21.0 Deposited Deposited Deposited Deposited Deposited Deposited
    End interval 1 600 7.0 200.0 0.018 3 3.67 32.0 2.38E-11 -10.62 0.20 0 0 0.26
    End interval 2 1 137 6.0 537.0 0.018 3 9.80 41.8 1.58E-10 -9.80 0.22 0 0 0.28
    End interval 3 2 750 4.5 1 075.3 0.018 3 19.67 71.3 1.07E-07 -6.97 0.35 0 0 0.35
    End interval 4 3 750 4.3 5 000.0 0.018 3 90.00 89.3 1.21E-06 -5.92 0.40 0 0 0.39
    End interval 5 4 710 4.1 4 800.0 0.018 3 89.50 107.2 3.75E-05 -4.43 0.48 0 0 0.47
    End interval 6 5 200 4.0 4 900.0 0.018 3 90.00 116.2 1.92E-04 -3.72 0.53 0.000 2 0 0.52
    End interval 7 6 725 3.5 3 050.0 0.018 3 55.80 144.1 3.18E-02 -1.50 0.74 0.031 3 0.000 3 0.73
    End interval 8 8 250 3.0 3 050.0 0.018 3 55.80 172.0 1.86E+00 0.27 1.01 0.845 0 0.018 5 1.02
    End interval 9 11 000 0.0 916.7 0.018 3 16.77 222.3 3.03E+03 3.48 2.16 1 1 2.25
    Formation name Depth to base FM (m) Age of formation top (Ma) Present-day depth profile of each formation top modeled One-dimensional thermal maturity of present-day formation sequence What is calculated by one-dimensional EasyRo model
    FM1 2 750 3.0 71.3 1.25E-07 -6.90 0.35 0 0 0.35
    FM2 4 275 3.5 99.2 4.39E-05 -4.36 0.49 0 0 0.49
    FM3 5 800 4.0 127.1 6.86E-03 -2.16 0.67 0.007 0 0.67
    FM4 6 290 4.1 136.1 3.01E-02 -1.52 0.74 0.030 0 0.73
    FM5 7 270 4.3 154.0 4.83E-01 -0.32 0.91 0.383 0.005 0.89
    FM6 8 250 4.5 172.0 6.20E+00 0.79 1.14 0.998 0.060 1.16
    FM7 9 863 6.0 201.5 2.74E+02 2.44 1.69 1 0.936 1.73
    FM8 10 400 7.0 211.3 8.75E+02 2.94 1.90 1 1 1.96
    FM9 11 000 10.0 222.3 3.03E+03 3.48 2.16 1 1 2.25
     | Show Table
    DownLoad: CSV
    Table  4.  Multi-dimension thermal maturation model summary for Example 4 burial history comparing calculated Ro for ArrTTI and EasyRo methods
    Multi-dimensional burial and thermal history generated from inputing the deepest formation as a burial history Arrhenius equation time-temperature index (TTI) single activation energy model: E=218 kj/mol (52.1 kcal/mol); A=5.45E26 Ma-1 EasyRo model 20-variably-weighted activation energies
    Burial interval Depth to formation tops (m) Time/age (Ma) Burial rate dz/dt (m/Ma) Temperature gradient (ºC/m) Heating rate dT/dt (ºC/Ma) Temperature (ºC) Thermal maturity index modelled ∑TTIARR Thermal maturity index modelled log10 ∑TTI Model calculated vitrinite reflectance (Ro Calc) Fraction of kerogen converted to liquid petroleum Fraction of kerogen converted to gaseous petroleum EasyRo calculated vitrinite reflectance (Ro "Easy")
    Multiple burial intervals modeled Time (b.p.) Burial and thermal history of deepest horizon (Top FM13) Example 4 Oil window Gas window Example 4
    Surface interval 0 350 Deposition of FM13 begins 21.0 Deposited Deposited Deposited Deposited Deposited Deposited
    End interval 1 750 325 30.0 0.032 0.96 45.0 3.44E-09 -8.46 0.28 0 0 0.31
    End interval 2 1 200 120 2.2 0.032 0.07 59.4 1.78E-06 -5.75 0.41 0 0 0.43
    End interval 3 1 475 110 27.5 0.032 0.88 68.2 2.80E-06 -5.55 0.42 0 0 0.43
    End interval 4 1 750 100 27.5 0.032 0.88 77.0 1.01E-05 -5.00 0.45 0 0 0.46
    End interval 5 2 000 95 50.0 0.032 1.60 85.0 3.14E-05 -4.50 0.48 0 0 0.49
    End interval 6 2 600 70 24.0 0.032 0.77 104.2 2.47E-03 -2.61 0.62 0.002 5 0 0.64
    End interval 7 3 300 65 140.0 0.032 4.48 126.6 2.55E-02 -1.59 0.73 0.025 2 0.000 3 0.73
    End interval 8 3 800 57 62.5 0.032 2.00 142.6 6.82E-01 -0.17 0.93 0.494 2 0.006 8 0.91
    End interval 9 4 250 50 64.3 0.032 2.06 157.0 6.08E+00 0.78 1.14 0.997 7 0.059 0 1.15
    End interval 10 3 710 40 -54.0 0.032 -1.73 139.7 1.28E+01 1.11 1.23 1 0.120 1 1.22
    End interval 11 3 170 30 -54.0 0.032 -1.73 122.4 1.33E+01 1.12 1.24 1 0.124 5 1.23
    End interval 12 2 900 25 -54.0 0.032 -1.72 113.8 1.33E+01 1.12 1.24 1 0.124 7 1.23
    End interval 13 2 600 0 -12.0 0.032 -0.38 104.2 1.33E+01 1.13 1.24 1 0.124 9 1.23
    Formation name Depth to base FM (m) Age of formation top (Ma) Present-day depth profile of each formation top modeled One-dimensional thermal maturity of present-day formation sequence What is calculated by one-dimensional EasyRo model
    FM1 -300 25 Eroded Eroded Eroded Eroded Eroded Eroded Eroded
    FM2 -570 30 Eroded Eroded Eroded Eroded Eroded Eroded Eroded
    FM3 -1 110 40 Eroded Eroded Eroded Eroded Eroded Eroded Eroded
    FM4 -1 650 50 Eroded Eroded Eroded Eroded Eroded Eroded Eroded
    FM5 -1 200 57 Eroded Eroded Eroded Eroded Eroded Eroded Eroded
    FM6 -700 65 Eroded Eroded Eroded Eroded Eroded Eroded Eroded
    FM7 0 70 21.0 3.91E-06 -5.41 0.43 0 0 0.43
    FM8 600 95 40.2 2.29E-04 -3.64 0.54 0.000 2 0 0.55
    FM9 850 100 48.2 1.10E-03 -2.96 0.59 0.001 1 0 0.62
    FM10 1 125 110 57.0 5.79E-03 -2.24 0.66 0.005 8 0.000 1 0.67
    FM11 1 400 120 65.8 2.82E-02 -1.55 0.74 0.027 8 0.000 3 0.73
    FM12 1 850 325 80.2 3.25E-01 -0.49 0.88 0.277 3 0.003 2 0.86
    FM13 2 600 350 104.2 1.33E+01 1.13 1.24 1 0.124 9 1.23
     | Show Table
    DownLoad: CSV
    Table  5.  Multi-dimension thermal maturation model summary for Example 5 burial history comparing calculated Ro for ArrTTI and EasyRo methods
    Multi-dimensional burial and thermal history generated from inputing the deepest formation as a burial history Arrhenius equation time-temperature index (TTI) single activation energy model: E=218 kj/mol (52.1 kcal/mol); A=5.45E26 Ma-1 EasyRo model 20-variably-weighted activation energies
    Burial interval Depth to formation tops (m) Time/age (Ma) Burial rate dz/dt (m/Ma) Temperature gradient (ºC/m) Heating rate dT/dt (ºC/Ma) Temperature (ºC) Thermal maturity index modelled ∑TTIARR Thermal maturity index modelled log10 ∑TTI Model calculated vitrinite reflectance (Ro Calc) Fraction of kerogen converted to liquid petroleum Fraction of kerogen converted to gaseous petroleum EasyRo calculated vitrinite reflectance (Ro "Easy")
    Multiple burial intervals modeled Time (b.p.) Burial and thermal history of deepest horizon (Top FM11) Example 5 Oil window Gas window Example 5
    Surface interval 0 500 Deposition of FM11 begins 21.0 Deposited Deposited Deposited Deposited Deposited Deposited
    End interval 1 650 440 10.8 0.045 0 0.49 50.3 2.67E-08 -7.57 0.32 0 0 0.34
    End interval 2 900 435 50.0 0.045 0 2.25 61.5 1.15E-07 -6.94 0.35 0 0 0.36
    End interval 3 950 415 2.5 0.045 0 0.11 63.8 1.46E-06 -5.84 0.40 0 0 0.42
    End interval 4 1 800 390 34.0 0.045 0 1.53 102.0 8.23E-04 -3.08 0.58 0.000 8 0 0.60
    End interval 5 2 450 365 26.0 0.045 0 1.16 131.0 1.95E-01 -0.71 0.85 0.177 3 0.001 9 0.83
    End interval 6 2 850 345 20.0 0.045 0 0.91 149.3 4.33E+00 0.64 1.09 0.986 8 0.042 3 1.11
    End interval 7 3 790 310 26.9 0.045 0 1.21 191.6 1.12E+03 3.05 1.95 1 1 1.95
    End interval 8 4 600 280 27.0 0.045 0 1.22 228.0 7.83E+04 4.89 2.97 1 1 3.03
    End interval 9 4 000 202 -7.7 0.025 0 -1.37 121.0 1.48E+05 5.17 3.14 1 1 3.18
    End interval 10 3 600 150 -7.7 0.025 0 -0.19 111.0 1.48E+05 5.17 3.14 1 1 3.18
    End interval 11 3 600 0 0.0 0.025 0 0.00 111.0 1.48E+05 5.17 3.14 1 1 3.18
    Formation name Depth to base FM (m) Age of formation top (Ma) Present-day depth profile of each formation top modeled One-dimensional thermal maturity of present-day formation sequence What is calculated by one-dimensional EasyRo model
    FM1 Eroded Eroded Eroded Eroded Eroded Eroded Eroded Eroded Eroded
    FM2 Eroded Eroded Eroded Eroded Eroded Eroded Eroded Eroded Eroded
    FM3 Eroded Eroded Eroded Eroded Eroded Eroded Eroded Eroded Eroded
    FM4 0 317 (part eroded) 21.0 Eroded Eroded Eroded Eroded Eroded Eroded
    FM5 750 345 39.8 1.94E-03 -2.71 0.61 0.001 94 0 0.64
    FM6 1 150 365 49.8 4.94E-02 -1.31 0.77 0.048 18 0.000 5 0.76
    FM7 1 800 390 66.0 5.38E+00 0.73 1.12 0.995 40 0.052 4 1.13
    FM8 2 650 415 87.3 1.04E+03 3.02 1.93 1 1 1.92
    FM9 2 700 435 88.5 1.38E+03 3.14 1.99 1 1 1.98
    FM10 2 950 440 94.8 5.46E+03 3.74 2.29 1 1 2.29
    FM11 3 600 500 111.0 1.48E+05 5.17 3.14 1 1 3.18
     | Show Table
    DownLoad: CSV
    Table  6.  Multi-dimension thermal maturation model summary for Example 6 burial history comparing calculated Ro for ArrTTI and EasyRo methods
    Multi-dimensional burial and thermal history generated from inputing the deepest formation as a burial history Arrhenius equation time-temperature index (TTI) single activation energy model: E=218 kj/mol (52.1 kcal/mol); A=5.45E26 Ma-1 EasyRo model 20-variably-weighted activation energies
    Burial interval Depth to formation tops (m) Time/age (Ma) Burial rate dz/dt (m/Ma) Temperature gradient (ºC/m) Heating rate dT/dt (ºC/Ma) Temperature (ºC) Thermal maturity index modelled ∑TTIARR Thermal maturity index modelled log10 ∑TTI Model calculated vitrinite reflectance (Ro Calc) Fraction of kerogen converted to liquid petroleum Fraction of kerogen converted to gaseous petroleum EasyRo calculated vitrinite reflectance (Ro "Easy")
    Multiple burial intervals modeled Time (b.p.) Burial and thermal history of deepest horizon (Top FM14) Example 6 Oil window Gas window Example 6
    Surface interval 0 350 Deposition of FM14 begins 21.0 Deposited Deposited Deposited Deposited Deposited Deposited
    End interval 1 1 000 195 6.5 0.025 0 0.16 46.0 2.67E-08 -7.57 0.32 0 0 0.35
    End interval 2 1 000 120 0.0 0.025 0 0.00 46.0 1.12E-07 -6.95 0.35 0 0 0.35
    End interval 3 1 500 115 100.0 0.025 0 7.00 81.0 2.65E-06 -5.58 0.42 0 0 0.42
    End interval 4 2 100 112 200.0 0.040 0 8.00 105.0 2.78E-04 -3.56 0.54 0.000 3 0 0.55
    End interval 5 2 500 110 200.0 0.040 0 8.00 121.0 5.03E-03 -2.30 0.65 0.005 0 0 0.66
    End interval 6 3 100 107 200.0 0.040 0 8.00 145.0 2.57E-01 -0.59 0.87 0.226 9 0.002 6 0.84
    End interval 7 3 500 105 200.0 0.040 0 8.00 161.0 2.79E+00 0.45 1.04 0.938 8 0.027 6 1.06
    End interval 8 4 100 102 200.0 0.040 0 8.00 185.0 7.35E+01 1.87 1.47 1 0.520 4 1.48
    End interval 9 4 500 100 200.0 0.040 0 8.00 201.0 5.42E+02 2.73 1.81 1 0.995 6 1.84
    End interval 10 3 700 98 -400.0 0.030 0 -34.50 132.0 6.68E+02 2.82 1.85 1 0.998 7 1.88
    End interval 11 2 500 95 -400.0 0.025 0 -16.17 83.5 6.68E+02 2.82 1.85 1 0.998 7 1.88
    End interval 12 2 800 40 5.5 0.020 0 -0.12 77.0 6.68E+02 2.82 1.85 1 0.998 7 1.88
    End interval 13 2 800 25 0.0 0.020 0 0.00 77.0 6.68E+02 2.82 1.85 1 0.998 7 1.88
    End interval 14 3 000 0 8.0 0.020 0 0.16 81.0 6.68E+02 2.82 1.85 1 0.998 7 1.88
    Multi-dimensional burial and thermal history generated from inputing the deepest formation as a burial history Arrhenius equation time-temperature index (TTI) single activation energy model: E=218 kj/mol (52.1 kcal/mol); A=5.45E26 Ma-1 EasyRo model 20-variably-weighted activation energies
    Formation name Depth to base FM (m) Age of formation top (Ma) Present-day depth profile of each formation top modeled One-dimensional thermal maturity of present-day formation sequence What is calculated by one-dimensional EasyRo model
    FM1 200 25 25.0 5.10E-11 -10.29 0.20 0 0 0.27
    FM2 200 40 25.0 6.68E-11 -10.18 0.21 0 0 0.28
    FM3 500 95 31.0 5.50E-10 -9.26 0.25 0 0 0.30
    FM4 Eroded Eroded Eroded Eroded Eroded Eroded Eroded Eroded Eroded
    FM5 Eroded Eroded Eroded Eroded Eroded Eroded Eroded Eroded Eroded
    FM6 Eroded Eroded Eroded Eroded Eroded Eroded Eroded Eroded Eroded
    FM7 Eroded Eroded Eroded Eroded Eroded Eroded Eroded Eroded Eroded
    FM8 Eroded Eroded Eroded Eroded Eroded Eroded Eroded Eroded Eroded
    FM9 500 110 31.0 1.77E-04 -3.75 0.53 0.000 2 0 0.53
    FM10 900 112 39.0 3.32E-03 -2.48 0.64 0.003 3 0 0.65
    FM11 1 500 115 51.0 1.79E-01 -0.75 0.84 0.163 6 0.001 8 0.82
    FM12 2 000 120 61.0 3.55E+00 0.55 1.06 0.971 3 0.034 9 1.09
    FM13 2 000 195 61.0 3.55E+00 0.55 1.06 0.971 3 0.034 9 1.09
    FM14 3 000 350 81.0 6.68E+02 2.82 1.85 1 0.998 7 1.88
     | Show Table
    DownLoad: CSV
    Table  7.  Multi-dimension thermal maturation model summary for Example 7 burial history comparing calculated Ro for ArrTTI and EasyRo methods
    Multi-dimensional burial and thermal history generated from inputing the deepest formation as a burial history Arrhenius equation time-temperature index (TTI) single activation energy model: E=218 kj/mol (52.1 kcal/mol); A=5.45E26 Ma-1 EasyRo model 20-variably-weighted activation energies
    Burial interval Depth to formation tops (m) Time/age (Ma) Burial rate dz/dt (m/Ma) Temperature gradient (ºC/m) Heating rate dT/dt (ºC/Ma) Temperature (ºC) Thermal maturity index modelled ∑TTIARR Thermal maturity index modelled log10 ∑TTI Model calculated vitrinite reflectance (Ro Calc) Fraction of kerogen converted to liquid petroleum Fraction of kerogen converted to gaseous petroleum EasyRo calculated vitrinite reflectance (Ro "Easy")
    Multiple burial intervals modeled Time (b.p.) Burial and thermal history of deepest horizon (Top FM12) Example 7 Oil window Gas window Example 7
    Surface interval 0 225 Deposition of FM12 begins 15.0 Deposited Deposited Deposited Deposited Deposited Deposited
    End interval 1 1 000 200 40.0 0.035 0 1.40 50.0 8.72E-09 -8.06 0.30 0 0 0.32
    End interval 2 900 190 -10.0 0.035 0 -0.35 46.5 2.96E-08 -7.53 0.33 0 0 0.34
    End interval 3 1 700 185 160.0 0.035 0 5.60 74.5 7.95E-07 -6.10 0.39 0 0 0.39
    End interval 4 2 000 170 20.0 0.035 0 0.70 85.0 5.40E-05 -4.27 0.49 0.000 1 0 0.51
    End interval 5 3 000 160 100.0 0.035 0 3.50 120.0 9.70E-03 -2.01 0.68 0.009 7 0.000 1 0.69
    End interval 6 5 300 150 230.0 0.035 0 8.05 200.5 5.07E+02 2.71 1.80 1 0.993 7 1.83
    End interval 7 5 400 145 20.0 0.035 0 0.70 204.0 3.56E+03 3.55 2.19 1 1 2.24
    End interval 8 5 200 140 -40.0 0.035 0 -1.40 197.0 6.10E+03 3.79 2.32 1 1 2.34
    End interval 9 6 200 100 25.0 0.027 0 -0.37 182.4 1.22E+04 4.09 2.49 1 1 2.48
    End interval 10 5 900 80 -15.0 0.025 0 -1.00 162.5 1.26E+04 4.10 2.50 1 1 2.48
    End interval 11 5 500 10 -5.7 0.023 0 -0.30 141.5 1.27E+04 4.10 2.50 1 1 2.48
    End interval 12 5 000 0 -50.0 0.021 0 -2.15 120.0 1.27E+04 4.10 2.50 1 1 2.48
    Formation name Depth to base FM (m) Age of formation top (Ma) Present-day depth profile of each formation top modeled One-dimensional thermal maturity of present-day formation sequence What is calculated by one-dimensional EasyRo model
    FM1 0 0 Eroded Eroded Eroded Eroded Eroded Eroded Eroded Eroded
    FM2 -500 10 Eroded Eroded Eroded Eroded Eroded Eroded Eroded Eroded
    FM3 -900 80 Eroded Eroded Eroded Eroded Eroded Eroded Eroded Eroded
    FM4 -1 200 100 Eroded Eroded Eroded Eroded Eroded Eroded Eroded Eroded
    FM5 -200 140 Eroded Eroded Eroded Eroded Eroded Eroded Eroded Eroded
    FM6 -400 145 Eroded Eroded Eroded Eroded Eroded Eroded Eroded Eroded
    FM7 -300 150 57.0 6.77E-03 -2.17 0.67 0.006 74 0.000 07 0.68
    FM8 2 000 160 78.0 1.48E+00 0.17 0.99 0.772 60 0.014 70 0.99
    FM9 3 000 170 84.3 6.69E+00 0.83 1.15 0.998 75 0.064 68 1.15
    FM10 3 300 185 101.1 2.87E+02 2.46 1.69 1 0.943 52 1.68
    FM11 4 100 190 99.0 1.83E+02 2.26 1.62 1 0.840 12 1.59
    FM12 4 000 200 120.0 1.27E+04 4.10 2.50 1 1 2.48
     | Show Table
    DownLoad: CSV
    Table  8.  Multi-dimension thermal maturation model summary for Example 8 burial history comparing calculated Ro for ArrTTI and EasyRo methods
    Multi-dimensional burial and thermal history generated from inputing the deepest formation as a burial history Arrhenius equation time-temperature index (TTI) single activation energy model: E=218 kj/mol (52.1 kcal/mol); A=5.45E26 Ma-1 EasyRo model 20-variably-weighted activation energies
    Burial interval Depth to formation tops (m) Time/age (Ma) Burial rate dz/dt (m/Ma) Temperature gradient (ºC/m) Heating rate dT/dt (ºC/Ma) Temperature (ºC) Thermal maturity index modelled ∑TTIARR Thermal maturity index modelled log10 ∑TTI Model calculated vitrinite reflectance (Ro Calc) Fraction of kerogen converted to liquid petroleum Fraction of kerogen converted to gaseous petroleum EasyRo calculated vitrinite reflectance (Ro "Easy")
    Multiple burial intervals modeled Time (b.p.) Burial and thermal history of deepest horizon (Top FM11) Example 8 Oil window Gas window Example 8
    Surface interval 0 165.0 Deposition of FM11 begins 21.0 Deposited Deposited Deposited Deposited Deposited Deposited
    End interval 1 300 155.0 30.0 0.050 0 1.50 36.0 1.87E-10 -9.73 0.23 0 0 0.28
    End interval 2 1 100 140.0 53.3 0.050 0 2.67 76.0 2.25E-06 -5.65 0.41 0.000 002 0 0.42
    End interval 3 2 900 135.0 360.0 0.055 0 20.90 180.5 1.56E+01 1.19 1.26 1 0.144 8 1.27
    End interval 4 1 500 130.0 -280.0 0.055 0 -15.40 103.5 3.69E+01 1.57 1.38 1 0.308 3 1.39
    End interval 5 2 800 125.0 260.0 0.055 0 14.30 175.0 4.78E+01 1.68 1.41 1 0.380 2 1.42
    End interval 6 3 100 120.0 60.0 0.055 0 3.30 191.5 4.08E+02 2.61 1.76 1 0.983 1 1.78
    End interval 7 3 700 110.0 60.0 0.050 0 1.45 206.0 4.92E+03 3.69 2.27 1 1 2.30
    End interval 8 3 750 100.0 5.0 0.050 0 0.25 208.5 1.57E+04 4.20 2.55 1 1 2.57
    End interval 9 3 800 80.0 2.5 0.045 0 -0.83 192.0 2.68E+04 4.43 2.69 1 1 2.69
    End interval 10 4 400 75.0 120.0 0.040 0 1.00 197.0 2.80E+04 4.45 2.70 1 1 2.69
    End interval 11 4 400 0.0 0.0 0.035 0 -0.29 175.0 3.66E+04 4.56 2.77 1 1 2.74
    Formation name Depth to base FM (m) Age of formation top (Ma) Present-day depth profile of each formation top modeled One-dimensional thermal maturity of present-day formation sequence What is calculated by one-dimensional EasyRo model
    FM1 0.00 75.0 21.00 7.91E-11 -10.10 0.21 0 0 0.24
    FM2 600 80.0 42.00 4.63E-08 -7.33 0.33 0 0 0.35
    FM3 650 100.0 43.75 7.58E-08 -7.12 0.34 0 0 0.36
    FM4 700 110.0 45.50 1.23E-07 -6.91 0.35 0 0 0.37
    FM5 1 300 120.0 66.50 2.84E-05 -4.55 0.48 0.000 03 0 0.50
    FM6 1 600 125.0 77.00 3.36E-04 -3.47 0.55 0.000 34 0 0.58
    FM7 2 900 130.0 122.50 4.07E+00 0.61 1.09 0.982 88 0.039 9 1.10
    FM8 1 500 135.0 Eroded 73.50 Eroded Eroded Eroded Eroded Eroded Eroded
    FM9 3 300 140.0 136.50 5.46E+01 1.74 1.43 1 0.420 8 1.41
    FM10 4 100 155.0 164.50 6.85E+03 3.84 2.35 1 1 2.31
    FM11 4 400 165.0 175.00 3.66E+04 4.56 2.77 1 1 2.74
     | Show Table
    DownLoad: CSV
    Table  9.  Multi-dimension thermal maturation model summary for Example 9 burial history comparing calculated Ro for ArrTTI and EasyRo methods
    Multi-dimensional burial and thermal history generated from inputing the deepest formation as a burial history Arrhenius equation time-temperature index (TTI) single activation energy model: E=218 kj/mol (52.1 kcal/mol); A=5.45E26 Ma-1 EasyRo model 20-variably-weighted activation energies
    Burial interval Depth to formation tops (m) Time/age (Ma) Burial rate dz/dt (m/Ma) Temperature gradient (ºC/m) Heating rate dT/dt (ºC/Ma) Temperature (ºC) Thermal maturity index modelled ∑TTIARR Thermal maturity index modelled log10 ∑TTI Model calculated vitrinite reflectance (Ro Calc) Fraction of kerogen converted to liquid petroleum Fraction of kerogen converted to gaseous petroleum EasyRo calculated vitrinite reflectance (Ro "Easy")
    Multiple burial intervals modeled Time (b.p.) Burial and thermal history of deepest horizon (Top FM19) Example 9 Oil window Gas window Example 9
    Surface interval 0 150 Deposition of FM19 begins 21.0 Deposited Deposited Deposited Deposited Deposited Deposited
    End interval 1 3 601 145 720.2 0.035 25.21 147.0 1.12E-01 -0.95 0.81 0.105 7 0.001 1 0.79
    End interval 2 3 601 125 0.0 0.045 1.80 183.0 2.52E+02 2.40 1.67 1 0.919 5 1.68
    End interval 3 5 348 103 79.4 0.045 3.57 261.7 8.15E+05 5.91 3.60 1 1 3.74
    End interval 4 5 548 100 66.7 0.030 -24.74 187.4 9.32E+05 5.97 3.64 1 1 3.76
    End interval 5 5 348 97 -66.7 0.025 -10.91 154.7 9.32E+05 5.97 3.64 1 1 3.76
    End interval 6 6 098 91 125.0 0.025 3.13 173.5 9.33E+05 5.97 3.64 1 1 3.76
    End interval 7 7 115 70 48.4 0.042 6.97 319.8 6.37E+07 7.80 4.43 1 1 4.64
    End interval 8 7 315 67 66.7 0.042 2.80 328.2 2.05E+08 8.31 4.69 1 1 4.69
    End interval 9 7 115 65 -100.0 0.035 -29.10 270.0 2.34E+08 8.37 4.69 1 1 4.69
    End interval 10 7 388 60 54.6 0.025 -12.87 205.7 2.34E+08 8.37 4.69 1 1 4.69
    End interval 11 8 643 55 251.0 0.040 32.20 366.7 6.36E+08 8.80 4.69 1 1 4.69
    End interval 12 9 198 36 29.2 0.040 1.17 388.9 3.64E+10 10.56 4.69 1 1 4.69
    End interval 13 9 398 35 200.0 0.040 8.00 396.9 4.08E+10 10.61 4.69 1 1 4.69
    End interval 14 9 198 34 -200.0 0.038 -26.40 370.5 4.36E+10 10.64 4.69 1 1 4.69
    End interval 15 9 438 22 20.0 0.034 -2.39 341.9 4.96E+10 10.70 4.69 1 1 4.69
    End interval 16 9 998 18 140.0 0.034 4.76 360.9 5.10E+10 10.71 4.69 1 1 4.69
    End interval 17 10 298 16 150.0 0.034 5.10 371.1 5.26E+10 10.72 4.69 1 1 4.69
    End interval 18 9 998 11 -60.0 0.034 -2.04 360.9 5.69E+10 10.75 4.69 1 1 4.69
    End interval 19 10 398 0 36.4 0.034 1.24 374.5 6.74E+10 10.83 4.69 1 1 4.69
    Multi-dimensional burial and thermal history generated from inputing the deepest formation as a burial history Arrhenius equation time-temperature index (TTI) single activation energy model: E=218 kj/mol (52.1 kcal/mol); A=5.45E26 Ma-1 EasyRo model 20-variably-weighted activation energies
    Formation name Depth to base FM (m) Age of formation top (Ma) Present-day depth profile of each formation top modeled One-dimensional thermal maturity of present-day formation sequence What is calculated by one-dimensional EasyRo model
    FM1 400 11 34.6 1.52E-10 -9.82 0.22 0 0 0.28
    FM2 100 16 Eroded section (-300 m) 24.4 Eroded Eroded Eroded Eroded Eroded 0.26
    FM3 400 18 34.6 1.99E-10 -9.70 0.23 0 0 0.29
    FM4 960 22 53.6 3.27E-08 -7.49 0.33 0 0 0.35
    FM5 1 200 34 61.8 2.44E-07 -6.61 0.37 0 0 0.37
    FM6 1 000 35 Eroded section (-200 m) 55.0 4.61E-08 -7.34 0.33 0 0 0.35
    FM7 1 200 36 61.8 2.44E-07 -6.61 0.37 0 0 0.37
    FM8 1 755 55 80.7 1.78E-05 -4.75 0.46 0 0 0.47
    FM9 3 010 60 123.3 6.55E-02 -1.18 0.78 0.063 4 0 0.77
    FM10 3 283 65 132.6 3.12E-01 -0.51 0.88 0.268 1 0 0.86
    FM11 3 083 67 Eroded section (-200 m) 125.8 1.00E-01 -1.00 0.81 0.095 3 0.001 0 0.79
    FM12 3 283 70 132.6 3.12E-01 -0.51 0.88 0.268 1 0.003 1 0.86
    FM13 4 300 91 167.2 6.04E+01 1.78 1.45 1 0.453 4 1.43
    FM14 5 050 97 192.7 1.86E+03 3.27 2.05 1 1 2.06
    FM15 4 850 100 Eroded section (-200 m) 185.9 7.71E+02 2.89 1.87 1 1 1.87
    FM16 5 050 103 192.7 1.86E+03 3.27 2.05 1 1 2.06
    FM17 6 797 125 252.1 1.81E+06 6.26 3.80 1 1 3.85
    FM18 6 797 145 252.1 1.81E+06 6.26 3.80 1 1 3.85
    FM19 10 398 150 374.5 6.74E+10 10.83 4.69 1 1 4.69
     | Show Table
    DownLoad: CSV
    Table  10.  Multi-dimension thermal maturation model summary for Example 10 burial history comparing calculated Ro for ArrTTI and EasyRo methods
    Multi-dimensional burial and thermal history generated from inputing the deepest formation as a burial history Arrhenius equation time-temperature index (TTI) single activation energy model: E=218 kj/mol (52.1 kcal/mol); A=5.45E26 Ma-1 EasyRo model 20-variably-weighted activation energies
    Burial interval Depth to formation tops (m) Time/age (Ma) Burial rate dz/dt (m/Ma) Temperature gradient (ºC/m) Heating rate dT/dt (ºC/Ma) Temperature (ºC) Thermal maturity index modelled ∑TTIARR Thermal maturity index modelled log10 ∑TTI Model calculated vitrinite reflectance (Ro Calc) Fraction of kerogen converted to liquid petroleum Fraction of kerogen converted to gaseous petroleum EasyRo calculated vitrinite reflectance (Ro "Easy")
    Multiple burial intervals modeled Time (b.p.) Burial and thermal history of deepest horizon (Top FM19) Example 10 Oil window Gas window Example 10
    Surface interval 0 159.25 Deposition of FM19 begins 21.0 Deposited Deposited Deposited Deposited Deposited Deposited
    End interval 1 306 150.50 35.0 0.030 1.05 30.2 4.79E-11 -10.32 0.20 0 0 0.27
    End interval 2 811 147.50 168.3 0.030 5.05 45.3 7.52E-10 -9.12 0.26 0 0 0.30
    End interval 3 1 222 144.25 126.5 0.030 3.79 57.7 2.19E-08 -7.66 0.32 0 0 0.33
    End interval 4 1 939 138.25 119.5 0.030 3.59 79.2 3.34E-06 -5.48 0.42 0 0 0.42
    End interval 5 2 902 121.25 56.6 0.030 1.70 108.1 2.31E-03 -2.64 0.62 0.002 31 0 0.64
    End interval 6 3 125 118.50 81.1 0.030 2.43 114.8 6.18E-03 -2.21 0.66 0.006 16 0.000 1 0.67
    End interval 7 3 289 116.50 82.0 0.030 2.46 119.7 1.37E-02 -1.86 0.70 0.013 64 0.000 1 0.70
    End interval 8 3 535 112.25 57.9 0.030 1.74 127.1 6.06E-02 -1.22 0.78 0.058 84 0.000 6 0.76
    End interval 9 4 087 106.50 96.0 0.030 2.88 143.6 5.97E-01 -0.22 0.92 0.449 75 0.006 0 0.90
    End interval 10 4 245 99.50 22.6 0.030 0.68 148.4 3.23E+00 0.51 1.05 0.960 47 0.031 8 1.08
    End interval 11 4 345 94.75 21.1 0.030 0.63 151.4 6.36E+00 0.80 1.14 0.998 27 0.061 6 1.15
    End interval 12 4 245 92.25 -40.0 0.030 -1.20 148.4 8.01E+00 0.90 1.17 0.999 67 0.076 9 1.17
    End interval 13 4 410 88.25 41.3 0.030 1.24 153.3 1.11E+01 1.04 1.22 0.999 98 0.104 9 1.21
    End interval 14 4 891 67.25 22.9 0.030 0.69 167.7 8.48E+01 1.93 1.50 1 0.571 8 1.48
    End interval 15 5 103 61.05 34.2 0.030 1.03 174.1 1.64E+02 2.21 1.60 1 0.805 4 1.58
    End interval 16 5 561 48.25 35.8 0.030 1.07 187.8 8.22E+02 2.91 1.89 1 0.999 7 1.88
    End interval 17 5 631 44.50 18.7 0.030 0.56 189.9 1.28E+03 3.11 1.98 1 1 1.98
    End interval 18 5 843 40.00 47.1 0.030 1.41 196.3 2.23E+03 3.35 2.09 1 1 2.11
    End interval 19 5 899 0.00 1.4 0.030 0.04 198.0 1.55E+04 4.19 2.55 1 1 2.53
    Multi-dimensional burial and thermal history generated from inputing the deepest formation as a burial history Arrhenius equation time-temperature index (TTI) single activation energy model: E=218 kj/mol (52.1 kcal/mol); A=5.45E26 Ma-1 EasyRo model 20-variably-weighted activation energies
    Formation name Depth to base FM (m) Age of formation top (Ma) Present-day depth profile of each formation top modeled One-dimensional thermal maturity of present-day formation sequence What is calculated by one-dimensional EasyRo model
    FM1 56 40.00 22.7 5.49E-11 -10.26 0.20 0 0 0.28
    FM2 268 44.50 29.0 3.72E-10 -9.43 0.24 0 0 0.30
    FM3 338 48.25 31.1 6.85E-10 -9.16 0.25 0 0 0.30
    FM4 796 61.05 44.9 2.92E-08 -7.53 0.33 0 0 0.35
    FM5 1 008 67.25 51.2 1.49E-07 -6.83 0.36 0 0 0.37
    FM6 1 489 88.25 65.7 4.77E-06 -5.32 0.43 0 0 0.44
    FM7 1 654 92.25 70.6 1.46E-05 -4.83 0.46 0 0 0.47
    FM8 1 554 94.75 Eroded section (-100 m) 67.6 7.44E-06 -5.13 0.44 0 0 0.45
    FM9 1 654 99.50 70.6 1.46E-05 -4.83 0.46 0 0 0.47
    FM10 1 812 106.50 75.4 4.16E-05 -4.38 0.49 0 0 0.50
    FM11 2 364 112.25 91.9 1.29E-03 -2.89 0.60 0.001 3 0 0.63
    FM12 2 610 116.50 99.3 5.43E-03 -2.27 0.66 0.005 4 0.000 1 0.67
    FM13 2 774 118.50 104.2 1.37E-02 -1.86 0.70 0.013 6 0.000 1 0.71
    FM14 2 997 121.25 110.9 4.63E-02 -1.33 0.76 0.045 3 0.000 5 0.75
    FM15 3 960 138.25 139.8 5.71E+00 0.76 1.13 0.996 7 0.055 5 1.14
    FM16 4 677 144.25 161.3 1.36E+02 2.13 1.57 1 0.743 2 1.54
    FM17 5 088 147.50 173.6 7.30E+02 2.86 1.86 1 0.999 3 1.84
    FM18 5 593 150.50 188.8 5.09E+03 3.71 2.28 1 1 2.26
    FM19 5 899 159.25 198.0 1.55E+04 4.19 2.55 1 1 2.53
     | Show Table
    DownLoad: CSV
    Table  11.  Multi-dimension thermal maturation model summary for Example 11 burial history comparing calculated Ro for ArrTTI and EasyRo methods
    Multi-dimensional burial and thermal history generated from inputing the deepest formation as a burial history Arrhenius equation time-temperature index (TTI) single activation energy model E=218 kj/mol (52.1 kcal/mol); A=5.45E26 Ma-1 EasyRo model 20-variably-weighted activation energies
    Burial interval Depth to formation tops (m) Time/age (Ma) Burial rate dz/dt (m/Ma) Temperature gradient (ºC/m) Heating rate dT/dt (ºC/Ma) Temperature (ºC) Thermal maturity index modelled ∑TTIARR Thermal maturity index modelled log10 ∑TTI Model calculated vitrinite reflectance (Ro Calc) Fraction of kerogen converted to liquid petroleum Fraction of kerogen converted to gaseous petroleum EasyRo calculated vitrinite reflectance (Ro "Easy")
    Multiple burial intervals modeled Time (b.p.) Burial and thermal history of deepest horizon (Top FM19) Example 11 Oil window Gas window Example 11
    Surface interval 0 159.25 Deposition of FM19 begins 21.0 Deposited Deposited Deposited Deposited Deposited Deposited
    End interval 1 695 150.50 79.4 0.040 3.18 48.8 2.82E-09 -8.55 0.28 0 0 0.31
    End interval 2 695 147.25 0.0 0.040 0.00 48.8 1.04E-08 -7.98 0.31 0 0 0.31
    End interval 3 745 144.25 16.7 0.040 0.67 50.8 1.94E-08 -7.71 0.32 0 0 0.33
    End interval 4 1 190 138.25 74.2 0.040 2.97 68.6 3.95E-07 -6.40 0.38 0 0 0.38
    End interval 5 1 937 121.25 43.9 0.040 1.76 98.5 3.62E-04 -3.44 0.55 0.000 36 0 0.57
    End interval 6 2 146 118.50 76.0 0.040 3.04 106.8 1.19E-03 -2.93 0.60 0.001 18 0 0.62
    End interval 7 2 274 116.50 64.0 0.040 2.56 112.0 3.11E-03 -2.51 0.63 0.003 11 0 0.65
    End interval 8 2 403 113.25 39.7 0.040 1.59 117.1 1.09E-02 -1.96 0.69 0.010 80 0.000 1 0.69
    End interval 9 2 455 112.25 52.0 0.040 2.08 119.2 1.52E-02 -1.82 0.71 0.015 08 0.000 2 0.71
    End interval 10 2 684 108.25 57.3 0.040 2.29 128.4 6.41E-02 -1.19 0.78 0.062 06 0.000 6 0.76
    End interval 11 2 929 106.25 122.5 0.040 4.90 138.2 1.79E-01 -0.75 0.84 0.163 54 0.001 8 0.82
    End interval 12 3 034 99.50 15.6 0.040 0.62 142.4 1.24E+00 0.09 0.98 0.711 61 0.012 4 0.97
    End interval 13 3 284 94.75 52.6 0.040 2.11 152.4 3.59E+00 0.55 1.06 0.972 37 0.035 3 1.09
    End interval 14 3 034 88.25 -38.5 0.040 -1.54 142.4 6.80E+00 0.83 1.15 0.998 88 0.065 7 1.16
    End interval 15 3 319 81.25 40.7 0.040 1.63 153.8 1.07E+01 1.03 1.21 0.999 98 0.101 7 1.20
    End interval 16 3 528 67.25 14.9 0.040 0.60 162.1 4.17E+01 1.62 1.39 1 0.340 8 1.38
    End interval 17 3 785 61.50 44.6 0.040 1.78 172.4 8.86E+01 1.95 1.50 1 0.587 8 1.49
    End interval 18 3 785 40.00 0.0 0.040 0.00 172.4 4.12E+02 2.61 1.76 1 0.983 7 1.75
    End interval 19 3 805 0.00 0.5 0.040 0.02 173.2 1.05E+03 3.02 1.93 1 1 1.90
    Multi-dimensional burial and thermal history generated from inputing the deepest formation as a burial history Arrhenius equation time-temperature index (TTI) single activation energy model: E=218 kj/mol (52.1 kcal/mol); A=5.45E26 Ma-1 EasyRo model 20-variably-weighted activation energies
    Formation name Depth to base FM (m) Age of formation top (Ma) Present-day depth profile of each formation top modeled One-dimensional thermal maturity of present-day formation sequence What is calculated by one-dimensional EasyRo model
    FM1 20 40.00 21.8 4.77E-11 -10.32 0.20 0 0 0.34
    FM2 21 61.50 Some erosion? 21.8 7.07E-11 -10.15 0.21 0 0 0.28
    FM3 277 67.25 32.1 1.46E-09 -8.84 0.27 0 0 0.31
    FM4 486 81.25 40.4 1.46E-08 -7.84 0.31 0 0 0.34
    FM5 771 88.25 51.8 2.78E-07 -6.56 0.37 0 0 0.39
    FM6 521 94.75 Eroded section (-250 m) 41.8 2.12E-08 -7.67 0.32 0 0 0.34
    FM7 771 99.50 51.8 2.78E-07 -6.56 0.37 0 0 0.39
    FM8 876 106.25 56.0 7.81E-07 -6.11 0.39 0 0 0.41
    FM9 1 121 108.25 65.8 7.89E-06 -5.10 0.44 0 0 0.46
    FM10 1 350 112.25 75.0 6.10E-05 -4.21 0.50 0 0 0.51
    FM11 1 402 113.25 77.1 9.56E-05 -4.02 0.51 0.000 1 0 0.53
    FM12 1 531 116.50 82.2 2.85E-04 -3.55 0.54 0.000 3 0 0.57
    FM13 1 659 118.50 87.4 8.16E-04 -3.09 0.58 0.000 8 0 0.61
    FM14 1 868 121.25 95.7 4.28E-03 -2.37 0.65 0.004 3 0 0.66
    FM15 2 615 138.25 125.6 9.05E-01 -0.04 0.95 0.595 4 0.009 0 0.94
    FM16 3 060 144.25 143.4 1.53E+01 1.18 1.26 1 0.141 6 1.24
    FM17 3 110 147.25 Some erosion? 145.4 2.07E+01 1.32 1.30 1 0.186 6 1.28
    FM18 3 110 150.50 145.4 2.07E+01 1.32 1.30 1 0.186 6 1.28
    FM19 3 805 159.25 173.2 1.05E+03 3.02 1.93 1 1 1.90
     | Show Table
    DownLoad: CSV

    The burial histories modeled are as following.

    Example 1 (Table 1): a delta/wrench fault/pull-apart basin.

    Example 2 (Table 2): a passive ocean margin (initial rift with high heat flow followed by burial associated with declining heat flow).

    Example 3 (Table 3): a wrench-fault basin at a subduction zone with rapid burial at low geothermal gradients.

    Example 4 (Table 4): a foreland or over-thrust basin; slow initial burial at low heating rates followed by more rapid burial at higher heating rates and late-stage erosion.

    Example 5 (Table 5): an intra-cratonic basin; slow burial and low heating rates extending over hundreds of millions of years.

    Example 6 (Table 6): a complex basin with burial and heating rates varying from low to high to low with periods of late stage erosion (e.g., pop-up structures at continental margins).

    Example 7 (Table 7): a deep basin originating as a passive margin and latterly by over thrusting and erosion; analogous to the 200-Ma old, over-pressured Yuanba Basin, Sichuan, China (Yang et al., 2016).

    Example 8: a rifted basin impacted by volcanic activity and significant uplift and erosion as it evolved; analogous to the 165-Ma old Songliao Basin in Northeast China (containing the giant Daqing Field) (Luo et al., 2017).

    Example 9 (Table 9): a deep intra-cratonic rift basin impacted by variable heat-flow and periods of erosion; analogous to the 150-Ma old Melut Basin of Southern Sudan (Mohamed et al., 2016).

    Example 10 (Table 10): a basin involving significant but slowing subsidence over long periods; analogous to the 150-Ma old North Louisiana Salt Basin containing the prospective, Upper Jurassic, Haynesville Shale (Nunn, 2012).

    Example 11 (Table 11): a basin involving significant but slowing subsidence, higher heat flow and episodes of uplift; analogous to the 150-Ma old Sabine uplift adjacent to the North Louisiana Salt Basin, also involving Haynesville Shale (Nunn, 2012).

    Figures 1 to 3 summarize the depth, temperature and thermal maturation histories calculated for the deepest horizon modeled for all-eleven burial histories. These include 155 modeled sub-surface points modeled for those specific horizons. What stands out from these graphs is the smooth non-linear, but high-positive correlation between log10 ∑TTIARR and "EasyRo" Ro values in Fig. 1. This graph on its own refutes the claim of Sweeney and Burnham (1990) that "a single [first-order Arrhenius] reaction does not adequately model complex reactions over a wide range of temperatures and heating rates". As expected, for such a diverse set of burial and temperature histories evaluated in examples 1 to 11, Ro versus temperature (Fig. 2) and temperature versus depth (Fig. 3) show significant dispersion. If log10 ∑TTIARR was not well correlated with thermal maturity it also would show significant dispersion versus calculated vitrinite reflectance; it clearly does not.

    Figure  2.  Calculated vitrinite reflectance (Ro) ("EasyRo" method) versus prevailing sub-surface calculated temperature for the 155 data points derived from eleven-varied burial-history cases modeled (including six cases from Wood, 1988), representative of the multiple dimensions of petroleum producing basins. The scatter highlights that Ro is dependent on several factors in addition to prevailing temperature (e.g., historical temperatures, time, burial history, erosion).
    Figure  3.  Prevailing sub-surface calculated temperature versus depth for the 155 data points derived from eleven-varied burial-history cases modeled (including six cases from Wood, 1988), representative of the multiple dimensions of petroleum producing basins. The scatter highlights the range of geothermal gradients encountered in typical petroleum-producing basins and the diverse conditions tested by the modeled cases use to correlate the ∑TTIARR thermal maturity index with the "EasyRo" method.

    Having established that a single Arrhenius Equation can accurately model the thermal maturation of vitrinite (Type-Ⅲ kerogen) on geologic time scales, the next question to address is what are the appropriate activation energies (E) and pre-exponential factors (A) that could be used to achieve this? Wood (1988) selected the values of E=218 kj/mol (52.1 kcal/mol); A=5.45E+26 Ma-1 (loge A=61.56).

    To arrive at those values, Wood (1988) compiled detailed analysis of the published reaction kinetics for kerogens, bitumens and petroleum-related organic chemical reactions available at that time. Figure 4 redisplays Fig. 1 of Wood (1988) identifying the information used to reveal a positive correlation between E and loge A, together with two more-recent data points for the average kinetic parameters established for the Kimmeridge (K) and Monterey (M) shales (Peters et al., 2015). Points K and M fall on the original trend identified by Wood (1988) supporting its validity. The dashed line in Fig. 4 is significant as it establishes a line with a specific gradient associating a range of E and A values with a range of kerogen types; in particular, the Phosphoria Retort shale and Woodford shales (Lewan et al., 1985) and that the weighted averages of the Type Ⅰ, Type Ⅱ and Type Ⅲ kerogens defined by Tissot and Espitalié (1975) lay close to that line. It is gratifying that the more recently determined Kimmeridge clay and Monterey shale distributions plot track the Wood-1988 line and gradient. Ungerer (1990, Fig. 8 there in) subsequently identified a similar (E versus loge A trend) for a range of published kerogens analysed by Rock-Eval, as did Nielsen and Dahl (1991).

    Figure  4.  Arrhenius Equation reaction kinetics expressed as activation energies (E) versus pre-exponential (frequency) factors for kerogens and petroleum geochemical markers based on data published pre-1988 and used by Wood (1988) to originally focus the ∑TTIARR method.

    Multi-sample kinetic analysis of the Bakken shale (North Dakota) indicated a good linear relationship between activation energy and the natural log of the frequency (Nordeng, 2013; Fig. 4 therein), which straddle the E-A values selected by Wood (1988). That analysis leads to the conclusion that the frequency factor is not constant nor is it independent of the activation energy, and that the dispersion in E-A values was partly due to intraformational differences in the kerogen, and partly due to different thermal maturity levels of the samples.

    Wood (1988) used the positive correlation between E and loge A to model seven A-E values to test their suitability for calculating TTIARR (from E=100 kj/mol, loge A=40.12 Ma-1; to, E=300 kj/mol, loge A=76.46 Ma-1). Based on that analysis, Wood (1988) selected the values of E=218 kj/mol and loge A= 61.56 Ma-1 for the following clearly identified reasons.

    1. (Quote) the mean values for Type Ⅲ kerogen; the Montana lignite (70%) vitrinite and the Woodford Shale kerogen (amorphous Type Ⅱ) plot in a close cluster (unquote).

    2. Most thermal maturity indices are correlated with vitrinite reflectance (Type Ⅲ kerogen).

    3. The transformation factor (Eq. (10), this study) progresses from 0 to 0.9 (Wood, 1988, used Eq. (9), or 1–TFt, of this study to illustrate this, right scale of Fig. 5 in that study) over a vitrinite reflectance range of approximately 0.5% to 1.0%; the maturity levels generally accepted to represent a significant portion of the oil window.

    These justifications stand today, and the author has successfully applied this model for the past thirty years using those E and A values for general thermal maturity calculations, sometimes with adjustments to them for calculating transformation factors of specific shales. Workable ∑TTIARR thermal maturity indices could be established with other values of E and A along the trend defined in Fig. 4. However, higher E-A values would slow down the reaction and the transformation factor would progress from 0 to 1 at a higher Ro interval (i.e., implying significant oil generation commences at > > 0.5% Ro, which may be appropriate for some Type Ⅰ and Type Ⅱ kerogens, but not Type Ⅲ kerogens). On the other hand, lower E-A values would speed up the reaction and the and the transformation factor would progress from 0 to 1 at a lower Ro interval (i.e., implying significant oil generation commences at < < 0.5% Ro), which may be appropriate for some kerogens/shales rich in sulphur and other metals that act as catalysts for petroleum generation reactions, e.g., Lewan et al., 1985, Lewan and Ruble, 2002).

    Also significant is that many published pyrolysis testsuse a constant A value over a range of E values to characterize kerogen kinetics. The trend identified in Fig. 4, confirmed by the subsequent analysis of Ungerer (1990) and Nielsen and Dahl (1991), suggest that this is not a true reflection of the reactions involved in kerogen transformation to petroleum. Indeed, the more recently published kerogen kinetics for the Kimmeridge clay (K) and Monterey Shale (M) (Peters et al., 2015) confirm that the significant dispersions displayed by 48 samples from each shale (Fig. 5) follow closely the trend established in Fig. 4, extending over a range of activation energies from ~200 to 250 kJ/mol. Figure 6 reveals that the mean values of the E-A distributions for K and Mare quite distinct, with M representing the faster-reacting kerogen, situated either side of the Woodford shale. In modeling the transformation factors for specific shales/kerogens the relationships displayed in Figs. 4 to 6 suggest that distinctive A and E values should be used. The "EasyRo" method advocates a constant A value measured on a per second scale.

    Figure  5.  Arrhenius Equation reaction kinetics expressed as activation energies versus pre-exponential (frequency) factors used for petroleum generation models Wood (1988) to focus the ∑TTIARR method following a defined linear trend. Recently published pyrolysis data for two well-studied shales are superimposed on that trend, for comparison, suggesting that the kinetic parameter values identified in 1988 are appropriate for at least some types of kerogen. Note that 659 oK is equivalent to 386 ℃.
    Figure  6.  Expanded area of interest from Fig. 4. Note that the 48 samples from the Kimmeridge clay (K) and the 48 sample from the Monterey shale (M) (Peters et al., 2015) plot in distinct areas with clearly separated means. It is considered significant that those two shales are distributed close to and parallel to the trend of kinetic parameters established by Wood (1988) using published data available at that time (i.e., the same A versus E gradients). The kinetic parameters on which ∑TTIARR is based (E=218 kJ/mol (52.1 kcal/mol); A=5.45E+26 Ma-1) also lies between the means, K and M, on that trend. The "EasyRo" E-A distribution used for the "EasyRo" thermal maturation model of Sweeney and Burnham (1990) does not follow the trend of known kerogen kinetics, but crosses it at a high angle close to the value used by the ∑TTIARR method.

    The approach proposed by Wood (1988), and which I support in this reappraisal, is to use a single A-E value (relating to Type Ⅲ kerogen) to establish thermal maturity (∑TTIARR index) in all basins, and to link it to vitrinite reflectance and/or other thermal maturity metrics that can be tested by direct measurements. However, for detailed analysis of specific kerogens or kerogen mixtures and to calibrate petroleum transformation ratios that ∑TTIARR scale should be adjusted. How such adjustments can be made, easily and transparently, is discussed below.

    Figure 7 shows the log10 ∑TTIARR calibration to vitrinite reflectance (Ro) applied in this study for the selected E and A values (E=218 kj/mol; loge A= 61.56 Ma-1). It is separated into two segments each applying a quartic polynomial relationship. The less-thermally-mature component covers the maturity range 0.2%≤Ro < 1.1% extending across most of the oil window (Eq. (11)).

    Figure  7.  The revised correlations between Ro and log10 ∑TTIARR for the oil window (a) and gas window (b) ensure that the preferred ∑TTIARR index yields the same Ro values as the correlation proposed for "EasyRo" (Sweeney and Burnham, 1990). Cut-offs (Ro min of 0.2%; Ro max of 4.7%; max of log10 ∑TTIARR of 2E+8.3) are applied so that beyond the low end of the correlation Ro of 0.2% is applied and beyond the high end of the correlation Ro of 4.7% is applied. This new correlation replaces the one used by Wood (1988) based on data for just three wells, which worked well for the oil window, but not for the gas window.
    y=3E05x4+0.003x3+0.0198x2+0.1726x+0.9612 (11)

    where y=Ro%, x=log10 ∑TTIARR. If Eq. (11) calculates y of < 0.2 then Ro is set equal to 0.2. The more thermally mature segment covers the maturity range 1.1% < ≤Ro≤4.7% extending across the gas window (Eq. (12); using the same symbols as Eq. (11)).

    y=0.0019x4+0.023x30.0483x2+0.3318x+0.8975 (12)

    If Eq. (12) calculates y of > 4.7 or x is > 8.3 then Ro is set equal to 4.7. The upper and lower Ro limits are imposed to force the Ro calibration to be restricted to the same range as the "EasyRo" method and its empirical Ro calibration. The results of this calibration clearly match those calculated by the "EasyRo" method typically within plus or minus 2% error (Tables 1 to 11). The author makes no claims that this calibration is correct or the most accurate one, only that it satisfactorily reproduces the EasyRo calculated values for all burial scenarios tested within reasonable error margins. This relationship between log10 ∑TTIARR and Ro can only be an approximation of the thermal maturation of vitrinite so improvements to this relationship should be expected as more detailed understanding of the complex parallel reactions involved in the catagenesis of vitrinite is revealed.

    This calibration is a clear improvement on the log10 ∑TTIARR to Ro calibration provided by Wood (1988) for thermal maturities beyond the oil window. That calibration was based on empirical data available (e.g., 5 wells offshore West Africa) and published data available at that time from Waples (1982), involving 402 samples from 31 modeled burial histories worldwide. It worked reasonably well over the oil window (Ro from ~0.5% to ~1.1%) with results similar to Eq. (11), but was poorly defined at high thermal maturities. Nevertheless, it was fit-for-purpose as almost all exploration activity in the 1980's and early 1990's was focused on oil, not gas. The rapid expansion of the LNG industry since the mid-1990s and the emergence of unconventional gas plays since the late 1990s has changed that focus and demanded more careful evaluation and thermal maturity breakdown across of the gas-generation windows for shales and coals, and to higher upper thresholds of thermal maturity. Equation 11 provides much better thermal maturity evaluations for the gas window with the log10 ∑TTIARR scale covering almost four orders of magnitude from Ro 1.1% to 2.0% (Fig. 7) compared to almost sic orders of magnitude for the oil window.

    Figure 8 illustrates that other E values applied with the Arrhenius Equation could be used to provide valid correlations between log10 ∑TTIARR and Ro for thermal maturity modeling, but as already mentioned, the transformation factors (as calculated by Eqs. (9) and (10)) and the location of the calculated oil-and gas-generation windows would be shifted in relation to the Ro intervals typically assigned to them.

    Figure  8.  Revised relationships between Ro and log10 ∑TTIARR for a range of activation energies from 52.1 to 60 kcal/mol (with constant A=5.45E+26 Ma-1); a range that encompasses most types Ⅰ, Ⅱ and Ⅲ kerogens encountered in sedimentary basins (see Figs. 4 and 6). Any of these activation energies could be used to establish a tenable correlation with Ro to perform credible thermal maturity modeling. However, there are good reasons why Wood (1988) selected 52.1 kcal/mol (218 kJ/mol) for this purpose (see text), particularly because transformation factors correlate with the oil window (Ro= ~0.5% to ~1.1% for many types Ⅱ and Ⅲ kerogens).

    Although the calculation of the ∑TTIARR index and the E and A values used for that scale remain the same as those proposed by Wood (1988), three key changes are introduced to the model to make it more flexible for use in basin modeling and easier and quicker to calculate.

    (1) The updated log10 ∑TTIARR to Ro calibration made in the late 1990s, discussed in previous section (change introduced in 1990s).

    (2) Calculations using spreadsheets (from 1989) and VBA macros (change introduced 1999) to expand the number of sensitivity analysis cases to be run (e.g., higher and lower E-A values along the trend defined in Figs. 4 to 6).

    (3) Calculating two distinct transformation factors (0 to 1) (change introduced in 1999); one for the oil window (which could itself involved one or more E-A pairs reflecting mixtures of oil-prone kerogens) and one for the gas window. This approach facilitates more meaningful wet gas and dry gas zone identification and distinction for modeling purposes.

    Change (3) requires further clarification. For the selected E-A values (E=218 kj/mol; loge A=61.56 Ma-1) used to define the ∑TTIARR thermal maturation index the transformation ratio meaningfully covers the oil window (Ro 0.5% to 1.1%). The lower curve in Fig. 9 illustrates that TFt progress from 0 to 1 across the oil window. However, if this is the only TF calculated it tells us nothing about the gas generation window and when that gas generation occurs. The reactions involved in the generation gas are more complex than for oil, as they not only involve first-order reactions associated with kerogen maturation, but also a wide range of second and higher order reactions involving the cracking of bitumens, oils and other higher-carbon number hydrocarbon molecules into NGL and methane. In addition, a series of intermediate reforming reactions and catalytic influences on those reactions caused by variations in trace element components and water compositions, present in specific shales on a basin-wide scale, also likely to be involved.

    Figure  9.  Oil and gas window transformation factors (TF) relative to the vitrinite reflectance scale of thermal maturity for ∑TTIARR calculated with a single activation energy (E=218 kj/mol or 52.1 kcal/mol) and pre-exponential factor (A=5.45E+26 Ma-1). To calculate the gas TF the ∑TTIARR index is reduced two orders of magnitude (g=100 in Eq. (13)). Note this adjustment results in the gas transformation occurring primarily between Ro of 1% and 1.8% (versus the oil TF for the unaltered ∑TTIARR scale occurring between Ro of 0.6% and 1.1%.

    Empirical observations tell us that some thermogenic gas is generated from kerogen along with oil in the oil window, and that gas generation from kerogen continues to Ro values of 2% or higher. This suggests that some significant first-order reactions involved in gas generation from shales (and coals) have higher activation energies than the reactions controlling vitrinite reflectance (probably in the range E=230 to 290 kj/mol or 55 to 70 kcal/mol). Kinetic studies of coals of various rank (Zhang et al., 2008; Sykes and Snowdon, 2002) also indicate that gas generation from coal extends over a significant range of thermal maturities (Ro < 1.0% to Ro > 2.0%). For coals of the Piceance Basin (Colorado), Zhang et al. (2008) identified that significant methane generation commenced at about Ro=1.2% and peaked at about Ro=1.93% with the wettest (C2-to-C5-rich) gas produced in the thermal maturity range Ro 1.4% to 1.5%. This suggests that some first-order reactions with activation energies in the range 250 to 300 kj/mol are also involved in gas generation from coal, with a somewhat higher mean than for shales.

    To derive a flexible and transparent transformation factor for gas that reflects these empirical observations the defined ∑TTIARR thermal maturity index clearly requires some amendment and/or expansion. There are several ways in which this can be achieved.

    1. Calculate another gas-generation focused ∑TTIARR index using a higher single pair of E-A values than used to model vitrinite reflectance.

    2. Calculate another gas-generation focused ∑TTIARR index using the mean of a distribution of several higher E-A values. This introduces the additional challenge of how to weight the various values in that distribution. Applying simple Gaussian or uniform distributions is subjective and difficult to justify from empirical observation or laboratory measurements.

    3. Apply an empirical reduction to the ∑TTIARR thermal maturity index (E=218 kj/mol; loge A=61.56 Ma-1) using an adjustment factor (g) that shifts the transformation factor (TFt) calculated by Eqs. (9) and (10) to cover a thermal maturity range Ro 0.8% to 2.0%

    All three of these methods are only going to provide approximations because of the complex range of first-order and higher-order reactions involved, and variable catalytic effects of trace components present in the shales. In the case of method 1, applying activation energies of 234 to 243 kj/mol (56 to 58 kcal/mol) shift the ∑TTIARR index into the appropriate range of Ro values (Fig. 8). As a rule of thumb increasing the activation energy by 2 kcal/mol in the range 50 to 60 kcal/mol results in the ∑TTIARR index value approximately decreasing by about one order of magnitude. This means that a method 3 approach of reducing the ∑TTIARR thermal maturity index (E=218 kj/mol; loge A=61.56 Ma-1) by two orders of magnitude has a similar effect to calculating a new ∑TTIARR index using the E value of 56. For exploration basin analysis, it is this empirical approach (method 3) that is the easiest to apply; simply modifying Eq. (9) to become Eq. (13) to calculate a generic gas transformation factor shown in Fig. 9.

    Xt(gas)=eTTIARR/g (13)

    where ∑TTIARR is calculated with the same single E-A pair (E=218 kj/mol; loge A=61.56 Ma-1) as for vitrinite reflectance modeling, but the scale is adjusted downwards, dividing by the gas adjustment factor, g the value of g used typically varies from 10 to 100 000, depending upon the gas-prone kerogen or macerals involved.

    Notice in Fig. 9 that the calculated oil and gas transformation zones overlap, with gas transformation commencing at Ro ~0.8% and oil transformation completing at Ro ~1.1%. the relative positioning of the two transformation zones can be tuned by varying the exponent denominator in Eq. (13).

    For coal basins, depending on the type of coal, the right side of Eq. (13) could be replaced by e-∑TTIARR/10000or e-∑TTIARR/100000to shift gas generation to calibrate with substantially higher levels of thermal maturity. On the other hand, for gas generation associated as a secondary product from oil-prone kerogen, applying a value of g=10 in Eq. (13), i.e., e-∑TTIARR/10, shifts transformation into the thermal maturity range of approximately 0.6% < Ro < 1.5%, with the bulk of transformation occurring in the range 0.95% < Ro < 1.35%. This could shift the focus to the generation of wet gas rich in C2 to C5 molecules commonly associated with those ranges of thermal maturity. In such a model, the generation of further natural gas at thermal maturities Ro > 1.5% would be primarily associated with cracking of the hydrocarbon molecules already produced at maturities Ro≤1.5%.

    A method 2 approach could use three activation energies (e.g., 54, 58 and 62 kcal/mol for shale; 56, 60 and 64 kcal/mol for coal) and calculate a new ∑TTIARR index calibrated to derive the gas window transformation ratio. In cases where detailed kinetic data are available, a method 2 approach can attempt to fine tune the calibration of gas generation to the thermal maturity index, and broaden the thermal maturity range of the gas transformation factor progressing from zero to one. However, in practice it is quite difficult to obtain reliable kinetic data from samples of shales of various maturities to justify which three or more E-A pairs should be used. This is because it is not possible in bulk-source rock pyrolysis experiments to distinguish gas generated through first-order kerogen transformation factors from gas produced because of secondary cracking reactions acting upon C2+ hydrocarbons already formed by first-order reactions.

    In exploration scenarios where either the type of kerogen is unknown, or where significant kerogen heterogeneity exists in a specific shale it is appropriate to perform sensitivity analysis for both oil and gas transformation factors based on higher and lower E-A values than those used for the ∑TTIARR thermal maturity index. Such sensitivity analysis is easy to achieve using the ∑TTIARR methodology.

    Both the ∑TTIARR (Wood, 1988) and the "EasyRo" (Sweeeney and Burnham, 1990) methods successfully calculate thermal maturities from burial histories producing very similar results when calibrated to Ro. However, the methodologies are quite distinct, and the "EasyRo" method involves twenty-times the number of computations than the ∑TTIARR method, and produces a transformation ratio that is less transparent and more cumbersome to adjust and calibrate. Clearly, there is more than one first-order reaction (and many higher-order reactions and catalytic impacts from non-hydrocarbon elements) involved in petroleum generation from kerogen, but calculating reactions for twenty values of E between 34 to 72 kcal/mol (with a single A value), variously weighted, does not necessarily lead to more precise results (as has been shown here for vitrinite reflectance maturation, Fig. 1). The EasyRo method is in fact analogous to a "shotgun" approach, shooting many "pellets" over a wide area leading to a high chance that at least some will pass close to the target. Indeed, the calculations for many of the twenty E values generated by the "EasyRo" method provide information that makes no contribution to kerogen transformations to petroleum in the oil and gas windows. This makes the "EasyRo" method computationally inefficient and generates transformation factors for petroleum that are misleading.

    Figure 10 illustrates this point by displaying all twenty "EasyRo" E-value transformation calculations for the burial history of the deepest formation in Example 11 (Table 11). A value of zero ("0") in an activation energy column (Fig. 10) identifies that transformation has yet to commence, whereas a value of one ("1") identifies that transformation for that reaction has completed. The numbers between 0 and 1 (highlighted in Fig. 10) for each activation energy identify the thermal maturity range over which transformation is taking place. What is clear from Fig. 10 is that it is only eight of the twenty first-order reactions modeled by "EasyRo" that are actually contributing significantly to transformation in the oil and gas windows of thermal maturity (i.e., E=46 to 60 kcal/mol), and that the E value used by ∑TTIARR sits close to the centre of that range. From a petroleum-transformation-factor perspective, the "EasyRo" method could be calibrated to produce similar outcomes by using just eight rather than twenty E values, making the method less "easy" to calculate than it could be.

    Figure  10.  The numbers between 0 and 1 highlighted represent actual transformation occurring for specific E values linked to specific, depth, temperature and time windows. Less than half of the 20 activation energies, associated with a constant frequency factor (A=1E+13 s-1) used to calculate thermal maturity in the "EasyRo" method involve transformation between Ro of ~0.6% and ~1.8% when the central point (and highest-weighted) activation energy is 52 to 54 kcal/mol. Those activation energies below 48 kcal/mol have completed transformation before Ro reaches ~0.5% and those above 62 kcal/mol have not started transformation when Ro reaches 1.8%. Hence, they are not contributing to progressing vitrinite reflectance in the oil window and a major part of the gas window.

    Another serious limitation to "EasyRo" is that it uses a single A value for all of the E values involved. This is because of the preference of some laboratory geochemists to promote pyrolysis methods using a ramp of E values keeping A constant. It is clear from Figs. 4 to 6, and has been clear since the 1980's, that this does not reflect the kerogen compositions that are observed in most organic-rich shales.

    A strong case can therefore be made to develop an "EasierRo" approach for calculating transformation factors, i.e., perhaps use just five to eight E-A values, with E ranging from 46 to 60 (unless modeling sulphur-rich shales or coals, when lower and higher values, respectively, would be appropriate); and, adjusting the weights applied to the transformation factors derived from those E-A values according to the pyrolysis analysis of specific shales. However, for most petroleum generation analysis, such an approach would lead to similar outcomes to the ∑TTIARR method, with sensitivity analysis, described here. The ∑TTIARR method described here can achieve that outcome with less computation and with more transparency. The ∑TTIARR method avoids the subjectivity associated with what weights to apply to the different E-A values included in the distribution, and the laboratory uncertainties and discrepancies associated with pyrolysis-derived kinetic parameters.

    Burial history and thermal maturity modeling for petroleum exploration and exploitation purposes typically strives to derive and map accurately the zones of petroleum generation (transformation) (oil, wet gas and dry gas) on a basin-wide scale. This requires multiple runs of a multi-dimensional burial history model linked to thermal maturation and petroleum transformation algorithms. The "EasyRo" method as presented by Sweeney and Burnham (1990) is a one-dimensional computation that requires significant modification and multiple additional calculation to consider multi-dimensional burial histories involving several burial periods displaying variable heating rates together with some phases of uplift (cooling), non-deposition and/or erosion. Computational efficiency, flexibility and transparency of the algorithms and integrals involved are important to construct meaningful and reproducible models. The ∑TTIARR method described here possesses all of these attributes.

    In conducting multi-dimensional basin analysis for petroleum prospecting it is best to divide the process into three steps.

    Step 1: Develop a robust burial history algorithm that can cope with periods of uplift and erosion and variable geothermal gradients and heat flow to produce a sub-surface model of temperature through time at multiple (e.g., m=15 to 20) horizons.

    Step 2: Conduct thermal maturation modeling on that burial history model ideally calibrating calculated thermal maturity indices to direct measurements of thermal maturity (i.e., Ro, geochemical markers, coal rank, etc.). The ∑TTIARR method achieves this reliably with one E-A pair of values with the Arrhenius Equation.

    Step 3: Conduct petroleum transformation analysis for each organic-rich shale and coal, separating out the oil, gas and in some gases, wet-gas transformation zones. For exploration, with limited detailed pyrolysis analysis of the kerogen type(s) present the same E-A pair of values used in step 2 can be provisionally applied. It also makes sense to conduct sensitivity analysis using higher and lower E-A values to consider basin-wide heterogeneities in a shale formations composition (i.e., various mixtures of more than one kerogen type; variations in formation water chemistry; variations in trace element contents likely to act as catalysts in kerogen and higher-order hydrocarbon reactions). For zones with kerogen of known kinetic composition the E-A values can be modified and a single, or average of three or so, E-A pairs of values can be used to generate a customized ∑TTIARR index applied to that zone for transformation purposes only.

    Figure 11 is the type of multi-dimensional output that might be generated at the completion of steps 1 and 2 and is constructed for Example 9 (Table 9). Such analyses summarize the thermal maturity evolution through time associated with burial at a specific location in a basin (e.g., well bore, seismic shot point or pseudo-well), and are widely used (e.g., Liao et al., 2017; Mohamed et al., 2016; Yang et al., 2016; Nunn, 2012; Shalaby et al., 2008; He and Middleton, 2002).

    Figure  11.  11. Multi-dimensional burial and thermal maturation history for Example 9 (Table 9) showing the oil and gas windows for the organic-rich shale formation.

    Ultimately, at the completion of step 3 it should be possible to develop displays such as Fig. 11 to include petroleum transformation zones for oil and gas, which are likely to overlap to a degree (Fig. 12). Methods applying algorithms to invert Rock-Eval Tmax data to yield E-A kinetic values for specific shales (Chen et al., 2017) have the potential to help to fine tune step 3 without conducting more detailed and expensive pyrolysis to achieve this.

    Figure  12.  Multi-dimensional burial history chart and thermal maturation history for Example 9 (Table 9) with oil and gas transformation factors for the organic-rich shale formation. Such analysis is straightforward to produce using the ∑TTIARR index.

    Once the analyst is satisfied that displays such as Figs. 11 and 12 realistically reflect basin conditions then the model can be expanded to multiple points (e.g., at least several hundred typically required) across the entire basin to provide maps displaying sufficient resolution. This should provide detailed maps of oil and gas transformations at various percentages (e.g., 0, 25%, 50%, 75% and 100%).

    One of the biggest challenges in being able to extrapolate thermal maturity modeling across an entire basin from a few calibrated well control points is the uncertainties surrounding geothermal gradients (determining heat flow and heating rates), and magnitudes of uplift and erosion that periodically occur, in space and over time. There have been successful attempts to invert thermal conductivities from seismic velocities to predict heat flow variations across a basin for use in thermal maturity modeling (e.g., Ho et al., 1998). Sometimes it is difficult to match predicted versus measured Ro at certain locations. Often this discrepancy is due to incorrect assumptions for historic geothermal gradients and/or the magnitude of erosion. Clearly it is important to resolve such discrepancies prior to expanding a model across an entire basin. Optimizers (those built in to Excel and customized algorithms) can be applied to the burial history input for calculating the ∑TTIARR index to select the interval geothermal gradients that minimize the mean squared error between measured and calculated Ro to help resolve such issues.

    A misconception has been perpetuated for many years that thermal maturation modeling of vitrinite reflectance (Ro) can only be achieved reliably using the Arrhenius Equation with multiple activation energies (E). This study has demonstrated through detailed comparison of the ∑TTIARR method (cumulative integration of the Arrhenius Equation using a single E-A pair of values, Wood, 1988) and "EasyRo" method (twenty-weighted E values, Sweeney and Burnham, 1990) applied to a wide variety of multi-dimensional burial histories, that the single-E approach can accurately calculate Ro, and match the Ro values calculated by the multiple-E approach. Indeed, there is an excellent positive correlation with little dispersion between log10 ∑TTIARR and "EasyRo" Ro calculated values (Fig. 1).

    The ∑TTIARR method, with aquartic polynomial calibration to Ro (updated from the calibration proposed by Wood, 1988) is shown to calculate thermal maturity in a more transparent and flexible way with less computational effort than the "EasyRo" method. The ∑TTIARR method also facilitates the calculation of petroleum transformation over time (TRt) using simple relationships between the ∑TTIARR index and TRt(oil) and TRt(gas) (Eqs. (9), (10) and (13)). The oil and gas transformation zones for shales can be flexibly positioned to cover specific Ro intervals, that overlap if required (e.g., Ro=0.5% to 1.1% for oil; Ro=0.8% to 1.8% for gas) using the ∑TTIARR index calculated with a single E-A pair of value. The extensive scale of the ∑TTIARR index (many orders of magnitude) is particularly useful for detailed maturity characterization of "sweet-spot" zones (e.g., ethane C-isotope rollovers and reversals) in unconventional shale and coal plays on a basin wide basis.

    The relationship between E and A used by Wood (1988) to evaluate and select appropriate E and A values for the ∑TTIARR index is reappraised and updated. This reappraisal (Figs. 4 to 6) verifies that the gradient established between E and loge A using data from the 1970s and 1980s is consistent with more up-to-date pyrolysis-derived kinetic data. It also confirms that the selection of E=218 kJ/mol (52.1 kcal/mol) and A=5.45E+26 Ma-1 (loge A=61.56), the original values proposed by Wood (1988), are appropriate for modeling the thermal maturation of vitrinite and many other Type Ⅲ and Type Ⅱ kerogens.

    The confirmation of the E versus loge A slope, and the wide dispersion of samples from specific shale formations along that slope suggests that the "EasyRo" method's use of a constant A value for twenty wide-ranging E-values (34 to 72 kcal/mol) does not realistically model the first-order reactions associated with specific shales. This may work for modeling vitrinite maturation, but does not provide a meaningful petroleum transformation calculation for most shales or kerogens. Moreover, of the twenty E values calculated by "EasyRo" only eight (A=46 to 60 kcal/mol) involve significant transformations in the oil and gas windows (Ro 0.5% to 1.8%). A case is made to simplify and revamp the "EasyRo" method using fewer (e.g., 3 to 8) E values with variable A values. As it stands the ∑TTIARR method provides a simpler and more realistic method for multi-dimensional burial, thermal and petroleum transformation modeling.

    ACKNOWLEGEMENT: The final publication is available at Springer via https://doi.org/10.1007/s12583-017-0735-7.
  • Abbott, G. D., Lewis, C. A., Maxwell, J. R., 1985. The Kinetics of Specific Organic Reactions in the Zone of Catagenesis. Philosophical Transactions of the Royal Society A: Mathematical, Physical and Engineering Sciences, 315(1531): 107-122. doi: 10.1098/rsta.1985.0032
    Arrhenius, S., 1889. Über Die Reaktionsgeschwindigkeit bei der Inversion von Rohrzucker Durch Säuren. Z. Phys. Chem., 4: 226-248 https://www.degruyter.com/view/j/zpch.1889.4.issue-1/zpch-1889-0416/zpch-1889-0416.xml
    Behar, F., Vandenbroucke, M., Tang, Y., et al., 1997. Thermal Cracking of Kerogen in Open and Closed Systems: Determination of Kinetic Parameters and Stoichiometric Coefficients for Oil and Gas Generation. Organic Geochemistry, 26(5/6): 321-339. doi: 10.1016/s0146-6380(97)00014-4
    Braun, R. L., Burnham, A. K., 1987. Analysis of Chemical Reaction Kinetics Using a Distribution of Activation Energies and Simpler Models. Energy & Fuels, 1(2): 153-161. doi: 10.1021/ef00002a003
    Burnham, A. K., Sweeney, J. J., 1989. A Chemical Kinetic Model of Vitrinite Maturation and Reflectance. Geochimica et Cosmochimica Acta, 53(10): 2649-2657. doi: 10.1016/0016-7037(89)90136-1
    Burnham, A. K., 1998. Comment on "Experiments on the Role of Water in Petroleum Formation" by M. D. Lewan. Geochimica et Cosmochimica Acta, 62: 2207-2210 doi: 10.1016/S0016-7037(98)00149-5
    Burnham, A. K., 2017. Global Chemical Kinetics of Fossil Fuels: How to Model Maturation and Pyrolysis. Springer, Amsterdam. 330
    Chen, Z. H., Liu, X. J., Guo, Q. L., et al., 2017. Inversion of Source Rock Hydrocarbon Generation Kinetics from Rock-Eval Data. Fuel, 194: 91-101. doi: 10.1016/j.fuel.2016.12.052
    Cornford, C. , 2009. Source Rocks and Hydrocarbons of the North Sea: Chapter 11. In: Glennie, K. W. , ed. , Petroleum Geology of the North Sea: Basic Concepts and Recent Advances: 4th Ed. Online ISBN: 9781444313413: 376-462. doi: 10.1002/9781444313413
    Dieckmann, V., 2005. Modelling Petroleum Formation from Heterogeneous Source Rocks: The Influence of Frequency Factors on Activation Energy Distribution and Geological Prediction. Marine and Petroleum Geology, 22(3): 375-390. doi: 10.1016/j.marpetgeo.2004.11.002
    Ducros, M. , 2016. Source Rock Kinetics: Goal and Perspectives. Conference Paper AAPG Geosciences Technology Workshop, "Source Rocks of the Middle East", January 25-26, 2016, Abu Dhabi, UAE https: //www. researchgate. net/publication/304785725_Source_Rock_Kinetics_Goal_and_Perspectives
    Eglinton, T. I., Sinninghe Damsté, J. S., Kohnen, M. E. L., et al., 1990. Rapid Estimation of the Organic Sulphur Content of Kerogens, Coals and Asphaltenes by Pyrolysis-Gas Chromatography. Fuel, 69(11): 1394-1404. doi: 10.1016/0016-2361(90)90121-6
    Espitalié, J. , 1986. Use of Tmax as a Maturation Index for Different Types of Organic Matter. In: Burris, J. , ed. , Comparison with Vitrinite Reflectance: 1st IFP Exploration Research Conference, Thermal modeling in Sedimentary Basins: Paris, June 3-7, 1985, Carcans, France. 475-496
    Espitalié, J., Ungerer, P., Irwin, I., et al., 1988. Primary Cracking of Kerogens. Experimenting and Modelling C1, C2-C5, C6-C15 and C15+ Classes of Hydrocarbons Formed. Organic Geochemistry, 13(4/5/6): 893-899. doi: 10.1016/0146-6380(88)90243-4
    Gorbachev, V. M., 1975. A Solution of the Exponential Integral in the Non-isothermal Kinetics for Linear Heating. Journal of Thermal Analysis, 8: 349350 doi: 10.1007/BF01904012
    Hackley, P. C., Araujo, C. V., Borrego, A. G., et al., 2015. Standardization of Reflectance Measurements in Dispersed Organic Matter: Results of an Exercise to Improve Inter Laboratory Agreement. Mar. Pet. Geol., 59: 22-34 doi: 10.1016/j.marpetgeo.2014.07.015
    Hackley, P. C., Cardott, B. J., 2016. Application of Organic Petrography in North American Shale Petroleum Systems: A Review. International Journal of Coal Geology, 163: 8-51. doi: 10.1016/j.coal.2016.06.010
    Hartkopf-Fröder, C., Königshof, P., Littke, R., et al., 2015. Optical Thermal Maturity Parameters and Organic Geochemical Alteration at Low Grade Diagenesis to Anchimetamorphism: A Review. International Journal of Coal Geology, 150/151: 74-119. doi: 10.1016/j.coal.2015.06.005
    He, S., Middleton, M., 2002. Heat Flow and Thermal Maturity Modelling in the Northern Carnarvon Basin, North West Shelf, Australia. Marine and Petroleum Geology, 19(9): 1073-1088. doi: 10.1016/s0264-8172(03)00003-5
    Ho, T. T. Y. , Jensen, R. P. , Sahai, S. K. , et al. , 1998. Comparative Studies of Pre-and Post-Drilling Modelled Thermal Conductivity and Maturity Data with Post-Drilling Results: Implications for Basin Modelling and Hydrocarbon Exploration. In: Duppenbecker, S. J. , Iliffe, J. E. , eds. , Basin Modelling: Practice and Progress. Geological Society, London, Special Publications, 141(1): 187-208. doi: 10.1144/gsl.sp.1998.141.01.12
    Hood, A., Gutjahr, C. C. M., Heacock, R. L., 1975. Organic Metamorphism and the Generation of Petroleum. AAPG Bulletin, 59: 986-996. doi: 10.1306/83d91f06-16c7-11d7-8645000102c1865d
    Huang, W.-L., 1996. Experimental Study of Vitrinite Maturation: Effects of Temperature, Time, Pressure, Water, and Hydrogen Index. Organic Geochemistry, 24(2): 233-241. doi: 10.1016/0146-6380(96)00032-0
    Jarvie, D. M., 1991. Factors Affecting Rock-Eval Derived Kinetic Parameters. Chemical Geology, 93(1/2): 79-99. doi: 10.1016/0009-2541(91)90065-y
    Jarvie, D. M. , Lundell, L. L. , 2001. Kerogen Type and Thermal Transformation of Organic Matter in the Miocene Monterey Formation. In: Isaacs, C. M. , Rullkötter, J. , eds. , The Monterey Formation: From Rocks to Molecules. Columbia University Press, New York. 269-295 https: //www. mendeley. com/research-papers/kerogen-type-thermal-transformation-organic-matter-miocene-monterey-formation/
    Jarvie, D. M., 2014. Components and Processes Affecting Producibility and Commerciality of Shale Resource Systems. Geologica Acta: Alago Special Publication, 12(4): 307-325 https://dialnet.unirioja.es/servlet/articulo?codigo=4922336
    Klomp, U. C., Wright, P. A., 1989. A New Method for the Measurement of Kinetic Parameters of Hydrocarbon Generation from Source Rocks. Organic Geochemistry, 16(1/2/3): 49-60. doi: 10.1016/0146-6380(90)90025-u
    Larter, S. R., 1988. Some Pragmatic Perspectives in Source Rock Geochemistry. Marine and Petroleum Geology, 5(3): 194-204. doi: 10.1016/0264-8172(88)90001-3
    Larter, S. R., 1989. Chemical Modelling of Vitrinite Reflectance Evolution. Geologische Rundschau, 78(1): 349-359. doi: 10.1007/bf01988369
    Lehne, E., Dieckmann, V., 2007. The Significance of Kinetic Parameters and Structural Markers in Source Rock Asphaltenes, Reservoir Asphaltenes and Related Source Rock Kerogens, the Duvernay Formation (WCSB). Fuel, 86(5/6): 887-901. doi: 10.1016/j.fuel.2006.07.015
    Lerche, I., Yarzab, R. E., Kendall, G. G., et al., 1984. Determination of Paleoheat Flux from Vitrinite Reflectance Data: Discussion. AAPG Bulletin, 69: 1704-1717. doi: 10.1306/94885606-1704-11d7-8645000102c1865d
    Lewan, M. D., Spiro, B., Illich, H., et al., 1985. Evaluation of Petroleum Generation by Hydrous Pyrolysis Experimentation. Philosophical Transactions of the Royal Society A: Mathematical, Physical and Engineering Sciences, 315(1531): 123-134. doi: 10.1098/rsta.1985.0033
    Lewan, M. D., 1997. Experiments on the Role of Water in Petroleum Formation. Geochimica et Cosmochimica Acta, 61(17): 3691-3723. doi: 10.1016/s0016-7037(97)00176-2
    Lewan, M. D., Ruble, T. E., 2002. Comparison of Petroleum Generation Kinetics by Isothermal Hydrous and Nonisothermal Open-System Pyrolysis. Organic Geochemistry, 33(12): 1457-1475. doi: 10.1016/s0146-6380(02)00182-1
    Liao, L. L., Wang, Y. P., Chen, C. S., et al., 2017. Kinetic Study of Marine and Lacustrine Shale Grains Using Rock-Eval Pyrolysis: Implications to Hydrocarbon Generation, Retention and Expulsion. Marine and Petroleum Geology. doi: 10.1016/j.marpetgeo.2017.01.009
    Lopatin, N. V., 1971. Temperature and Geologic Time as Factors in Coalification (in Russian). Akademiya Nauk SSSR Izvestiya, Seriya Geologicheskaya, 3: 95-106
    Luo, X., Gong, S., Sun, F. J., et al., 2017. Effect of Volcanic Activity on Hydrocarbon Generation: Examples in Songliao, Qinshui, and Bohai Bay Basins in China. Journal of Natural Gas Science and Engineering, 38: 218-234 doi: 10.1016/j.jngse.2016.12.022
    Ma, A. L., 2016. Kinetics of Oil-Cracking for Different Types of Marine Oils from Tahe Oilfield, Tarim Basin, NW China. Journal of Natural Gas Geoscience, 1(1): 35-43. doi: 10.1016/j.jnggs.2016.03.001
    Mackenzie, A. S., Beaumont, C., McKenzie, D. P., 1984. Estimation of the Kinetics of Geochemical Reactions with Geophysical Models of Sedimentary Basins and Applications. Organic Geochemistry, 6: 875-884. doi: 10.1016/0146-6380(84)90110-4
    Mackenzie, A. S., McKenzie, D. P., 1983. Isomerization and Aromatization of Hydrocarbons in Sedimentary Basins Formed by Extension. Geological Magazine, 120(5): 417. doi: 10.1017/s0016756800027461
    Marzi, R., Rullkötter, J., Perriman, W. S., 1990. Application of the Change of Sterane Isomer Ratios to the Reconstruction of Geothermal Histories: Implications of the Results of Hydrous Pyrolysis Experiments. Organic Geochemistry, 16(1/2/3): 91-102. doi: 10.1016/0146-6380(90)90029-y
    Mohamed, A. Y., Whiteman, A. J., Archer, S. G., et al., 2016. Thermal Modelling of the Melut Basin Sudan and South Sudan: Implications for Hydrocarbon Generation and Migration. Marine and Petroleum Geology, 77: 746-762. doi: 10.1016/j.marpetgeo.2016.07.007
    Nielsen, S. B., Barth, T., 1991a. Vitrinite Reflectance: Comments on "A Chemical Kinetic Model of Vitrinite Maturation and Reflectance" by Alan K. Burnham and Jerry J. Sweeney. Geochimica et Cosmochimica Acta, 55(2): 639-641. doi: 10.1016/0016-7037(91)90017-y
    Nielsen, S. B., Barth, T., 1991b. An Application of Least-Squares Inverse Analysis in Kinetic Interpretations of Hydrous Pyrolysis Experiments. Mathematical Geology, 23(4): 565-582. doi: 10.1007/bf02065807
    Nielsen, S. B., Dahl, B., 1991. Confidence Limits on Kinetic Models of Primary Cracking and Implications for the Modelling of Hydrocarbon Generation. Marine and Petroleum Geology, 8(4): 483-492. doi: 10.1016/0264-8172(91)90070-h
    Nordeng, S. H. , 2013. Evaluating Source Rock Maturity Using Multi-Sample Kinetic Parameters from the Bakken Formation (Miss. -Dev. ), Williston Basin, ND. In: Geological Investigation No. 164 North Dakota Geological Survey, Dakota. 19
    Nunn, J. A., Sleep, N. H., Moore, W. E., 1984. Thermal Subsidence and Generation of Hydrocarbons in Michigan Basin. AAPG Bulletin, 68: 296-315. doi: 10.1306/ad462c77-16f7-11d7-8645000102c1865d
    Nunn, J. A., 2012. Burial and Thermal History of the Haynesville Shale: Implications for Overpressure, Gas Generation, and Natural Hydro Fracture. Gulf Coast Association of Geological Societies (GCAGS) Journal, 1: 81-96 http://archives.datapages.com/data/gcags-journal/data/001/001001/pdfs/81.html
    Orr, W. L. , 1986. Kerogen/Asphaltene/Sulfur Relationships in Sulfur-Rich Monterey Oils. In: Leythaeuser, D. , Rullkotter, J. , eds. , Petroleum Geochemistry. Advances in Organic Geochemistry 1985, Part Ⅰ. Pergamon, London. 499-516 http: //www. sciencedirect. com/science/article/pii/0146638086900495?via%3Dihub
    Pepper, A. S., Corvi, P. J., 1995. Simple Kinetic Models of Petroleum Formation. Part Ⅰ: Oil and Gas Generation from Kerogen. Marine and Petroleum Geology, 12(3): 291-319. doi: 10.1016/0264-8172(95)98381-e
    Peters, K. E., 1986. Guidelines for Evaluating Petroleum Source Rock Using Programmed Pyrolysis. AAPG Bulletin, 70: 318-329. doi: 10.1306/94885688-1704-11d7-8645000102c1865d
    Peters, K. E., Burnham, A. K., Walters, C. C., 2015. Petroleum Generation Kinetics: Single versus Multiple Heating-Ramp Open-System Pyrolysis. AAPG Bulletin, 99(4):591-616. doi: 10.1306/11141414080
    Pigott, J. D., 1985. Assessing Source Rock Maturity in Frontier Basins: Importance of Time, Temperature, and Tectonics. AAPG Bulletin, 69: 1269-1274. doi: 10.1306/ad462bcd-16f7-11d7-8645000102c1865d
    Reynolds, J. G., Burnham, A. K., Mitchell, T. O., 1995. Kinetic Analysis of California Petroleum Source Rocks by Programmed Temperature Micropyrolysis. Organic Geochemistry, 23(2): 109-120. doi: 10.1016/0146-6380(94)00121-g
    Ritter, U., Myhr, M. B., Vinge, T., et al., 1995. Experimental Heating and Kinetic Models of Source Rocks: Comparison of Different Methods. Organic Geochemistry, 23(1): 1-9. doi: 10.1016/0146-6380(94)00108-d
    Royden, L., Keen, C. E., 1980. Rifting Process and Thermal Evolution of the Continental Margin of Eastern Canada Determined from Subsidence Curves. Earth and Planetary Science Letters, 51(2): 343-361. doi: 10.1016/0012-821x(80)90216-2
    Saxby, J. D., Bennett, A. J. R., Corcoran, J. F., et al., 1986. Petroleum Generation: Simulation over Six Years of Hydrocarbon Formation from Torbanite and Brown Coal in a Subsiding Basin. Organic Geochemistry, 9(2): 69-81. doi: 10.1016/0146-6380(86)90088-4
    Schaefer, R. G., Galushkin, Y. I., Kolloff, A., et al., 1999. Reaction Kinetics of Gas Generation in Selected Source Rocks of the West Siberian Basin: Implications for the Mass Balance of Early-Thermogenic Methane. Chemical Geology, 156(1/2/3/4): 41-65. doi: 10.1016/s0009-2541(98)00177-6
    Schenk, H. J., Di Primio, R., Horsfield, B., 1997. The Conversion of Oil into Gas in Petroleum Reservoirs. Part 1: Comparative Kinetic Investigation of Gas Generation from Crude Oils of Lacustrine, Marine and Fluviodeltaic Origin by Programmed-Temperature Closed-System Pyrolysis. Organic Geochemistry, 26(7/8): 467-481. doi: 10.1016/s0146-6380(97)00024-7
    Shalaby, M. R., Abdullah, W. H., Abu Shady, A. N., 2008. Burial History, Basin Modeling and Petroleum Source Potential in the Western Desert, Egypt. Bulletin of the Geological Society of Malaysia, 54: 103 -113 https://www.researchgate.net/publication/280623773_Burial_history_basin_modeling_and_petroleum_source_potential_in_the_Western_Desert_Egypt
    Snowdon, L. R., 1979. Errors in Extrapolation of Experimental Kinetic Parameters to Organic Geochemical Systems: Geologic Notes. AAPG Bulletin, 63: 1128-1138. doi: 10.1306/2f9184c8-16ce-11d7-8645000102c1865d
    Stainforth, J. G., 2009. Practical Kinetic Modeling of Petroleum Generation and Expulsion. Marine and Petroleum Geology, 26(4): 552-572. doi: 10.1016/j.marpetgeo.2009.01.006
    Suuberg, E. M., Peters, W. A., Howard, J. B., 1978. Product Composition and Kinetics of Lignite Pyrolysis. Industrial & Engineering Chemistry Process Design and Development, 17(1): 37-46. doi: 10.1021/i260065a008
    Sweeney, J. J., Burnham, A. K., 1990. Evaluation of a Simple Model of Vitrinite Reflectance Based on Chemical Kinetics (1). AAPG Bulletin, 74(10): 1559-1570. doi: 10.1306/0c9b251f-1710-11d7-8645000102c1865d
    Sykes, R., Snowdon, L. R., 2002. Guidelines for Assessing the Petroleum Potential of Coaly Source Rocks Using Rock-Eval Pyrolysis. Organic Geochemistry, 33(12): 1441-1455. doi: 10.1016/s0146-6380(02)00183-3
    Tegelaar, E. W., Noble, R. A., 1994. Kinetics of Hydrocarbon Generation as a Function of the Molecular Structure of Kerogen as Revealed by Pyrolysis-Gas Chromatography. Organic Geochemistry, 22(3/4/5): 543-574. doi: 10.1016/0146-6380(94)90125-2
    Tilley, B., Muehlenbachs, K., 2013. Isotope Reversals and Universal Stages and Trends of Gas Maturation in Sealed, Self-Contained Petroleum Systems. Chemical Geology, 339: 194-204. doi: 10.1016/j.chemgeo.2012.08.002
    Tissot, B. P., Espitalié, J., 1975. L'evolution Thermique de la Matière Organique des Sédiments: Applications D'une Simulation Mathématique. Potentiel Pétrolier des Bassins Sédimentaires de Reconstitution de L'histoire Thermique des Sédiments. Revue de l'Institut Français du Pétrole, 30(5): 743-778. doi: 10.2516/ogst:1975026
    Tissot, B. P., Welte, D. H., 1984. Petroleum Formation and Occurrence: Springer-Verlag, New York. 699
    Ungerer, P., Pelet, R., 1987. Extrapolation of the Kinetics of Oil and Gas Formation from Laboratory Experiments to Sedimentary Basins. Nature, 327(6117): 52-54. doi: 10.1038/327052a0
    Ungerer, P., Behar, F., Villalba, M., et al., 1988. Kinetic Modelling of Oil Cracking. Organic Geochemistry, 13(4/5/6): 857-868. doi: 10.1016/0146-6380(88)90238-0
    Ungerer, P. , 1990. State of the Art of Research in Kinetic Modelling of Oil Formation and Expulsion. In: Durand, B. , Behar, F. , eds. , Proceedings of the 14th International Meeting on Organic Geochemistry, Paris, France, September 18-22, 1989. Org. Geochem. , 16: 1-25 http: //www. sciencedirect. com/science/article/pii/014663809090022R
    Vandenbroucke, M., Behar, F., Rudkiewicz, J. L., 1999. Kinetic Modelling of Petroleum Formation and Cracking: Implications from the High Pressure/High Temperature Elgin Field (UK, North Sea). Organic Geochemistry, 30(9): 1105-1125. doi: 10.1016/s0146-6380(99)00089-3
    Waples, D. W., 1982. Time and Temperature in Petroleum Formation: Application of Lopatin's Method to Petroleum Exploration. AAPG Bulletin, 64: 916-926. doi: 10.1306/03b5a665-16d1-11d7-8645000102c1865d
    Waples, D. W. , Nowaczewski, V. S. , 2013. Source-Rock Kinetics. [2017-07-24]. https://siriusdummy.files.wordpress.com/2013/11/perspective-on-sr-kinetics-ss.pdf
    Waples, D. W., 2016. Petroleum Generation Kinetics: Single Versus Multiple Heating-Ramp Open-System Pyrolysis: Discussion. AAPG Bulletin, 100(4): 683-689. doi: 10.1306/01141615146
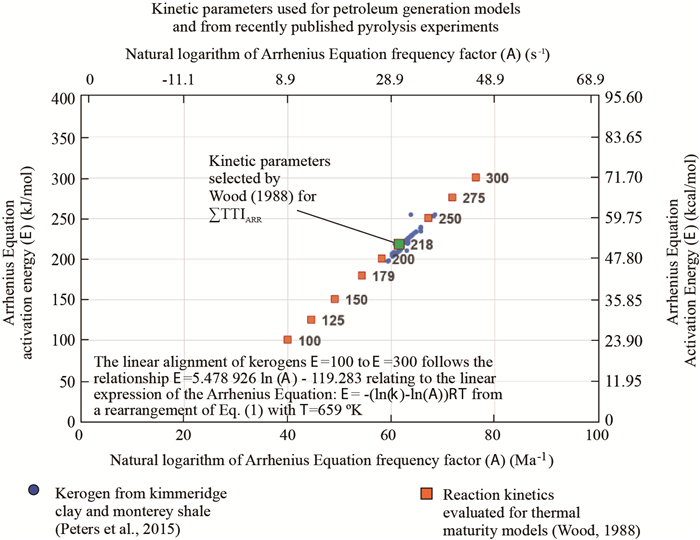
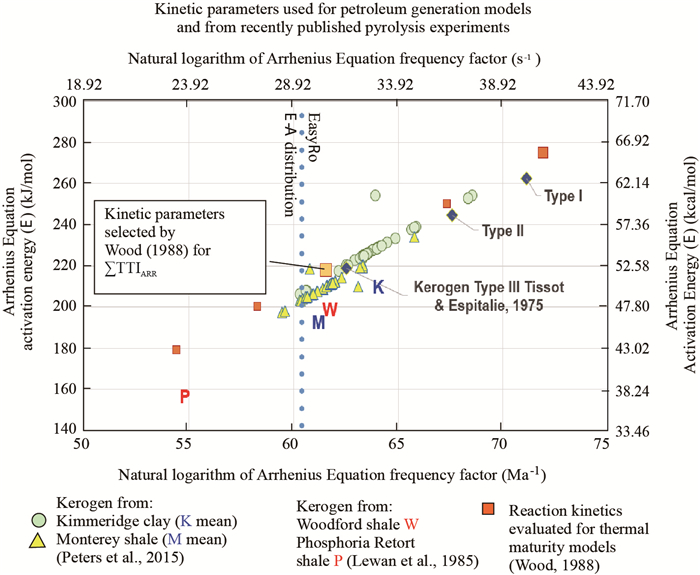
    Wood, D. A., 1988. Relationships between Thermal Maturity Indices Calculated Using Arrhenius Equation and Lopatin Method: Implications for Petroleum Exploration. AAPG Bulletin, 72: 115-135. doi: 10.1306/703c8263-1707-11d7-8645000102c1865d
    Wood, D. A. , 1990. Thermal Maturation Modeling Using Spreadsheets. Geobyte, (Feb): 56-61 https: //www. osti. gov/scitech/biblio/6976787
    Yang, R., He, S., Li, T. Y., et al., 2016. Origin of Over-Pressure in Clastic Rocks in Yuanba Area, Northeast Sichuan Basin, China. Journal of Natural Gas Science and Engineering, 30: 90-105. doi: 10.13039/501100004613
    Yang, R., He, S., Hu, Q. H., et al., 2017. Geochemical Characteristics and Origin of Natural Gas from Wufeng-Longmaxi Shales of the Fuling Gas Field, Sichuan Basin (China). International Journal of Coal Geology, 171: 1-11. doi: 10.13039/501100004613
    Zhang, E. T., Hill, R. J., Katz, B. J., et al., 2008. Modeling of Gas Generation from the Cameo Coal Zone in the Piceance Basin, Colorado. AAPG Bulletin, 92(8): 1077-1106. doi: 10.1306/04020806015
  • Relative Articles

    [1]Jie Zhao, Qinghai Guo. Geothermal energy extraction via EGS simulated using a thermal-hydraulic-mechanical coupling approach[J]. Journal of Earth Science. doi: 10.1007/s12583-025-0245-y
    [2]Meysam Hemmati, Yaser Ahmadi, Behzad Vaferi, Ali Hosin Alibak, David A. Wood. Surveying Organic Matter, Thermal Maturity Level, and Paleo-Environmental Conditions by Considering Biomarker and Stable Carbon Isotopic Analysis[J]. Journal of Earth Science, 2025, 36(2): 428-440. doi: 10.1007/s12583-024-1984-x
    [3]Yuheng Qiao, Linhao Cui, Guangyuan Xing, Dongjing Fu, Chao Chang, Robert Gaines, Xingliang Zhang. Thermal History of Cambrian Burgess Shale-Type Deposits: New Insights from the Early Cambrian Chengjiang and Qingjiang Fossils of South China[J]. Journal of Earth Science, 2024, 35(4): 1215-1223. doi: 10.1007/s12583-023-1921-2
    [4]David A. Wood. Kerogen Kinetic Distributions and Simulations Provide Insights into Petroleum Transformation Fraction (TF) Profiles of Organic-Rich Shales[J]. Journal of Earth Science, 2024, 35(3): 747-757. doi: 10.1007/s12583-024-1981-0
    [5]Ruxin Ding. Low Temperature Thermal History Reconstruction Based on Apatite Fission-Track Length Distribution and Apatite U-Th/He Age Using Low-T Thermo[J]. Journal of Earth Science, 2023, 34(3): 717-725. doi: 10.1007/s12583-020-1071-x
    [6]Wen Zhang, Shuangfeng Zhao, Jingbo Sun, Ze Shen, Wen Chen. Late Mesozoic Tectono-Thermal History in the South Margin of Great Xing'an Range, NE China: Insights from Zircon and Apatite (U-Th)/He Ages[J]. Journal of Earth Science, 2022, 33(1): 36-44. doi: 10.1007/s12583-021-1537-5
    [7]Bo Feng, Xinzhuan Guo. Thermal Conductivity and Thermal Diffusivity of Ferrosilite under High Temperature and High Pressure[J]. Journal of Earth Science, 2022, 33(3): 770-777. doi: 10.1007/s12583-021-1574-0
    [8]Sha Wang, Jinhua Zhang, Joseph R Smyth, Junfeng Zhang, Dan Liu, Xi Zhu, Xiang Wang, Yu Ye. Crystal Structure, Thermal Expansivity and High-Temperature Vibrational Spectra on Natural Hydrous Rutile[J]. Journal of Earth Science, 2020, 31(6): 1190-1199. doi: 10.1007/s12583-020-1351-5
    [9]Sherifa Cudjoe, Reza Barati. Lattice Boltzmann Simulation of CO2 Transport in Kerogen Nanopores-An Evaluation of CO2 Sequestration in Organic-Rich Shales[J]. Journal of Earth Science, 2017, 28(5): 926-932. doi: 10.1007/s12583-017-0802-0
    [10]David A. Wood, Bodhisatwa Hazra. Characterization of Organic-Rich Shales for Petroleum Exploration & Exploitation: A Review-Part 2: Geochemistry, Thermal Maturity, Isotopes and Biomarkers[J]. Journal of Earth Science, 2017, 28(5): 758-778. doi: 10.1007/s12583-017-0733-9
    [11]Yinhui Zuo, Nansheng Qiu, Jiawei Li, Qingqing Hao, Xiongqi Pang, Zhongying Zhao, Qi Zhu. Meso-cenozoic tectono-thermal evolution history in Bohai Bay Basin, North China[J]. Journal of Earth Science, 2015, 26(3): 352-360. doi: 10.1007/s12583-014-0500-0
    [12]Arata Miyauchi, Masanori Kameyama, Hiroki Ichikawa. Linear Stability Analysis on the Influences of the Spatial Variations in Thermal Conductivity and Expansivity on the Flow Patterns of Thermal Convection with Strongly Temperature-Dependent Viscosity[J]. Journal of Earth Science, 2014, 25(1): 126-139. doi: 10.1007/s12583-014-0405-y
    [13]Tongsuo Yang, Duqiang Xin, Tuanbu Wang, Dengwu Wang, Yongqian Shi, Yiguo Li. Research Program of Determination of Geological Age by Thermal Analysis Method[J]. Journal of Earth Science, 2013, 24(4): 657-662. doi: 10.1007/s12583-013-0358-6
    [14]Jie Wang, Tenger Boltsjun, Jianzhong Qin, Wenhui Liu, Cheng Tao, Ping Wang. Mesozoic Tectonic Evolution and Thermal History of the Yuanba Area of Northeast Sichuan Basin—Low-Temperature Thermochronology of Apatite and Zircon[J]. Journal of Earth Science, 2013, 24(4): 599-605. doi: 10.1007/s12583-013-0355-9
    [15]Ruxin Ding, Wei Wang. Paleotopographic Reconstruction on the Basis of Low-Temperature Thermochronological Thermal History Modelling[J]. Journal of Earth Science, 2013, 24(4): 652-656. doi: 10.1007/s12583-013-0357-7
    [16]Jie Wang; Tenger Boltsjun; Jianzhong Qin; Wenhui Liu; Cheng Tao; Ping Wang. Mesozoic Tectonic Evolution and Thermal History of the Yuanba Area of Northeast Sichuan Basin—Low-Temperature Thermochronology of Apatite and Zircon[J]. Journal of Earth Science, 2013, 24(4). doi: 10.1007/s12583-013-0355-9
    [17]Jianzhong Qin, Jie Wang, Nansheng Qiu. Evidence of Thermal Evolution History of Northeast Sichuan Basin—(U-Th)/He Low Temperature Thermochronometry of Apatite and Zircon[J]. Journal of Earth Science, 2008, 19(6): 591-601.
    [18]Xinwei Wang, Xinwen Wang, Yongsheng Ma. Thermal History of Rocks in the Shiwandashan Basin, Southern China: Evidence from Apatite Fission-Track Analysis[J]. Journal of Earth Science, 2005, 16(1): 29-37.
    [19]Shishu Xiong, Liting Huang, Jinfeng Chen, Jingsu Su. Multi-dimensional Seismic Response Analysis of Base-Isolated Frame Structure with 3D Isolator[J]. Journal of Earth Science, 2005, 16(1): 66-71.
    [20]Zhonghua Tang, Yonghong Wu, Sheng He, P F Siew. An Improved Method for Calculating Paleoheat Flow from Vitrinite Reflectance Profiles[J]. Journal of Earth Science, 2001, 12(4): 337-342.
  • Cited by

    Periodical cited type(10)

    1. Tuba Demir, Kürşat Esat Alyamaç. Yüksek Dayanımlı Betonların Basınç Dayanımının Olgunluk Yöntemi Tabanlı Tahmin Eden Sayısal Modellerin Geliştirilmesi. Fırat Üniversitesi Mühendislik Bilimleri Dergisi, 2024. doi:10.35234/fumbd.1464418
    2. Bodhisatwa Hazra, David A. Wood, Prasenjeet Chakraborty, et al. Comparative thermal behavior, Rock-Eval signature and kinetics of distinct thermally mature vitrain, fusain lithotypes and coals from India. International Journal of Coal Preparation and Utilization, 2023, 43(8): 1428. doi:10.1080/19392699.2022.2118261
    3. Aamir Ali, Tiago M. Alves, Yawar Amin. Integrated geophysical analysis of the Sembar Formation, Central Indus Basin, as an unconventional resource. Journal of Natural Gas Science and Engineering, 2022, 101: 104507. doi:10.1016/j.jngse.2022.104507
    4. Lateef Owolabi Lawal, Abdulrauf R. Adebayo, Mohamed Mahmoud, et al. Thermal maturation, mineral catalysis, and gas generation kinetics of carbonate source rock. Journal of Natural Gas Science and Engineering, 2021, 92: 104003. doi:10.1016/j.jngse.2021.104003
    5. Marta Waliczek, Grzegorz Machowski, Paweł Poprawa, et al. A novel VRo, T , and S indices conversion formulae on data from the fold-and-thrust belt of the Western Outer Carpathians (Poland). International Journal of Coal Geology, 2021, 234: 103672. doi:10.1016/j.coal.2020.103672
    6. Wei Xu, Nansheng Qiu, Jian Chang, et al. Mesozoic–Cenozoic thermal evolution of the Linqing Sub‐basin, Bohai Bay Basin (eastern North China Craton): Constraints from vitrinite reflectance data and apatite fission track thermochronology. Geological Journal, 2020, 55(7): 5049. doi:10.1002/gj.3701
    7. Arash Abarghani, Mehdi Ostadhassan, Thomas Gentzis, et al. Correlating Rock-Eval™ Tmax with bitumen reflectance from organic petrology in the Bakken Formation. International Journal of Coal Geology, 2019, 205: 87. doi:10.1016/j.coal.2019.03.003
    8. David A. Wood, Bodhisatwa Hazra. Characterization of organic-rich shales for petroleum exploration & exploitation: A review-Part 2: Geochemistry, thermal maturity, isotopes and biomarkers. Journal of Earth Science, 2017, 28(5): 758. doi:10.1007/s12583-017-0733-9
    9. David A. Wood. Sustainable Geoscience for Natural Gas Subsurface Systems. doi:10.1016/B978-0-323-85465-8.00001-7
    10. Bodhisatwa Hazra, David A. Wood, Devleena Mani, et al. Evaluation of Shale Source Rocks and Reservoirs. Petroleum Engineering, doi:10.1007/978-3-030-13042-8_5

    Other cited types(0)

  • Created with Highcharts 5.0.7Amount of accessChart context menuAbstract Views, HTML Views, PDF Downloads StatisticsAbstract ViewsHTML ViewsPDF Downloads2024-062024-072024-082024-092024-102024-112024-122025-012025-022025-032025-042025-0502.557.51012.5
    Created with Highcharts 5.0.7Chart context menuAccess Class DistributionFULLTEXT: 45.0 %FULLTEXT: 45.0 %META: 51.7 %META: 51.7 %PDF: 3.3 %PDF: 3.3 %FULLTEXTMETAPDF
    Created with Highcharts 5.0.7Chart context menuAccess Area Distribution其他: 3.1 %其他: 3.1 %China: 47.6 %China: 47.6 %Colombia: 2.4 %Colombia: 2.4 %India: 1.7 %India: 1.7 %Latvia: 0.5 %Latvia: 0.5 %Reserved: 3.6 %Reserved: 3.6 %Russian Federation: 18.6 %Russian Federation: 18.6 %Serbia: 0.7 %Serbia: 0.7 %Spain: 0.2 %Spain: 0.2 %United Kingdom: 1.7 %United Kingdom: 1.7 %United States: 20.0 %United States: 20.0 %其他ChinaColombiaIndiaLatviaReservedRussian FederationSerbiaSpainUnited KingdomUnited States

Catalog

    通讯作者: 陈斌, bchen63@163.com
    • 1. 

      沈阳化工大学材料科学与工程学院 沈阳 110142

    1. 本站搜索
    2. 百度学术搜索
    3. 万方数据库搜索
    4. CNKI搜索

    Figures(12)  / Tables(11)

    Article Metrics

    Article views(1132) PDF downloads(353) Cited by(10)
    Proportional views
    Related

    /

    DownLoad:  Full-Size Img  PowerPoint
    Return
    Return