Processing math: 100%
Advanced Search

Indexed by SCI、CA、РЖ、PA、CSA、ZR、etc .

Paulo Waltrich, John Whitehead, Richard Hughes, Karsten Thompson. A Study of Fluid Flow in Sediments and the Effect of Tidal Pumping. Journal of Earth Science, 2017, 28(5): 842-847. doi: 10.1007/s12583-017-0804-y
Citation: Paulo Waltrich, John Whitehead, Richard Hughes, Karsten Thompson. A Study of Fluid Flow in Sediments and the Effect of Tidal Pumping. Journal of Earth Science, 2017, 28(5): 842-847. doi: 10.1007/s12583-017-0804-y

A Study of Fluid Flow in Sediments and the Effect of Tidal Pumping

doi: 10.1007/s12583-017-0804-y
More Information
  • Corresponding author: Paulo Waltrich, waltrich@lsu.edu
  • Received Date: 15 Feb 2017
  • Accepted Date: 05 Sep 2017
  • Publish Date: 01 Oct 2017
  • Offshore drilling and production operations can result in spills or leaks of hydrocarbons into seabed sediments, which can potentially contaminate these sediments with oil. If this oil later migrates to the water surface it has the potential for negative environmental impacts. For proper contingency planning and to avoid larger consequences in the environment, it is essential to understand mechanisms and rates for hydrocarbon migration from oil containing sediments to the water surface as well as how much will remain trapped in the sediments. It is believed that the amount of oil transported out of the sediment can be affected by tidal pumping, a common form of subterranean groundwater discharge (SGD). However, we could find no study experimentally investigating the phenomenon of fluid flow in subsea sediments containing oil and the effects of tidal pumping. This study presents an experimental investigation of tidal pumping to determine if it is a possible mechanism that may contribute to the appearance of an oil sheen on the ocean surface above a sediment bed containing oil. An experimental apparatus was constructed of clear PVC pipe allowing for oil migration to be monitored as it flowed out of a sand pack containing oil, while tidal pressure oscillations were applied in three different manners. The effect of tidal pumping was simulated via compression of air above the water (which simulated the increasing static head from tidal exchange). Experimental results show that sustained oil release occurred from all tests, and tests with oscillating pressure produced for longer periods of time. Furthermore, the experimental results showed that the oil migration rate was affected by grain size, oil saturation, and oscillation wave type. In all oscillating experiments the rate and ultimate recovery was less than the comparable static experiments. For the conditions studied, the experimental results indicate that with an oscillating pressure on top of a sand pack, movement of a non-replenishing source of oil is suppressed by pressure oscillation.


  • Tidal pumping is a phenomenon frequently studied in the field of oceanography, and is a main mechanism for subterranean groundwater discharge (SGD), a phenomenon responsible for nutrient influx, and a common environmental problem associated with harmful algal blooms (LaRoche et al., 1997). SGD is defined as "any flow of water on continental margins from the seabed to the coastal ocean, regardless of fluid composition or driving force" (Burnett et al., 2006).

    Li et al. (2009) describes SGD and tidal pumping using a number of categories to explain the fluid-fluid interchange occurring. Later authors outline a number of requirements for the appearance of groundwater-seawater exchange, three of which include: (1) a terrestrial hydraulic gradient resulting from water flowing from high (on land) to the low (ocean); (2) hydraulic connectivity across a permeable barrier; (3) convection induced by a denser fluid (seawater) overlaying a lighter one (freshwater) (Li et al., 2009). In this study, these three mechanisms driving SGD are applied, albeit in a two-phase oil and water system where the lighter fluid is oil instead of freshwater.

    The question addressed in this study is whether oil trapped in subsea sediments can be mobilized during SGD, particularly in association with an oscillatory flow associated with tidal pumping. To the authors' knowledge, no such study has been carried out. The scenario in question is illustrated in Fig. 1. Understanding the oil release to the surface in this type of scenario will be important to quantify the environmental impact of underwater sediments which are contaminated with oil from underwater seepages or subterranean spills.

    Figure  1.  Diagram of tidal pumping experiment studied.

    Table 1 shows the different parameters investigated for each experimental run and its corresponding pressure oscillation pattern. These experiments have the objective of evaluating the oil migration for different oscillation configurations. Oscillating pressure conditions are meant to represent tidal changes present in the offshore environment, which may affect the oil migration from underwater oil-contaminated sediments. Different patterns were also investigated to evaluate the effect in oil migration due to the rate of change in pressure as a consequence of tidal changes. Pressure oscillations were created using a three-way solenoid valve, a timer relay, a pressure regulator and a pressure source (air tank), as shown in Fig. 2. The pressure oscillation patterns were obtained by varying the time or period to activate the time relay.

    Table  1.  Overview of different experimental runs
    Pressure oscillation type Parameter of analyze Test run#
    Static test (no oscillation) Different grain sizes 1
    Different oil types 2
    Different oil-contamination fractions 3
    Square-wave pressure oscillation Pressure oscillation type 4
    Smooth-Wave pressure osicllation Pressure oscillation type 5
     | Show Table
    DownLoad: CSV
    Figure  2.  Schematic diagram of the experimental setup.

    The experimental apparatus used in the present work consists of a clear PVC pipe, 8-ft long and 4-in ID, packed with one of two sand types: Granusil 5005 (150 µm) and UNIMIN 20/40 (400–841 µm). Two different oil types were used in this study: Ⅰ. SAE 30 motor oil–viscosity≈135 cp; density≈0.875 g/mL. Ⅱ. Canola cooking oil–viscosity≈35 cp; density≈0.921 g/mL.

    Pressure in the experiment was measured with two pressure transducers: one at the top of the experimental pipe and one at the bottom, in order to measure hydraulic connectivity between the two locations.

    Oil volume recovered was measured using a time-lapse camera and image processing software (Photron, 2013). This software was used to measure the height of oil floating at the top of the water surface in the pipe. Knowing the pipe diameter, the oil volume recovered was obtained multiplying area of the pipe by the height of oil measured from the camera images. The camera recoded images for the oil height every 1.5 h.

    A water reservoir was also added to the experimental setup, connected to the bottom of the pipe to mimic a high level water source. This water reservoir was sufficiently large that the water level in the reservoir would not change significantly during the pressure oscillations induced in the experimental pipe. In other words, the pressure in the bottom of the sandpack remained constant (as it would if well connected hydraulically to a constant-head onshore source); the oscillating pressure on the top of the sand pack thus mimics the changing head associated with the tidal exchange (which in turn creates changing pressure gradients inside the sandpack).

    One of the two different oil types was funneled slowly from the top of the sand pack allowing for minimal disturbance to the sand face while introducing oil into the sandpack. Simultaneously, a valve at the bottom of the pipe was opened allowing the oil to flow into the sandpack from top to bottom. At the first drop of oil in the valve at the bottom of the sandpack, this valve was closed, the total oil volume added to the sand pack was recorded, and the sand was assumed to have its maximum oil saturation at this point, as shown in Fig. 3a. The oil contamination fraction (fo) is defined as the ratio between the height of oil-contaminated zone (ho) and the total height of the sandpack (h).

    Figure  3.  Two different loading schemes were used in the experiments, (a) fo=100%, and (b) fo=15%.

    A second loading mechanism was used to create 15% oil-contaminated fraction. The main reason for this second situation is to evaluate if an isolated oil-containing zone can produce oil by buoyant forces under static and oscillating pressure conditions. Also, we wanted to show if sediments with smaller contaminated fractions show lower or higher percentage oil recovery (e.g., ratio between the oil volume recovered at the water surface and total volume of oil added to the sandpack).

    A known amount of water and sand was prepared in a slurry and poured into the pipe, followed by a known amount of oil, water, and sand mixed and poured on top of the previous slurry. This procedure created a layered pattern as shown in Fig. 3b. Once loading was completed by either of the two methods described in Fig. 3, water was added slowly on top of the contaminated sandpack until the water in the pipe was the same height as water located in the constant-head reservoir, as illustrated in Fig. 2. The constant-head reservoir previously filled with water was then hydraulically connected to the bottom of the experiment pipe. The experiment began once water had been added on top of the sandpack and the valve connecting the barrel and pipe was opened.

    In all experiments, the percentage of volume of oil recovered is defined by the following ratio

    %VolRecovered=(oilvol.recoveredatwatersurfaceinitialvolumeofoil)100
    (1)

    All experimental tests in Table 1 were repeated twice to evaluate repeatability of the experimental procedure. The repeatability evaluation showed differences no larger than ±5% for all tests.

    The mechanisms for upward oil migration in the static experiment are a combination of buoyancy driven flow and countercurrent imbibition of water into the contaminated zone. At the outset of the experiment, globules of oil begin forming at the sandface. A larger number of these "nucleation sites" for oil globules were observed for the small grain size sand when compared to the large size grain sand.

    The time at which the migration ends is governed by a balance between buoyant and interfacial forces. Prior to this time, the rate of oil released from the contaminated zone is governed by the balance between the viscous forces associated with flow and the interfacial and gravity forces driving it upward. As water begins to replace the pore space previously occupied by oil, interfacial forces decrease and oil blobs can become disconnected, thus leading to the final equilibrium state. The process can be significantly affected by certain properties of this system.

    Three properties were tested in the static experiment: effect of sand grain size, oil type and oil contamination fraction.

    Two water-wet sand grain sizes were used: a fine grain (150 µm) and an unsorted coarse grain (400–841 µm). The primary finding was that grain size affects total oil recovered and migration rate, as shown in Fig. 4.

    Figure  4.  Comparison between sand grain types for the static experiment.

    The effect due to sand type was relatively large. The sand with larger permeability shows significantly more oil recovered at the surface. The large-grain-sand released nearly 75% of the entrapped oil, while the fine-grain sand released only 15% after 48 h. Both results are in agreement with the results for a similar system obtained by Tokunaga et al. (2000). Also, Schechter et al. (1994) suggested that for the imbibition processes if the inverse of the Bond number (NB-1) is higher than 5, the flow is capillary dominated, and for NB-1 < < 1 it is gravity dominated. Inverse Bond number is defined by the following expression (Schechter et al., 1994)

    N1B=CσφkΔρgH
    (2)

    where σ is the interfacial tension, ϕ is the porosity in fraction, k is the permeability in m2, Δρ is the density difference between the wetting and non-wetting phases, g is the acceleration of gravity, H is the height, and C is a constant (C=0.4 for capillary tubes).

    For our experiments the inverse Bond numbers are NB‑1= 1 815 for the Granusil 5005 (150 µm), and NB-1=115 for the UNIMIN 20/40 (400–841 µm) sand. The estimated values for all parameters used to calculate the inverse Bond number are given in Table 2. Therefore, based on the observation of Schechter et al. (1994), it is possible to conclude that our experiments for both sand types are capillary dominated. However, the higher value for NB-1 for the fine grain sand explains the lower oil volume recovery for this sand type, as capillary forces are larger and can stop oil migration for lower water saturations (e.g., higher oil saturations). Even though the flow is capillary dominated, for both sand types the experimental data show that is possible to obtain oil migration to the water surface for the conditions investigated in this study.

    Table  2.  Estimated fluid and sand properties used to calculate capillary and bond numbers
    Property Units Value
    Surface tension, σ N/m 0.05
    Contact angle, γ ° 30
    Oil viscosity Pa·s 0.135
    Oil density kg/m3 875
    Angle between flow and horizontal direction ° 90
    Gravity m/s2 9.82
    Water viscosity Pa·s 0.001
    Water density kg/m3 998
    Permeability for Granusil 5005 (150 µm) sand m2 1e-9
    Permeability for UNIMIN 20/40 (400–841 µm) sand m2 1e-12
    Sand porosity for Granusil 5005 (150 µm) sand - 0.30
    Sand porosity for UNIMIN 20/40 (400–841 µm) sand - 0.15
     | Show Table
    DownLoad: CSV

    The oil-water migration can occur in two possible ways: (ⅰ) counter-current flow, and (ⅱ) co-current flow created by the water fingering into oil-contaminated zone of the sand pack. In the co-current flow water is coming from the water reservoir.

    Tokunaga et al. (2000) experimentally investigated the migration of oil in a similar system; they injected oil through a column of glass-beads saturated with water. The authors correlated oil displacement patterns with capillary and modified Bond number defined as

    Ca=uoμoσcosγ
    (3)
    Bo=(ρwρo)gsin(θ)kσcos(γ)φ
    (4)

    where uo is the Darcy velocity of oil.

    Tokunaga et al. concluded that a stable piston like displacement occurred for large Ca/Bo′ ratios, and an unstable, fingering occurred for small values of Ca/Bo′ ratios, as shown in Fig. 5. For our experiments using two sand types, we calculated capillary and modified Bond numbers and obtained the results presented in Fig. 5 by the red and blue dots. The estimated values for all parameters used to calculate capillary and modified Bond numbers are given in Table 2.

    Figure  5.  Displacement pattern results obtained by Tokunaga et al. (2000). Their results show that a stable piston like displacement occurred for large Ca/Bo′ ratios, and an unstable, fingering occurred for small values of Ca/Bo′ ratios. Capillary and Bond number are indicated for the static experiments in this study using large grain (red dot) and small grain (blue dot) sizes.

    For both sand types, our results matched the observations of Tokunaga et al., when a large number of nucleation site of oil globules were observed for the small grain size (blue dot), indicating stable displacement (which would have a more uniform distribution on the sand face). For the large grain size sand (red dot), a few nucleation sites were observed in our experiments, which match with the results capillary fingering obtained by Tokunaga et al. (2000). The larger grain sand has both a higher porosity and a larger permeability. The larger permeability and larger pore diameters allow for less viscous and capillary resistance against the buoyancy driven oil migration mechanism. The larger permeability allows for the migration of oil at larger rates compared to that of the finer grain sand and for a lower final oil saturation.

    Figure 6 presents the experimental results for the two oil types. When comparing the SAE30 to cooking oil, the percent difference in mobilized oil was about 10% after a 48 h test. The oil recovered for the SAE30 was substantially larger after 18 h. We believe this early difference can be attributed to the formation of an emulsion in the SAE motor oil experiment. The SAE motor oil has surfactants added to the oil that create an emulsion when mixed with water. Unfortunately, this emulsion contains small air bubbles, which increases the visual volume of oil at the water surface. While the quantity recovered was artificially increased at the water surface, the emulsion was likely not the sole reason for the migration rate and ultimate recovery to be larger. For the motor oil result, a larger fluid density differential between the oil type and the water leads to a larger buoyant force, and the surfactants in the motor oil may also have lowered the interfacial forces, allowing greater mobilization.

    Figure  6.  Comparison of oil types for the static experiment.

    As shown in Fig. 7, oil contamination fraction affects ultimate recovery. Lower initial oil saturation corresponds to less movable oil, and the system reaches residual oil saturation faster when compared to a system with larger oil saturation. This result was both expected and substantial with the fo=100% producing approximately 75% in the first 48 h, while the fo=15% sample produced only 40% of the oil in place at 48 h.

    Figure  7.  Comparison of different oil saturations for the static pressure experiment.

    The initial oscillation experiment was run using 18 seconds of +1.5 psig (16.2 psia) followed by 30 minutes of 0 psig (14.7 psia), as illustrated in Fig. 8. The pressure oscillation of 1.5 psi was selected to replicate similar pressure variations at the seabed sediments when compared to tide levels in the Gulf of Mexico, which can vary up to 3 ft between low and high tides.

    Figure  8.  Uneven square pressure oscillation diagram.

    Figure 9 presents the results for the volume of oil recovered for the square wave pressure oscillations test for fo=100%. These results suggest that tidal pumping was capable of suppressing oil migration when compared to the static pressure tests. For the square wave pressure oscillation test, the volume recovered measured after 48 h was around 20%, which was significantly lower than the 75% oil recovery for the static test with the same oil type and saturation.

    Figure  9.  Oil migration vs time for the static experiment and uneven square wave oscillation.

    In the experiment with square wave pressure oscillations, sudden pressure changes may have resulted in a surge of water invading the sandface in a short period of time.

    One can argue that a sudden pressure oscillation may not produce the same results as slow pressure variations, which would better simulate tidal changes. Therefore, smooth-wave pressure tests were performed to compare the results of sudden and smooth-wave pressure changes.

    The second oscillating experiment used smooth-wave pressure oscillations as illustrated in Fig. 10. This allowed for a better representation of the shape of actual tidal waves, albeit in a shorter period compared to the actual tide cycle. The wave's period was 90 s, while still allowing for a significantly slower pressure increase and decrease when compared to the square wave oscillations.

    Figure  10.  Smooth-wave pressure oscillations diagram.

    The experimental results in Fig. 11 indicate that the Smooth-wave pressure oscillations also decrease the oil release from the sediments compared to static conditions. Figure 11 shows that the amount of oil recovered for static pressure is approximately 30%, while for tests with Smooth pressure wave the recovered volume is only 20%, for the sand type, and oil viscosity and density. Even though the test with smooth pressure wave has an oil saturation (fo=100%) higher than the test with static pressure (fo=15%), the amount of oil recovered is still lower for tests with the smooth pressure wave. These results suggest that an oscillating pressure above a saturated subsea sand bed would produce oil more slowly and likely over a longer period of time than is produced under static pressure even when the oil saturation is low.

    Figure  11.  Static runs compared to smooth-wave pressure oscillations runs with the same oil saturation.

    Vertical displacement of oil by water in a sand pack was completed in this experiment and the effects relating to an oscillating pressure above an oil containing sandpack were studied. The following conclusions were found from the analysis of the experimental data.

    (a) Results with oscillating pressure suggest that the effect of tidal pumping can suppress oil migration for contaminated sediments. When the oil migration rate is compared for static versus oscillating tests, the experimental results shows that the oil migration is suppressed for oscillating conditions. This experimental observation suggests that underwater sediments under the effects of tidal pumping could retain oil contaminants, creating a slower release of oil.

    (b) One potential impact of the previous conclusion is for cases of oil leaking from subsea wellheads, including cases where the leak has been sealed. Observations of oil at the water surface would not be conclusive of a continued leak as it may indicate release from contaminated sediments.

    (c) The effect of sand grain size is an important parameter in the migration of oil. The experiments with coarse grain sand had four times larger oil volume recovered at the surface when compared to fine grain sand. This effect was attributed primarily to differences in capillary pressure with differences in permeability between the two sand types as a secondary contributor.

    (d) Oil type affected the ultimate recovery. A lower viscosity and higher density fluid (cooking oil) showed less ultimate recovery than a higher viscosity lower density fluid (SAE30). The result did not scale directly with viscosity (oil recovery only changed by 50% for a variation in viscosity of about four times); hence interfacial tension differences between the two oils may also have affected the result. Surfactants in the SAE30 oil also may have impacted the observations.

    (e) As expected, oil saturation affected the ultimate recovery and migration rate of oil. Lower initial oil saturation means a lower volume of oil that can be mobilized before the remaining oil is trapped by capillary forces.

    (f) In all oscillating experiments, the rate and ultimate recovery was less than the comparable static experiments. This result suggests that with an oscillating pressure on top of a sand pack (mimicking a tidal exchange), a non-replenishing source of oil can be mobilized for an extended period of time.

    A number of LSU employees and students aided in the design of the experimental apparatus and collection of experimental data. Major contributors including Chris Carver (LSU PERTT lab), Renato Coutinho, Eric Laurent, Catalina Posada, and Marcus Smith. Part of this paper was originally published by ASME and was presented at the ASME 35th International Conference on Ocean, Offshore and Arctic Engineering held in Busan, South Korea, 19–24 June, 2016. The final publication is available at Springer via https://doi.org/10.1007/s12583-017-0804-y.

    NOMENCLAUTRE
    Ca Capillary number (-)
    Bo′ Modified Bond number (-)
    k Permeability (m2)
    g Acceleration of gravity (m/s2)
    H Height (m)
    NB Bond number (-)
    uo Darcian oil velocity (m/s)
    μo Oil viscosity (Pa·s)
    μw Water viscosity (Pa·s)
    γ Contact angle (°)
    θ Angle between fluid flow and horizontal direction (°)
    ρo Oil density (kg/m3)
    ρw Water density (kg/m3)
    Porosity (-)
    fo Oil contamination fraction
     | Show Table
    DownLoad: CSV
  • Burnett, W. C., Aggarwal, P. K., Aureli, A., et al., 2006. Quantifying Submarine Groundwater Discharge in the Coastal Zone via Multiple Methods. Science Total Environment, 367: 498-543 doi: 10.1016/j.scitotenv.2006.05.009
    LaRoche, J., Nuzzi, R., Waters, R., et al., 1997. Brown Tide Blooms in Long Island's Coastal Waters Linked to Interannual Variability in Groundwater Flow. Global Change Biology, 3(5): 397-410. https://doi.org/10.1046/j.1365-2486.1997.00117.x
    Li, X. Y., Hu, B. X., Burnett, W. C., et al., 2009. Submarine Ground Water Discharge Driven by Tidal Pumping in a Heterogeneous Aquifer. Ground Water, 47(4): 558-568. https://doi.org/10.1111/j.1745-6584.2009.00563.x
    Photron Fastcam Software, Version 2013. User Guide 2013. San Diego, CA
    Schechter, D. S., Zhou, D., Orr, F. M. Jr, 1994. Low IFT Drainage and Imbibition. Journal of Petroleum Science and Engineering, 11(4): 283-300. https://doi.org/10.1016/0920-4105(94)90047-7
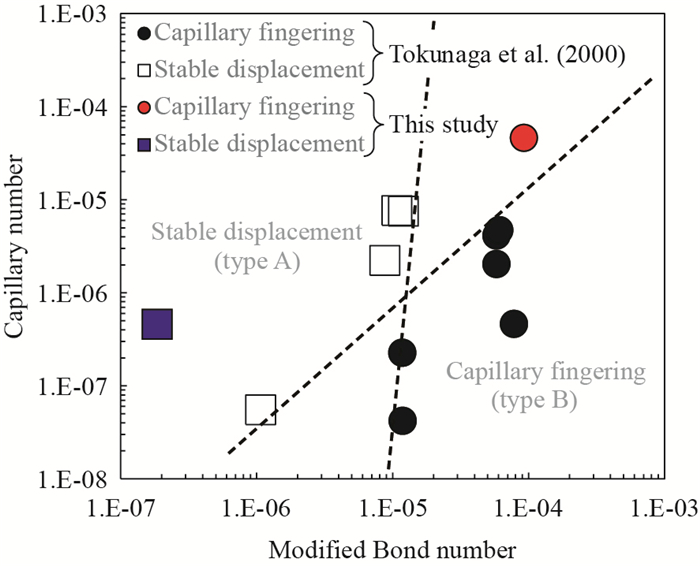
    Tokunaga, T., Mogi, K., Matsubara, O., et al., 2000. Buoyancy and Interfacial Force Effects on Two-Phase Displacement Patterns: An Experimental Study1. AAPG Bulletin, 84(1): 65-74. https://doi.org/10.1306/c9ebcd65-1735-11d7-8645000102c1865d
  • Relative Articles

    [1]Huajian Wang, Yunyang Wan, Yuke Liu, Jinyou Zhang, Shuichang Zhang. Proven and Potential Microbial Contributions to the Gulong Shale Oil[J]. Journal of Earth Science, 2024, 35(6): 2149-2153. doi: 10.1007/s12583-024-2020-x
    [2]Shang Xu, Jie Wen, Qiyang Gou, Qiqi Li, Bingchang Liu. Research Progress and Significance of Shale Oil Micro-Migration[J]. Journal of Earth Science, 2024, 35(5): 1765-1769. doi: 10.1007/s12583-024-0071-7
    [3]YUPING WU, Chinglin Liu, Fujie Jiang, Tao Hu, Chenxi Zhang, Jiahao Lv, Renda Huang, Meiling Hu, Guanyun Wu, Rizwan Sarwar Awan. Investigation of oil content in lacustrine shale-oil systems: Insights from two different pyrolysis[J]. Journal of Earth Science. doi: 10.1007/s12583-023-1814-6
    [4]Caineng Zou, Zhi Yang, Guoxin Li, Jianzhong Li, Xianyang Liu, Yong Tang, Tao Jiang, Yu Yang, Xuefeng Bai, Songqi Pan, Lu Minghui, Zhengdong Lei, Bo Cai. Why Can China Realize the Continental "Shale Oil Revolution"?[J]. Journal of Earth Science, 2022, 33(5): 1324-1327. doi: 10.1007/s12583-022-1745-7
    [5]Yunzhao Zhang, Lianbo Zeng, Qun Luo, Rukai Zhu, Wenya Lyu, Dongdong Liu, Quanqi Dai, Shouxu Pan. Influence of Natural Fractures on Tight Oil Migration and Production: A Case Study of Permian Lucaogou Formation in Jimsar Sag, Junggar Basin, NW China[J]. Journal of Earth Science, 2021, 32(4): 927-945. doi: 10.1007/s12583-021-1442-y
    [6]Yongshi Wang, Chao Liang, Xinian Sun. Shale Oil Reservoir Characteristics and Enrichment in the Jiyang Depression, Bohai Bay Basin, East China[J]. Journal of Earth Science, 2017, 28(6): 977-986. doi: 10.1007/s12583-016-0940-9
    [7]Shehzad Ahmed, Khaled Abdalla Elraies, Jalal Foroozesh, Siti Rohaida Bt Mohd Shafian, Muhammad Rehan Hashmet, Ivy Chai Ching Hsia, Abdullah Almansour. Experimental Investigation of Immiscible Supercritical Carbon Dioxide Foam Rheology for Improved Oil Recovery[J]. Journal of Earth Science, 2017, 28(5): 835-841. doi: 10.1007/s12583-017-0803-z
    [8]Haiyan Hu, Zhiping Zeng, Jianzhang Liu. Key elements controlling oil accumulation within the tight sandstones[J]. Journal of Earth Science, 2015, 26(3): 328-342. doi: 10.1007/s12583-015-0550-y
    [9]Wei Shi, Hongling Wu, Shuwen Dong, Mi Tian. Oil/Gas Migration and Aggregation in Intra-Continental Orogen Based on Numerical Simulation: A Case Study from the Dabashan Orocline, Central China[J]. Journal of Earth Science, 2013, 24(2): 254-261. doi: 10.1007/s12583-013-0326-1
    [10]Yang Luo; Yanchao Zhao; Xinhua Lü. Characteristics and Evaluation of the Shale Oil Reservoir in Upper Es3 Inter Salt in Liutun Sag[J]. Journal of Earth Science, 2013, 24(6). doi: 10.1007/s12583-013-0389-z
    [11]Yongpeng Hua, Zejiao Luo, Shenggao Cheng, Rui Xiang. Health risks of organic contaminated soi l in an out-of-service oil refinery site[J]. Journal of Earth Science, 2012, 23(1): 121-128. doi: 10.1007/s12583-012-0237-6
    [12]Junfeng Yu, Jianxiang Pei, Jing Xu. New Insight into Oil and Gas Exploration in Miocene and Late Oligocene Strata in Qiongdongnan Basin[J]. Journal of Earth Science, 2009, 20(5): 811-823. doi: 10.1007/s12583-009-0055-7
    [13]Fangbing Zhu. Geological Conditions Favourable for High-Wax Oil Enrichment in Damintun Depression, Bohai Bay Basin[J]. Journal of Earth Science, 2009, 20(4): 709-719. doi: 10.1007/s12583-009-0066-4
    [14]Yuanchun ZHANG, Huayao ZOU, Cunwu WANG, Pingping LI. Reserve and Pressure Change of Paleo-oil Reservoir in Puguang Area, Sichuan Basin[J]. Journal of Earth Science, 2008, 19(6): 726-738.
    [15]Huayao ZOU, Yuanchun ZHANG, Jianzhang LIU, Jiannan SHI. Evolution of the Moxizhuang Oil Field, Central Junggar Basin, Northwest China[J]. Journal of Earth Science, 2008, 19(3): 242-251.
    [16]Shengxiang Long. Formation Models and Distribution of Oil and Gas Pools in Tarim Basin, China[J]. Journal of Earth Science, 2008, 19(6): 665-674.
    [17]Hongzhen Wang, Sitian Li. Tectonic Evolution of China and Its Control over Oil Basins[J]. Journal of Earth Science, 2004, 15(1): 1-8.
    [18]A A Ibrahim, T A Musa. Experimental Study Optimizing Hole Cleaning-Cuttings Transport in Oil Drilling Engineering[J]. Journal of Earth Science, 2003, 14(2): 182-189.
    [19]Tagwa A Musa, Ahmed A Ibrahim, Zhenliang Guan. Development Plan of East Unity Oil Field, Sudan, Using Reservoir Simulation Study[J]. Journal of Earth Science, 2002, 12(3): 248-251.
    [20]A A Ibrahim, A M Fadoul, T A Musa, Aiguo Yao. A High-Mathematical Model Optimizing Cuttings Transport in Oil Drilling Engineering[J]. Journal of Earth Science, 2001, 12(3): 276-278.
  • Cited by

    Periodical cited type(1)

    1. Theresa A. O’Meara, Judi E. Hewitt, Simon F. Thrush, et al. Denitrification and the Role of Macrofauna Across Estuarine Gradients in Nutrient and Sediment Loading. Estuaries and Coasts, 2020. doi:10.1007/s12237-020-00728-x

    Other cited types(0)

  • Created with Highcharts 5.0.7Amount of accessChart context menuAbstract Views, HTML Views, PDF Downloads StatisticsAbstract ViewsHTML ViewsPDF Downloads2024-052024-062024-072024-082024-092024-102024-112024-122025-012025-022025-032025-040246810
    Created with Highcharts 5.0.7Chart context menuAccess Class DistributionFULLTEXT: 45.7 %FULLTEXT: 45.7 %META: 53.1 %META: 53.1 %PDF: 1.2 %PDF: 1.2 %FULLTEXTMETAPDF
    Created with Highcharts 5.0.7Chart context menuAccess Area Distribution其他: 0.5 %其他: 0.5 %Australia: 0.7 %Australia: 0.7 %Barbados: 0.5 %Barbados: 0.5 %Brazil: 0.5 %Brazil: 0.5 %China: 35.1 %China: 35.1 %Egypt: 1.5 %Egypt: 1.5 %France: 1.2 %France: 1.2 %Germany: 0.5 %Germany: 0.5 %India: 1.2 %India: 1.2 %Iraq: 0.7 %Iraq: 0.7 %Japan: 0.5 %Japan: 0.5 %Mexico: 0.5 %Mexico: 0.5 %Morocco: 0.7 %Morocco: 0.7 %Reserved: 2.5 %Reserved: 2.5 %Russian Federation: 5.4 %Russian Federation: 5.4 %Taiwan, China: 3.0 %Taiwan, China: 3.0 %United States: 43.7 %United States: 43.7 %Viet Nam: 1.2 %Viet Nam: 1.2 %其他AustraliaBarbadosBrazilChinaEgyptFranceGermanyIndiaIraqJapanMexicoMoroccoReservedRussian FederationTaiwan, ChinaUnited StatesViet Nam

Catalog

    通讯作者: 陈斌, bchen63@163.com
    • 1. 

      沈阳化工大学材料科学与工程学院 沈阳 110142

    1. 本站搜索
    2. 百度学术搜索
    3. 万方数据库搜索
    4. CNKI搜索

    Figures(11)  / Tables(3)

    Article Metrics

    Article views(641) PDF downloads(175) Cited by(1)
    Proportional views
    Related

    /

    DownLoad:  Full-Size Img  PowerPoint
    Return
    Return