Advanced Search

Indexed by SCI、CA、РЖ、PA、CSA、ZR、etc .

Chuang Lei, Shiyan Yin, Jiaren Ye, Jingfu Wu, Zhaosheng Wang, Bin Gao. Geochemical Characteristics and Hydrocarbon Generation Modeling of the Paleocene Source Rocks in the Jiaojiang Sag, East China Sea Basin. Journal of Earth Science, 2024, 35(2): 642-654. doi: 10.1007/s12583-021-1528-6
Citation: Chuang Lei, Shiyan Yin, Jiaren Ye, Jingfu Wu, Zhaosheng Wang, Bin Gao. Geochemical Characteristics and Hydrocarbon Generation Modeling of the Paleocene Source Rocks in the Jiaojiang Sag, East China Sea Basin. Journal of Earth Science, 2024, 35(2): 642-654. doi: 10.1007/s12583-021-1528-6

Geochemical Characteristics and Hydrocarbon Generation Modeling of the Paleocene Source Rocks in the Jiaojiang Sag, East China Sea Basin

doi: 10.1007/s12583-021-1528-6
More Information
  • Corresponding author: Jiaren Ye, jrye@cug.edu.cn
  • Received Date: 31 May 2021
  • Accepted Date: 05 Aug 2021
  • Issue Publish Date: 30 Apr 2024
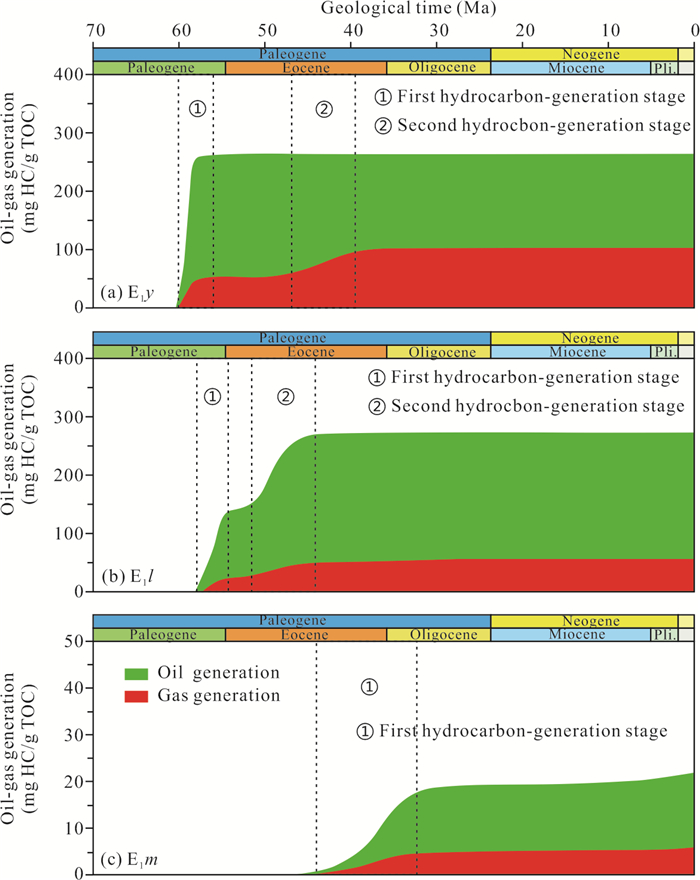
  • Jiaojiang sag in the East China Sea Basin is at the earlier exploration stage, where characterizing hydrocarbon generation of source rocks is important to understand oil-gas exploration potential. Utilizing geochemical and basin modeling analysis, hydrocarbon generation capacity and process of the Paleocene E1y, E1l and E1m formations were investigated. Results show that E1y and E1l mudstones are high-quality source rocks with Type II kerogen, which is dominated by both aquatic organisms and terrestrial higher plants deposited in sub-reduced environment. E1m mudstone interbedded with thin carbonaceous mudstone and coal is poor-quality source rock with Type III kerogen, whose organic matter was originated from terrestrial higher plants under oxidized environment. Controlled by burial and maturity histories, E1y and E1l source rocks experienced two hydrocarbon generation stages, which took place in the Late Paleocene and in the Middle to Late Eocene, respectively, and had high hydrocarbon generation capacity with cumulative hydrocarbon volume of 363 and 328 mg/g, respectively. E1m source rock only had one hydrocarbon generation process in the Late Eocene, which had low hydrocarbon generation capacity with cumulative hydrocarbon volume of only 24 mg/g. The future oil-gas exploration in the Jiaojiang sag should focus on hydrocarbon generation center and select targets in the central uplift formed before the Miocene with high-quality traps.


  • Conflict of Interest
    The authors declare that they have no conflict of interest.
  • Low-exploration basins have attracted considerable attention to seek reserve replacement or exploration breakthrough. Jiaojiang sag in the East China Sea Basin (ECSB) is a new exploration area with no commercial oil and gas discovery. Limited exploration in the Jiaojiang sag started in 1980s and only 5 wells in the central uplift or the sag edge were drilled (Cai et al., 2016), including 1 oil-gas well (Well JJ4-1) and 1 oil-gas shows well (Well JJ6-1). These two wells showed the presence of oil and gas in the sandstone of the Paleocene E1y and E1m formations. In addition, a gas field called LS36-1 has been discovered in the Lishui sag, which is adjacent to the Jiaojiang sag. These findings strongly indicate the presence of significant exploration potential in the Jiaojiang sag. Nonetheless, the scarcity of drilling and geological data in the past resulted in uncertainties about the petroleum system in the Jiaojiang sag, and these uncertainties hampered oil-gas exploration.

    Recently, several studies have focused on the basic geological issues such as tectonic evolution, sedimentary system evolution and provenance in the Jiaojiang sag. The achievements can be summarized as follows: (1) Yandang uplift in the east of Jiaojiang sag and Minzhe uplift in the west provided a continuous provenance supply during the Paleocene (Gao et al., 2019; Tian et al., 2012a); (2) the sand-rich sedimentary systems include fan delta facies, delta facies and gravity flow facies, and organic-rich sedimentary systems include lake facies and marine facies (Zhu et al., 2019; Chen et al., 2017); (3) three sets of reservoir-cap assemblages are presented in the Paleocene strata (Tian et al., 2012b); (4) mudstone and coal-measure mudstone sediments in the Paleocene E1y, E1l and E1m formations are considered as potential source rocks (Lei et al., 2021; Li et al., 2019). Nevertheless, there are little or no published works on the geochemical characteristics and hydrocarbon generation potential from the Paleocene source rocks in the Jiaojiang sag.

    Based on the bulk geochemistry study on 57 samples and molecular biomarker study on 11 samples, this reseach focuses on the evaluation of organic matter richness, type and thermal maturity of the Paleocene source rocks in the Jiaojiang sag through investigating their geochemical characteristics such as Rock-Eval pyrolysis and H/C, O/C atomic ratios, etc. In addition, depositional environment and organic matter origin of the Paleocene source rocks are determined using biomarker indicators. Finally, hydrocarbon generation capacity and process of the Paleocene source rocks are determined by reconstructing buried, thermal, maturity and hydrocarbon generation histories with basin modeling, so as to provide insight into further oil and gas exploration in the Jiaojiang sag.

    The ECSB is the largest offshore petroliferous basin in China, with a total area of 240 000 km2 and a maximum deposition thickness of about 15 000 m. It is a typical back-arc rift basin and can be divided into three structural zones from west to east (Figure 1a), of which the western depression zone includes the Taibei and Yangtze depressions, the central uplift zone includes the Yushan, Haijiao and Hupijiao uplifts, and the eastern depression zone includes the Diaobei, Xihu and Fujiang depressions. The focus of this reseach, Jiaojiang sag, is NE extending in the west of Taibei Depression with length and width of about 72 km (from south to north) and 50 km (from east to west) and water depth of less than 100 m. Controlled by NE trending fault, the sag can be structurally subdivided into Jiaojiang eastern sub-sag and Jiaojiang western sub-sag (Figure 1b). The Jiaojiang eastern sub-sag covers 2 300 km2 with a maximum deposition thickness of 7 500 m. It is graben and semi-graben in southern and dustpan-like fault (faulting in the east and overlap in the west) in the northern. The Jiaojiang western sub-sag covers 1 200 km2 with a maximum deposition thickness of 6 100 m, which is dustpan-like fault with faulting in the east and overlap in the west (Figure 1c).

    Figure  1.  Map (a) showing location and structural units of the East China Sea Basin, maps (b) and (c) showing tectonic setting of the Jiaojiang sag.

    Jiaojiang sag is a Cenozoic sedimentary basin developed on the top of Mesozoic residual basins with Mesoproterozoic metamorphic rocks and Mesozoic igneous rocks as basement. It successively experienced four tectonic evolution phases, namely, syn-rifting, post-rifting, uplifting and regional subsidence (Jiang et al., 2015). Correspondingly, the deposition environment evolved from continental lake to marine-continental transitional water, and then to marine (Zhu et al., 2019). Intensive fault activities during syn-rifting phase from the Late Cretaceous to Paleocene cut basement and controlled location of deposition and subsidence center, depositing the Paleocene E1y, E1l and E1m formations successively (Figure 2). Mudstone and coal-measure mudstone sediments in the E1y, E1l and E1m formations are regarded as potential source rocks in the Jiaojiang sag: (1) the E1y was primarily a set of lacustrine deposits with dark mudstone thickness of 200–800 m; (2) the E1l was dominated by coastal marine deposits developed in transgressive environment with maximum dark mudstone thickness of 500 m; and (3) the E1m was mainly deposited in regression environment with coal-measure mudstone thickness of 100–300 m. The Oujiang (E2o) and Wenzhou (E2w) formations of shallow marine facies were deposited during post-rifting phase from the Eocene to Oligocene, when weak activities of a few inherited faults had no obvious control on deposition. Uplift due to Yuquan orogenesis at the end of Eocene and Huagang orogenesis at the end of Oligocene resulted in the loss of the Eocene Pinghu (E2p) Formation and Oligocene Huagang (E3h) Formation, forming an obvious unconformity between the Eocene and Miocene. After that, Jiaojiang sag and associated open area in the east entered regional subsidence phase widely depositing the Miocene Longjing (N1j), Yuquan (N1y) and Liulang (N1l) formations, Pliocene Santan (N2s) Formation and Pleistocene Donghai (Qd) Formation of marine-continental transitional facies or shallow marine facies.

    Figure  2.  Generalized stratigraphy of the Jiaojiang sag. Fm. Formation.

    Fifty-seven samples from the E1y, E1l and E1m formations were collected from wells JJ4-1 and JJ6-1 (well location is seen in Figure 1b). The buried depths of sampling interval in these two wells vary from 1 944 to 2 520 m and 2 644 to 3 334 m, respectively. Measured vitrinite reflectance values (%Ro) of samples in these two wells range from 0.44% to 0.58%, and 0.48% to 0.64%, respectively.

    All samples were washed and then crushed into fine powders. After that these samples were pyrolyzed using a Rock-Eval II instrument equipped with total organic carbon measurement function. For this analysis, S1, S2, S3, Tmax as well as TOC values were determined.

    Eleven mudstone samples with high TOC content were chosen for further gas chromatography (GC), gas chromatography/mass spectrometry (GC/MS), and elemental composition and stable carbon isotope of kerogen measurements. Chosen samples were extracted for 72 h using chloroform solution to obtain the rock extractions. Firstly, the rock extractions were separated into saturate, aromatic and resin fractions using column chromatography method. Saturate hydrocarbon was conducted for GC and GC/MS measurement using an Agilent 7890 instrument (a PONA fused silica column, 60 m × 0.25 mm i.d., film thickness 0.25 μm) and an Agilent 7890A-GC/5975C-MS instrument coupled with a HP-5MS fused silica column (30 m × 0.25 mm i.d., film thickness 0.25 μm), respectively. Refer to Dong et al. (2015) for the detailed operation process. Secondly, the extracted samples were demineralized with acid (e.g., HCl and HF) to separate kerogen. Elemental composition analysis for kerogen was performed on a VARIOEL III instrument. Stable carbon isotope of kerogen was determined using a DELTA-PLUS-XL apparatus, and then the result was reported relative to PDB standard (Coplen, 2011).

    Well JJ7-1 (a pseudo well) in the center of Jiaojiang sag is selected to accurately investigate hydrocarbon generation potential of source rocks through reconstructing burial, thermal, maturity and hydrocarbon generation histories with BasinMod 1D (Version 7.61) software from Platte River company of the United States. Stratigraphic horizon, deposition and erosion age involved in the model construction are shown in Table 1. The key geological parameters required for the basin modeling are lithology, source rock properties, boundary conditions and eroded thickness (Hakimi and Abdullah, 2015). For low-explored area with minor measured geological data, reasonably selecting geological parameters is the key to give reliable modeling results. Lithology and geochemical parameters (e.g., TOC, HI and kerogen type) of Well JJ7-1 are analogized using data from surrounding wells. The boundary conditions are specifically paleo-heat flow, paleo-water depth and paleo-sedimentary water interface temperature, while paleo-heat flow is the most important parameter affecting modeled thermal, maturity and hydrocarbon generation histories (Yu et al., 2020; Gottardi et al., 2019). Its reconstruction process can be summarized as: estimating heat flow value based on tectonic evolution, modifying value until calculated vitrinite reflectance datas (BASIN %Ro) well matching with measured datas (Hakimi et al., 2018; Makeen et al., 2016). However, it is a challenging task for determining the heat flow value of Well JJ7-1 due to lacking of measured vitrinite reflectance data in the center of Jiaojiang sag. Heat flow in the sag center is typically lower than that in the surrounding uplift (Wang et al., 2000; Kutas, 1984), resulting in an over-estimation of source rock thermal maturity by using measured vitrinite reflectance data of uplift to calibrate the heat flow of Well JJ7-1. Hence, predicted vitrinite reflectance data in the center of Jiaojiang sag published by Tong et al. (2012) can be used as calibration data, and then the heat flow value of Well JJ7-1 is calculated to be 48.3 mW/m2. The paleo-water depth was derived from the Cenozoic sea level variation of the ECSB published by Wu et al. (1998), which varied between 0 and 120 m. The paleo-sedimentary water interface temperature was acquired according to the global average temperature at sea level (Wygrala, 1989), which was in a range of 18–25 ℃. Jiaojiang sag also experienced multiple intensive uplifts during geological history, e.g., Oujiang orogenesis at the end of Paleocene, Yuquan orogenesis at the end of Eocene, Huagang orogenesis at the end of Oligocene and Longjing orogenesis at the end of Miocene (Jiang et al., 2015), while two primary erosion events, Oujiang and Yuquan orogenesis, were considered in this model. The estimated eroded thickness for the Oujiang and Yuquan orogensis in the Jiaojiang sag are 800–1 000 and 500–600 m, respectively (Li et al., 2015). In addition, mechanical compaction model was used to simulate burial history, transient heat flow model was used to model thermal history, Easy% Ro model proposed by Sweeney and Burnham (1990) and chemical kinetic model proposed by Behar et al. (1997) were utilized to determine thermal history and hydrocarbon generation history, respectively.

    Table  1.  The key geological parameters used to reconstruct hydrocarbons generation history for Well JJ7-1
    Fm. Top (m) Bottom (m) Thickness (m) Deposition age (Ma) Erosion age (Ma) Erosion thickness (m) Lithology (%) Source rock properties
    From To From To Sand. Silt. Mud. TOC (%) HI (mg/g) Kerogen type
    Qd 83 488 405 2.6 0 18.9 23.5 57.6
    N2 488 857 369 5.3 2.6 38.4 17.9 43.7
    N1 857 1 302 445 23.3 5.3 56.8 14.4 28.8 0.4 46 Type Ⅲ
    E2p 41.2 36.0 36.0 23.3 600 57.2 16.6 26.2 0.2 23 Type Ⅲ
    E2w 1 302 1 863 561 47.8 41.2 35.9 45.4 18.7 0.3 35 Type Ⅲ
    E2o 1 863 2 498 635 54.5 47.8 34.2 20.7 45.1 0.4 42 Type Ⅲ
    E1m 2 498 3 994 1 496 58.5 55.0 55.0 54.5 800 17.6 35.6 46.8 0.9 77 Type Ⅲ
    E1l 3 994 5 322 1 328 61.0 58.5 3.8 11.5 84.7 2.5 324 Type Ⅱ
    E1y 5 322 6 342 1 020 66.5 61.0 23.0 9.2 67.8 2.3 312 Type Ⅱ
    Geological time scales are from Cohen et al. (2013); the top and bottom depths of strata units are determined from seismic data in combination with time-depth relationship data. Sand. Sandstone; Silt. siltstone; Mud. mudstone.
     | Show Table
    DownLoad: CSV

    Organic matter in source rocks is material supplier for hydrocarbon generation, which determines oil and gas resource potential (Peters, 2005). TOC in the E1y mudstone ranges from 1.86 wt.% to 2.65 wt.% with average value of 2.31 wt.%, while S1 + S2 varies between 3.20 and 9.46 mg/g with average value of 7.46 mg/g. TOC in the E1l mudstone ranges from 2.13 wt.% to 3.75 wt.% with average value of 2.82 wt.%, while S1 + S2 is in a range of 5.04–15.29 mg/g with average value of 9.76 mg/g. E1m mudstone is low in TOC with a range of 0.34 wt.%–2.49 wt.% and average value of 0.97 wt.%, and S1 + S2 varies between 0.30 and 4.21 mg/g with average value of 1.09 mg/g. However, E1m carbonaceous mudstone and coal measures are abundant in organic matter with TOC of 8.66 wt.%–63.24 wt.% and S1 + S2 of 8.17–90.43 mg/g. Given multiple source rock types in the Jiaojiang sag, hydrocarbon generation capacity of the E1y and E1l is determined based on organic matter abundance evaluation criterion of lacustrine source rock, while that of the E1m is evaluated according to organic matter abundance evaluation criterion of coal-measure source rock (Chen et al., 1997). Results show that E1y and E1l mudstones are high-quality source rocks with high hydrocarbon generation capacity (Figure 3a), while most E1m mudstone is poor source rock with low hydrocarbon generation capacity (Figure 3b). It should be pointed out that, although higher than that of mudstone, the hydrocarbon generation potential of carbonaceous mudstone and coal in the E1m Formation is much lower than that of Jurassic coal (S1 + S2 values up to 238 mg/g) in Northwest China and Carboniferous–Permian coal (S1 + S2 values up to 260 mg/g) in North China (Zhao et al., 2018; Chen et al., 1997). Furthermore, strong hydrocarbon adsorption caused by high organic matter content in coal measures hinders oil expulsion from themselves. Therefore, E1m carbonaceous mudstone and coal in the Jiaojiang sag cannot act as oil source, but can be good gas source at high maturity stage.

    Figure  3.  Variation of TOC values with S1 + S2 values (a), (b) and HI values with Tmax values (c) for the E1y, E1l and E1m samples in the Jiaojiang sag. Classifications of organic matter type are from van Krevelen (1993).

    Kerogen type is an important parameter to measure source rock quality, since hydrocarbon generation potential and products vary greatly with kerogen type. According to hydrogen indexs (HIs), Peters and Moldowan (1991) classified kerogen at Ro of 0.6% into three types, i.e., Type I or oil-prone with hydrogen indexs > 300 mg/g, Type II or oil/gas-prone with hydrogen indexs of 200–300 mg/g, Type III or gas-prone with hydrogen indexs of 50–200 mg/g. HIs of the E1y, E1l and E1m samples range from 159–344, 184–394 and 31–209 mg/g (Figure 3c), respectively, indicating that organic matter in the E1y and E1l are typical Type II kerogen and the E1m is dominated by Type III kerogen with certain proportion of Type II-III kerogen. In other words, the E1y and E1l can generate both oil and gas, while the E1m has certain gas generation capacity at high maturation stage.

    Thermal maturity can be utilized to express transformation degree of organic matter into hydrocarbon (Bechtel et al., 2012). Measured Ro values are in a range of 0.43%–0.64% (averaging 0.53%), with corresponding Tmax values of 415–443 ℃ (averaging 433 ℃), indicating that E1y, E1l and E1m source rocks in the Jiaojiang sag are generally immature to low mature. Obviously, E1y, E1l and E1m source rocks have not yet considerably transformed into liquid hydrocarbon. Importantly, shallow buried depth and no significant variation in thermal evolution greatly limit their hydrocarbon generation capacity, since all samples are located in the uplift or the sag edge. Source rocks in the center of Jiaojiang sag with larger buried depth are speculated to be at higher thermal maturity stage.

    Elemental composition of kerogen, e.g., carbon (C), hydrogen (H), oxygen (O) and nitrogen (N) can be applied to decipher original organic matter origin. Hunt (1991) and Powell (1988) regarded H/C atomic ratios of 0.8–0.9 as the floor level for liquid hydrocarbon potential. As shown in Table 2, H/C atomic ratios of the E1y, E1l and E1m samples vary in a range of 0.93–1.04, 1.11–1.14 and 0.69–0.76, respectively. Thus, organic matter in the E1y and E1l formations seem to be more oil prone compared with the E1m Formation. O/C atomic ratios of the E1y, E1l and E1m samples are in a range of 0.08–0.10, 0.08–0.10 and 0.11–0.28, respectively. Based on the van Krevelen diagram, the E1y and E1l samples fall within Type II kerogen region, while the E1m samples fall within Type III kerogen region (Figure 4).

    Table  2.  Elemental composition and stable carbon isotope of kerogen as well as vitrinite reflectance for the E1y, E1l and E1m samples in the Jiaojiang sag
    Well Depth (m) Fm. Ro (%) Elemental composition of kerogen δ13C value of the kerogens (‰, PDB)
    N (%) C (%) H (%) O (%) N/C H/C O/C
    JJ4-1 2 412–2 433 E1y 0.47 2.28 66.11 5.74 7.49 0.03 1.04 0.08 -27.2
    JJ4-1 2 505–2 508 E1y 0.58 2.05 65.63 5.06 8.59 0.03 0.93 0.10 -26.3
    JJ4-1 2 550–2 565 E1y 0.55 2.32 68.19 5.43 8.94 0.03 0.96 0.10 -26.2
    JJ4-1 2 286–2 289 E1l 0.44 1.54 45.93 4.23 5.86 0.03 1.11 0.10 -25.8
    JJ4-1 2 319–2 328 E1l 0.43 2.09 63.38 6.03 6.81 0.03 1.14 0.08 -26.2
    JJ4-1 2 361–2 364 E1l 0.52 2.30 68.30 6.35 8.17 0.03 1.12 0.09 -26.4
    JJ6-1 2 760–2 780 E1m 0.48 1.35 66.73 4.04 17.32 0.02 0.73 0.19 -25.6
    JJ6-1 2 860–2 875 E1m 0.52 1.53 65.10 3.72 24.63 0.02 0.69 0.28 -25.0
    JJ6-1 3 085–3 100 E1m 0.59 1.72 70.62 4.47 13.03 0.02 0.76 0.14 -25.7
    JJ6-1 3 154 E1m 0.62 1.80 72.49 4.18 10.29 0.02 0.69 0.11 -25.0
    JJ6-1 3 184–3 199 E1m 0.64 1.37 69.50 4.22 15.01 0.02 0.73 0.16 -25.3
     | Show Table
    DownLoad: CSV
    Figure  4.  Variation of H/C atomic ratios with O/C atomic ratios of kerogen for the E1y, E1l and E1m samples in the Jiaojiang sag.

    δ13C values of kerogen in the E1y, E1l and E1m samples range from -26.2‰ to -27.2‰, -25.8‰ to -26.4‰ and -25.0‰ to -25.7‰, averaging of -26.6‰, -26.1‰ and -25.3‰ (Table 2), respectively. Schoell (1984) reported that carbon isotopic composition of kerogen is mainly dominated by biological source, where light δ13C value represents aquatic organism source, and heavy δ13C value means terricolous organism source. In general, Type I kerogen has δ13C value fewer than -27.5‰, Type II kerogen between -27.5‰ and -26.0‰, and Type III kerogen has δ13C value more than -26.0‰. According to this criterion, E1y and E1l mudstones should contain Type II kerogen, and E1m mudstones with somewhat heavy isotopes have Type III kerogen. Obviously, this conclusion is in agreement with interpreted kerogen type from HI values as well as cross-plot of H/C and O/C atomic ratios.

    The identified n-alkanes in most mudstone samples of Jiaojiang sag is dominated by C13–C36 (Figure 5). The distribution pattern of n-alkanes is a good indicator of organic matter source (Sachsenhofer et al., 2017). For immature to low mature samples, low carbon number components (< nC20) are dominant in n-alkanes from algae and microorganisms, and high-carbon number components (> nC25) are dominant in n-alkanes from terrestrial higher plants (Volkman et al., 1990). The carbon number of n-alkanes in the E1y and E1l samples is distributed in unimodal pattern with the max peak at C23 and/or C27, and the abundance of n-alkanes with low carbon number and high carbon number is similar (represented by moderate C21-/C22+ ratio, Table 3), which indicates that organic matter was sourced from both aquatic organisms and terrestrial higher plants. The carbon number of n-alkanes in the E1m sample is distributed in asymmetric bimodal pattern with the max peak at C27, where the abundance of n-alkanes with high carbon number significantly increases (represented by low C21-/C22+ ratio, Table 3), indicating considerable terrestrial higher plants input. Furthermore, all analyzed samples have high CPI and OEP values, ranging of 1.39–1.90 and 1.18–1.84 (Table 3), respectively, which further confirms immature to low mature organic matter.

    Figure  5.  M/z 191 and m/z 217 mass chromatograms of saturate hydrocarbon for the E1y, E1l and E1m samples in the Jiaojiang sag.
    Table  3.  Biomarker compound parameters for the E1y, E1l and E1m samples in the Jiaojiang sag
    Well Depth (m) Fm. n-alkanes and isoprenoids Terpanes (m/z = 191) Steranes (m/z = 217)
    Tricyclic terpanes Hopane terpanes Regular steranes (%) C2920S
    /(20R+20S)
    C29ββ
    /(αα+ββ)
    Diasteranes/steranes
    Pr/Ph Pr/nC17 Ph/nC18 MP CPI OEP C21-/C22+ TiC19/TiC23 TiC20/TiC23 TeC24/TiC26 C29/C30 Gam/C30 O/C30 Ts/Tm C27 C28 C29
    JJ4-1 2 412–2 433 E1y 2.01 1.97 1.16 C27 1.48 1.30 0.62 0.42 0.97 1.03 0.52 0.12 0.01 0.53 19 24 57 0.13 0.17 0.19
    JJ4-1 2 505–2 508 E1y 2.32 1.67 0.69 C23 1.39 1.18 0.56 0.52 0.98 1.29 0.53 0.12 0.02 0.45 22 23 55 0.17 0.18 0.22
    JJ4-1 2 550–2 565 E1y 1.39 2.01 1.29 C23 1.45 1.19 0.68 0.48 1.03 0.98 0.45 0.11 0.01 0.48 24 25 51 0.12 0.19 0.27
    JJ4-1 2 286–2 289 E1l 1.51 3.12 2.40 C27 1.90 1.80 0.59 0.27 0.83 0.84 0.35 0.09 0.01 0.66 27 24 50 0.06 0.18 0.23
    JJ4-1 2 319–2 328 E1l 1.86 3.10 1.79 C27 1.77 1.84 0.49 0.44 1.01 1.00 0.36 0.07 0.01 0.62 26 22 51 0.11 0.18 0.26
    JJ4-1 2 361–2 364 E1l 1.65 2.54 1.55 C27 1.65 1.60 0.51 0.43 1.10 0.86 0.44 0.09 / 0.57 22 22 56 0.13 0.18 0.27
    JJ6-1 2 760–2 780 E1m 9.53 7.89 0.87 C27 1.78 1.61 0.33 7.39 4.06 3.85 0.63 0.04 0.04 0.05 10 15 75 0.11 0.27 0.33
    JJ6-1 2 860–2 875 E1m 4.71 4.37 0.98 C27 1.76 1.64 0.36 7.35 6.42 4.84 0.66 0.04 0.02 0.07 7 16 77 0.15 0.29 0.49
    JJ6-1 3 085–3 100 E1m 5.92 7.52 1.31 C27 1.47 1.35 0.33 27.63 6.38 / 0.70 0.02 0.05 0.07 5 14 81 0.26 0.29 0.53
    JJ6-1 3154 E1m 5.23 7.93 1.37 C27 1.57 1.43 0.36 6.10 2.89 1.96 0.59 0.02 0.30 0.06 14 9 77 0.31 0.30 0.66
    JJ6-1 3 184–3 199 E1m 8.65 8.47 0.94 C27 1.64 1.49 0.26 10.57 4.63 7.31 0.68 0.02 0.07 0.07 7 16 77 0.20 0.29 0.46
    MP. Max PeakCPI. Carbon Preference Index (2[C23 + C25 + C27 + C29]/[C22 + 2{C24 + C26 + C28} + C30]); OEP. Odd-Even Predominance ([C25 + C27 + C29]/2[C26 + C28]); C29/C30. C29-norhopane/C30-hopane; Gam/C30. Gammacerane/C30-hopane; O/C30. Oleanane/C30-hopane; Diasteranes/steranes. C29Diasteranes/C29 regular steranes
     | Show Table
    DownLoad: CSV

    Pristane (Pr) as well as phytane (Ph), most common acyclic isoprenoids in source rocks, are primary parameters to indicate deposition environment (Chandra et al., 1994; Ten Haven et al., 1987). This is achieved by Pr/Ph ratio, e.g., low Pr/Ph ratio (< 1.0) indicates reductive environment, moderate Pr/Ph ratio (1.0–3.0) represents weak-reducing to weak-oxidizing environment, and high Pr/Ph ratio (> 3.0) suggests oxidizing environment (Didyk et al., 1978). The influence of maturity on Pr/Ph ratio can be excluded, since samples analyzed in this paper are mainly immature and low mature (Koopmans et al., 1999). In the Figure 5, considerable Pr and Ph generally appear in all samples, higher than adjacent normal alkanes, with both Pr/nC17 and Ph/nC18 ratios greater than 1.0 (Table 3). In addition, Pr is much higher in concentration compared to Ph in the E1y, E1l and E1m samples, with Pr/Ph ratios in the range of 1.39–2.32, 1.51–1.86 and 4.71–9.53, respectively. The moderate Pr/Ph ratios in the E1y and E1l and high Pr/Ph ratios in the E1m indicate that sub-reducing condition extensively appeared in the bottom water during the E1y and E1l periods, whereas oxidizing conditions appeared during the E1m period. Furthermore, the variation of Pr/nC17 versus Ph/nC18 is also utilized to explain organic matter origin and deposition environment (Moldwan et al., 1985; Shanmugam, 1985). As shown in Figure 6a, most E1y and E1l samples are characterized by mixed organic matter input at weak-reducing to weak-oxidizing environment, while the E1m samples are sourced from terrestrial organic matter at oxidizing environment.

    Besides C27, C28, C29 regular steranes, 4-methylsterane can be detected from m/z 217 GC/MS, which provides evidence for identifying organic matter origin. Although regular steranes and 4-methylsteranes have various sources, C27 regular steranes are mainly sourced from aquatic organisms, C29 regular steranes are primarily originated from terrestrial higher plants, and 4-methylsteranes are derived from bacteria and/or algae (Farhaduzzaman et al., 2012; Peters et al., 2005; Volkman, 1986). The relative C27, C28, C29 regular steranes contents of the E1y and E1l samples are mainly distributed in "V" shape (Figures 5a5b), which are in a range of 19.3%–24.3%, 23.2%–24.6%, 51.2%–56.7% and 22.1%–26.8%, 21.6%–23.5%, 49.7%–56.4%, respectively, indicating that organic matter was primarily sourced from terrestrial higher plants with aquatic organisms of different proportions. The relative C27 and C28 regular steranes contents in the E1m samples are in a range of 5.2%–14.3% and 8.5%–16.3%, while C29 regular steranes has highest content ranging from 74.8% to 81.2%. Typical inverted "L" shape in the E1m samples indicates considerable terrestrial organic matter input (Figure 5c). In addition, 4-methylsterane only occurs in the E1y and E1l samples, which further confirms the contributions of aquatic organic matter.

    The isomerization of sterane have the potential to describe thermal maturity of organic matter. Previous studies show that increasing thermal maturity can convert unstable "R" shape of sterane into stable "S" shape and transform unstable αα configuration to stable ββ configuration (Hanson, 2000). Therefore, the C29 sterane 20S/(S + R) and C29 sterane ββ/(ββ + αα) will increase with increasing thermal maturity (Seifert and Moldowan, 1986), with suggested thermodynamic equilibrium mixture at 0.52–0.55 and 0.67–0.71, respectively. The steranes of all analyzed samples in the Jiaojiang sag is lowly isomerized with above two parameters lower than 0.31 and 0.30 (Figure 6b), respectively, suggesting that organic matter in the E1y, E1l and E1m samples is present in immature to low-mature stage. This result is consistent with conclusions from measured Ro, Tmax, CPI and OEP values.

    Figure  6.  Correlation between various biomarker parameters for the E1y, E1l and E1m samples in the Jiaojiang sag, displaying original organic matter input, thermal maturity and deposition environment.

    Terpanes, e.g., C27-18a(H)-tris-norneohopane (Ts), C27-17a(H)-tris-norhopane (Tm), C29-norhopane, C30-hopane, (C31–C35)-homohopane, gammacerane, minor (C19–C26)-tricyclic terpane and C24-tetracyclic terpane, etc., can be detected from m/z 191 GC/MS. C30-hopane peak is significantly greater than C29-norhopane peak in the E1y, E1l and E1m samples, with C29/C30-hopane ratios of 0.45–0.53, 0.35–0.44 and 0.59–0.68, respectively (Figure 6c). The relative content of homohopane is positive sequence, i.e., C31-homohopane > C32-homohopane > C33-homohopane > C34-homohopane > C35-homohopane, where the content of C34-homohopane and C35-homohopane are extremely low, also indicating suboxic deposition environment (Peters and Moldowan, 1991).

    The contents of Ts and Tm vary as a function of lithology, kerogen type and thermal maturity (Moldowan et al., 1985; Seifert and Moldowan, 1978). All analyzed samples are lower in Ts content compared with Tm content, with Ts/Tm ratios lower than 0.7, especially for the E1m samples, where ratios are all lower than 0.1 (Figure 6c). This may be explained by the limited catalytic reaction of clay in coal-measure strata (Moldowan et al., 1986). Gammacerane, an important biomarker, originated from tetrahymanol reduction (Damsté et al., 1995). Previous studies suggested that high gammacerane concentration was associated with high water salinity and commonly occurred in deposits derived from stable marine and lacustrine environment with a stratified water column (Hakimi et al., 2016; Sepúlveda et al., 2009; Ten Haven et al., 1989). As illustrated in Figure 5, this compound is commonly observed in all analyzed samples. Gammacerane index, expressed as Gammacerane/C30-hopane, in the E1y, E1l and E1m samples are 0.11–0.12 (averaging 0.11), 0.07–0.09 (averaging 0.08) and 0.02–0.04 (averaging 0.03), respectively, implying that the stability of water stratification was weakened correspondingly. Furthermore, samples with high Gammacerane indexs commonly have low Pr/Ph ratios, while samples with lower Gammacerane indexs generally have high Pr/Ph ratios (Figure 6d), which indicates that water stratification is responsible for reducing environment.

    Tricyclic terpane and tetracyclic terpane are another important biomarkers representing terrestrial organic matter input (Adegoke et al., 2015; Hao et al., 2011), e.g., higher C19 tricyclic terpane/C23 tricyclic terpane (TiC19/TiC23), C20 tricyclic terpane/C23 tricyclic terpane (TiC20/TiC23) and C24 tetracyclic terpane/C26 tricyclic terpane (TeC24/TiC26) generally indicate high terrestrial organic matter input. As expected, the E1y and E1l samples are characterized by low TiC19/TiC23, TiC20/TiC23, TeC24/TiC26, e.g., values in the E1y are 0.42–0.52, 0.97–1.03, 0.98–1.29, respectively, and values in the E1l are 0.27–0.44, 0.83–1.10, 0.84–1.01 (Figures 6e6f), respectively. In contrast, the E1m samples are characterized by high TiC19/TiC23, TiC20/TiC23, TeC24/TiC26, which are 6.10–27.63, 2.89–6.42, 1.96–7.31, respectively. This means that the E1m Formation has more terrestrial organic matter input than the E1y and E1l formations, which agrees well with the conclusions from the distribution pattern of n-alkanes and the relative content of C27–C29 regular steranes.

    The burial and subsidence histories of Well JJ7-1 are shown in Figure 7. Modeled burial and subsidence histories show that Jiaojiang sag experienced multiple alternated subsidence and uplift in geological history. An initial subsidence occurred during the Paleocene with a subsidence rate of 320 m/Ma and residual thickness of 3 840 m. This rapid subsidence rate was developed in response to the intensive tectonic subsidence during syn-rifting phase. Oujiang orogenesis in later stage uplifted and strongly eroded strata with eroded thickness of 800 m. Subsidence rate decreased to 90 m/Ma in the Eocene with residual thickness of 1 190 m. Uplift event occurred again due to Yuquan orogenesis at the end of Eocene and Huagang orogenesis at the end of Oligocene, eroding the Eocene Pinghu Formation with eroded thickness of 600 m. The subsidence was smooth in the Miocene with subsidence rate of 25 m/Ma and residual thickness of 450 m. The subsidence rate increased to 145 m/Ma from the Pliocene to Quaternary with residual thickness of 770 m. The current burial depth of each formation is the maximum one in geological history.

    Figure  7.  Calibration of thermal and maturity models (a), and thermal evolution history (b) for 1-D model constructed in Well JJ7-1.

    Abdalla et al. (1999) regarded that current heat flow can be estimated by thermal conductivity of rocks in combination with geothermal gradient that can be derived from corrected bottom-hole temperature. The calculated geothermal gradient value in the center of Jiaojiang sag is 2.6 ℃/100 m, which is lower than 3.0 ℃/100 m in the uplift (Yang et al., 2004). Therefore, the current heat flow value of Well JJ7-1 is calculated to be 48.3 mW/m2 based on transient heat flow model in BasinMod 1D software. Furthermore, "Instantaneous Uniform Extension Model" proposed by McKenzie (1978) was used to assess paleo-heat flows in different geological periods based on the tectonic evolution in the Jiaojiang sag. It was corrected based on calculated vitrinite reflectance (solid line) and calibration data (circle symbols), which agrees well in Figure 7a. Also, the calculated formation temperature (dotted line) in Well JJ7-1 matches well with the calibration data (box symbols), indicating reasonable paleo-heat flow model in this research. The results show that the highest paleo-heat flow in the Jiaojiang sag occurred in the Paleocene with value of 74.2 mW/m2. It began to decay since the Early Eocene, and decreased to 44.8 mW/m2 at the end of Miocene, which increased slightly and generally maintained between 46.0 and 48.3 mW/m2 from the Pliocene to Quaternary.

    The established paleo-heat flows were employed to reconstruct thermal evolution of source rocks in Well JJ7-1, which can dynamically show thermal maturity in different geological periods in the Jiaojiang sag (Figure 7b). Significant subsidence and high paleo-heat flow during the Paleocene to Eocene contributed to the increased thermal maturity of the Paleocene source rocks. Specifically, E1y source rock entered early maturation stage (0.5%–0.7% Ro) and Middle maturation stage (0.7%–1.0% Ro) successively in the Middle Paleocene, and then entered late maturation stage (1.0%–1.3% Ro) in the Late Paleocene and high maturation stage (1.3%–2.0% Ro) in the Middle to Late Eocene, respectively, which did not change further. E1l source rock was low mature and middle mature in the Late Paleocene and was late mature in the Middle Eocene, which have not entered high maturation stage up to now. E1m source rock had been in the early maturation stage since the Middle Eocene. Obviously, the thermal maturities of all source rocks in the Jiaojiang sag were unchangeable at the end of Eocene, which can be attributed to tectonic uplift from the end of Eocene to the end of Oligocene and decreased geotemperature in the Neogene.

    Hydrocarbon generation history of the Paleocene source rocks in the Jiaojiang sag was reconstructed based on modeled burial and maturity histories to exhibit hydrocarbon generation process and intensity. As mentioned above, Jiaojiang sag had experienced multiple burial and uplift events. The first burial event lasted to the end of Paleocene, while the maximum buried depth of E1y source rock was 4 000–4 950 m after adequate sedimentary compensation, with corresponding Ro value of 0.7%–1.3%. It gave rise to the first hydrocarbon generation, with generated oil and gas volume of 261 and 52 mg/g, respectively. However, the uplift due to Oujiang orogenesis at the end of Paleocene stopped hydrocarbon generation, which was followed by the second burial event in the Eocene. The maximum buried depth of E1y source rock was 4 900–5 850 m, with corresponding Ro value of 1.3%–2.0%. The second hydrocarbon generation occurred as response to temperature exceeding the maximum value of the first burial event, however, only gas was generated with generated gas volume of 50 mg/g. E1y source rock did not generate further hydrocarbon after that (Figure 8a). Similarly, E1l source rock also experienced two hydrocarbon generation events, specifically, the first occurred in the Late Paleocene with generated oil and gas volume of 142 and 25 mg/g, respectively. The second occurred from the Middle to Late Eocene, with generated oil and gas volume of 130 and 31 mg/g, respectively (Figure 8b). E1m source rock only experienced one hydrocarbon generation event in the Late Eocene. It has not yet begun to transform into hydrocarbon significantly owing to the low maturation stage, with generated oil and gas volume of 19 and 5 mg/g, respectively (Figure 8c). Therefore, the E1m Formation should be regarded as an important reservoir (Cai et al., 2016), rather than source rock.

    Figure  8.  Relationship between the oil-gas generation and geological time of E1y, E1l and E1m source rocks in Well JJ7-1.

    Summarily, E1y and E1l source rocks in the Jiaojiang sag have high hydrocarbon generation capacity, which brings confidence to oil-gas exploration activities. Tong et al. (2012) proposed that drilling failure of wells JJ2-1, JJ5-1 and JJ6-1 could be attributed to their locating at ends of the long axis of the sag and slope zone of fault terrace, where were not the favorable direction of hydrocarbon accumulation. The central uplift belt is regarded as favorable oil and gas accumulation region. However, the failure of wells JJ3-1 and JJ4-1 in the central uplift can be explained by the trap failure and poor reservoir quality (Tong et al., 2012). Therefore, the future oil-gas exploration in the Jiaojiang sag should focus on hydrocarbon generation center and select targets in the central uplift formed before the Miocene with high-quality traps.

    The Paleocene E1y, E1l and E1m formations are three potential source rocks in the Jiaojiang sag. Hydrocarbon generation capacity and process were studied based on geochemical analysis and basin modeling. Conclusions are as follows.

    (1) E1y and E1l mudstones are high-quality source rocks with high TOC content and Type II kerogen, which are characterized by high thermal maturity. In contrast, E1m mudstone is poor-quality source rock with low TOC content and Type III kerogen, which is characterized by low thermal maturity. Obviously, hydrocarbon generation capacity of E1y and E1l source rocks is higher than that of E1m source rock.

    (2) Differences in hydrocarbon generation capacity of these three source rocks are associated with organic matter type and preservation/degradation. As indicated by biomarkers, organic matter in the E1y and E1l was sourced from both aquatic organisms and terrestrial higher plants deposited in sub-reducing environment, whereas that in the E1m was originated from terrestrial higher plants deposited in oxidizing environment.

    (3) Basin modeling suggests that the hydrocarbon generation process of the Paleocene source rocks primarily occurred from the Late Paleocene to Eocene. The future oil-gas exploration in the Jiaojiang sag should focus on hydrocarbon generation center and select targets in the central uplift formed before the Miocene with high-quality traps.

    ACKNOWLEDGMENTS: This work was supported by the China National Science and Technology Major Project (Nos. 2016ZX05024-002-003, 2017ZX05032-001-004), the Foundation of Key Laboratory of Tectonics and Petroleum Resources of Ministry of Education (China University of Geosciences), China (Nos. TPR-2022-11, TPR-2022-24), and the Science and Technology Planning Project of Tangshan City, China (Nos. 22130213H). The authors thank the CNOOC Research Institute Ltd for kindly supplying part of the data in this research. The final publication is available at Springer via https://doi.org/10.1007/s12583-021-1528-6.
  • Abdalla, Y. M., Michael, J. P., William, A. A., et al., 1999. Modeling Petroleum Generation in the Southern Muglad Rift Basin, Sudan1. AAPG Bulletin, 83: 1943–1964. https://doi.org/10.1306/e4fd464d-1732-11d7-8645000102c1865d
    Adegoke, A. K., Abdullah, W. H., Hakimi, M. H., et al., 2015. Geochemical Characterisation and Organic Matter Enrichment of Upper Cretaceous Gongila Shales from Chad (Bornu) Basin, Northeastern Nigeria: Bioproductivity Versus Anoxia Conditions. Journal of Petroleum Science and Engineering, 135: 73–87. https://doi.org/10.1016/j.petrol.2015.08.012
    Bechtel, A., Jia, J. L., Strobl, S. A. I., et al., 2012. Palaeoenvironmental Conditions during Deposition of the Upper Cretaceous Oil Shale Sequences in the Songliao Basin (NE China): Implications from Geochemical Analysis. Organic Geochemistry, 46: 76–95. https://doi.org/10.1016/j.orggeochem.2012.02.003
    Behar, F., Vandenbroucke, M., Tang, Y., et al., 1997. Thermal Cracking of Kerogen in Open and Closed Systems: Determination of Kinetic Parameters and Stoichiometric Coefficients for Oil and Gas Generation. Organic Geochemistry, 26(5/6): 321–339. https://doi.org/10.1016/s0146-6380(97)00014-4
    Cai, J., Qi, P., Cui, M., et al., 2016. Well Analysis of Information from Drilled Wells and Revelation to Oil & Gas Exploration in Jiaojiang Sag. Offshore Oil, 36(4): 33–39 (in Chinese with English Abstract)
    Chandra, K., Mishra, C. S., Samanta, U., et al., 1994. Correlation of Different Maturity Parameters in the Ahmedabad-Mehsana Block of the Cambay Basin. Organic Geochemistry, 21(3/4): 313–321. https://doi.org/10.1016/0146-6380(94)90193-7
    Chen, C. F., Zhu, W. L., Fu, X. W., et al., 2017. Provenance Change and Its Influence in Late Paleocene, Jiaojiang Sag, East China Sea Shelf Basin. Journal of Tongji University (Natural Science), 45(10): 1522–1530, 1548 (in Chinese with English Abstract)
    Chen, J. P., Zhao, C. Y., He, Z. H., 1997. Criteria for Evaluating the Hydrocarbon Generating Potential of Organic Matter in Coal Measures. Petroleum Exploration and Development, 24(1): 1–5, 91 (in Chinese with English Abstract)
    Cohen, K. M., Finney, S. C., Gibbard, P. L., et al., 2013. The ICS International Chronostratigraphic Chart. Episodes, 36(3): 199–204. https://doi.org/10.18814/epiiugs/2013/v36i3/002
    Coplen, T. B., 2011. Guidelines and Recommended Terms for Expression of Stable-Isotope-Ratio and Gas-Ratio Measurement Results. Rapid Communications in Mass Spectrometry, 25(17): 2538–2560. https://doi.org/10.1002/rcm.5129
    Damsté, J. S. S., Kenig, F., Koopmans, M. P., et al., 1995. Evidence for Gammacerane as an Indicator of Water Column Stratification. Geochimica et Cosmochimica Acta, 59(9): 1895–1900. https://doi.org/10.1016/0016-7037(95)00073-9
    Didyk, B. M., Simoneit, B. R. T., Brassell, S. C., et al., 1978. Organic Geochemical Indicators of Palaeoenvironmental Conditions of Sedimentation. Nature, 272(5650): 216–222. https://doi.org/10.1038/272216a0
    Dong, T., He, S., Yin, S. Y., et al., 2015. Geochemical Characterization of Source Rocks and Crude Oils in the Upper Cretaceous Qingshankou Formation, Changling Sag, Southern Songliao Basin. Marine and Petroleum Geology, 64: 173–188. https://doi.org/10.1016/j.marpetgeo.2015.03.001
    Farhaduzzaman, M., Abdullah, W. H., Islam, M. A., 2012. Depositional Environment and Hydrocarbon Source Potential of the Permian Gondwana Coals from the Barapukuria Basin, Northwest Bangladesh. International Journal of Coal Geology, 90/91: 162–179. https://doi.org/10.1016/j.coal.2011.12.006
    Gao, S. L., Zhao, H., Wang, J. Q., et al., 2019. Zircon U-Pb Dating and Its Significance in Jiaojiang Sag, East China Sea Basin. Petroleum Geology & Experiment, 41: 311–318 (in Chinese with English Abstract)
    Gottardi, R., Adams, L. M., Borrok, D., et al., 2019. Hydrocarbon Source Rock Characterization, Burial History, and Thermal Maturity of the Steele, Niobrara and Mowry Formations at Teapot Dome, Wyoming. Marine and Petroleum Geology, 100: 326–340. https://doi.org/10.1016/j.marpetgeo.2018.11.012
    Hakimi, M. H., Abdullah, W. H., 2015. Thermal Maturity History and Petroleum Generation Modelling for the Upper Jurassic Madbi Source Rocks in the Marib-Shabowah Basin, Western Yemen. Marine and Petroleum Geology, 59: 202–216. https://doi.org/10.1016/j.marpetgeo.2014.08.002
    Hakimi, M. H., Abdullah, W. H., Alqudah, M., et al., 2016. Organic Geochemical and Petrographic Characteristics of the Oil Shales in the Lajjun Area, Central Jordan: Origin of Organic Matter Input and Preservation Conditions. Fuel, 181: 34–45. https://doi.org/10.1016/j.fuel.2016.04.070
    Hakimi, M. H., Al-Matary, A. M., Salad Hersi, O., 2018. Burial and Thermal History Reconstruction of the Mukalla-Sayhut Basin in the Gulf of Aden, Yemen: Implications for Hydrocarbon Generation from Paleocene Potential Source Rock. Journal of African Earth Sciences, 144: 59–75. https://doi.org/10.1016/j.jafrearsci.2018.04.005
    Hanson, A. D., Zhang, S. C., Moldowan, J. M., et al., 2000. Molecular Organic Geochemistry of the Tarim Basin, Northwest China. AAPG Bulletin, 84: 1109–1128. https://doi.org/10.1306/a9673c52-1738-11d7-8645000102c1865d
    Hao, F., Zhou, X. H., Zhu, Y. M., et al., 2011. Lacustrine Source Rock Deposition in Response to Co-Evolution of Environments and Organisms Controlled by Tectonic Subsidence and Climate, Bohai Bay Basin, China. Organic Geochemistry, 42(4): 323–339. https://doi.org/10.1016/j.orggeochem.2011.01.010
    Hunt, J. M., 1991. Generation of Gas and Oil from Coal and Other Terrestrial Organic Matter. Organic Geochemistry, 17(6): 673–680. https://doi.org/10.1016/0146-6380(91)90011-8
    Jiang, Z. L., Li, Y. J., Du, H. L., et al., 2015. The Cenozoic Structural Evolution and Its Influences on Gas Accumulation in the Lishui Sag, East China Sea Shelf Basin. Journal of Natural Gas Science and Engineering, 22: 107–118. https://doi.org/10.1016/j.jngse.2014.11.024
    Koopmans, M. P., Rijpstra, W. I. C., Klapwijk, M. M., et al., 1999. A Thermal and Chemical Degradation Approach to Decipher Pristane and Phytane Precursors in Sedimentary Organic Matter. Organic Geochemistry, 30(9): 1089–1104. https://doi.org/10.1016/s0146-6380(99)00088-1
    Kutas, R. I., 1984. Heat Flow, Radiogenic Heat and Crustal Thickness in Southwest U. S. S. R. Tectonophysics, 103(1/2/3/4): 167–174. https://doi.org/10.1016/0040-1951(84)90081-7
    Lei, C., Yin, S. Y., Ye, J. R., et al., 2021. Characteristics and Deposition Models of the Paleocene Source Rocks in the Lishui Sag, East China Sea Shelf Basin: Evidences from Organic and Inorganic Geochemistry. Journal of Petroleum Science and Engineering, 200: 108342. https://doi.org/10.1016/j.petrol.2021.108342
    Li, D. Y., Guo, T. Y., Jiang, X. D., et al., 2015. Erosion Thickness Recovery and Tectonic Evolution Characterization of Southern East China Sea Shelf Basin. Oil & Gas Geology, 36(6): 913–923 (in Chinese with English Abstract)
    Li, Y., Zhang, J. L., Liu, Y., et al., 2019. Organic Geochemistry, Distribution and Hydrocarbon Potential of Source Rocks in the Paleocene, Lishui Sag, East China Sea Shelf Basin. Marine and Petroleum Geology, 107: 382–396. https://doi.org/10.1016/j.marpetgeo.2019.05.025
    Makeen, Y. M., Abdullah, W. H., Pearson, M. J., et al., 2016. Thermal Maturity History and Petroleum Generation Modelling for the Lower Cretaceous Abu Gabra Formation in the Fula Sub-Basin, Muglad Basin, Sudan. Marine and Petroleum Geology, 75: 310–324. https://doi.org/10.1016/j.marpetgeo.2016.04.023
    Mckenzie, D., 1978. Some Remarks on the Development of Sedimentary Basins. Earth and Planetary Science Letters, 40(1): 25–32. https://doi.org/10.1016/0012-821x(78)90071-7
    Moldowan, J. M., Sundararaman, P., Schoell, M., 1986. Sensitivity of Biomarker Properties to Depositional Environment and/or Source Input in the Lower Toarcian of SW-Germany. Organic Geochemistry, 10(4/5/6): 915–926. https://doi.org/10.1016/s0146-6380(86)80029-8
    Moldowan, J. M., Seifert, W. K., Gallegos, E. J., 1985. Relationship between Petroleum Composition and Depositional Environment of Petroleum Source Rocks. AAPG Bulletin, 69: 1255–1268. https://doi.org/10.1306/ad462bc8-16f7-11d7-8645000102c1865d
    Peters, K. E., Moldowan, J. M., 1991. Effects of Source, Thermal Maturity, and Biodegradation on the Distribution and Isomerization of Homohopanes in Petroleum. Organic Geochemistry, 17(1): 47–61. https://doi.org/10.1016/0146-6380(91)90039-m
    Peters, K. E., Walters, C. C., Moldowan, J. M., 2005. The Biomarker Guide Volume 1: Biomarkers and Isotopes in the Environment and Human History. Cambridge University Press, New York
    Powell, T. G., 1988. Development in Concepts of Hydrocarbon Generation from Terrestrial Organic Matter: Petroleum Resources of China and Related Subjects. In: Circum Pacific Council of Energy and Mineral Resources. Earth Science Series, 10: 807–824. https://doi.org/10.1126/science.146.3640.30
    Sachsenhorfer, R. F., Popov, S. V., Akhmetiev, M. A., et al., 2017. The Type Section of the Maikop Group (Oligocene–Lower Miocene) at the Belaya River (North Caucasus): Depositional Environment and Hydrocarbon Potential. AAPG Bulletin, 101(3): 289–319. https://doi.org/10.1306/08051616027
    Schoell, M., 1984. Recent Advances in Petroleum Isotope Geochemistry. Organic Geochemistry, 6: 645–663. https://doi.org/10.1016/0146-6380(84)90086-x
    Seifert, W. K., Michael Moldowan, J., 1978. Applications of Steranes, Terpanes and Monoaromatics to the Maturation, Migration and Source of Crude Oils. Geochimica et Cosmochimica Acta, 42(1): 77–95. https://doi.org/10.1016/0016-7037(78)90219-3
    Seifert, W. K., Moldowan, J. M., 1986. Use of Biological Markers in Petroleum Exploration. Methods in Geochemistry and Geophysics. Elsevier, New York
    Sepúlveda, J., Wendler, J., Leider, A., et al., 2009. Molecular Isotopic Evidence of Environmental and Ecological Changes across the Cenomanian-Turonian Boundary in the Levant Platform of Central Jordan. Organic Geochemistry, 40(5): 553–568. https://doi.org/10.1016/j.orggeochem.2009.02.009
    Shanmugam, G., 1985. Significance of Coniferous Rain Forests and Related Organic Matter in Generatingcommercial Quantities of Oil, Gippsland Basin, Australia. AAPG Bulletin, 69: 1241–1254. https://doi.org/10.1306/ad462bc3-16f7-11d7-8645000102c1865d
    Sweeney, J. J., Burnham, A. K., 1990. Evaluation of a Simple Model of Vitrinite Reflectance Based on Chemical Kinetics (1). AAPG Bulletin, 74: 1559–1570. https://doi.org/10.1306/0c9b251f-1710-11d7-8645000102c1865d
    Ten Haven, H. L., de Leeuw, J. W., Rullkötter, J., et al., 1987. Restricted Utility of the Pristane/Phytane Ratio as a Palaeoenvironmental Indicator. Nature, 330(6149): 641–643. https://doi.org/10.1038/330641a0
    Ten Haven, H. L., Rohmer, M., Rullkötter, J., et al., 1989. Tetrahymanol, the most Likely Precursor of Gammacerane, Occurs Ubiquitously in Marine Sediments. Geochimica et Cosmochimica Acta, 53(11): 3073–3079. https://doi.org/10.1016/0016-7037(89)90186-5
    Tian, B., Li, X. Y., Pang, G. Y., et al., 2012a. Sedimentary Systems of the Superimposed Rift-Subsidence Basin: Taking Lishui-Jiaojiang Sag of the East China Sea as an Example. Acta Sedimentologica Sinica, 30(4): 696–705 (in Chinese with English Abstract)
    Tian, B., Pang, G. Y., Wang, Q., et al., 2012b. Hydrocarbon Accumulation Condition of Superimposed Rift-Subsidence Basin: A Case Study from Lishui-Jiaojiang Sag in the East China Sea. Lithologic Reservoirs, 24: 32–37 (in Chinese with English Abstract)
    Tong, Z. G., Zhao, Z. G., Yang, S. C., et al., 2012. Research on Thermal Evolution and Hydrocarbon Expulsion History of Source Rocks in Low-Exploration Basins: A Case Study on Jiaojiang Sag, East China Sea Basin. Petroleum Geology & Experiment, 34(3): 319–324, 329 (in Chinese with English Abstract)
    van Krevelen, D. W., 1993. Coal: Typology, Physics, Chemistry, Constitution. Elsevier, Amsterdam
    Volkman, J. K., 1986. A Review of Sterol Markers for Marine and Terrigenous Organic Matter. Organic Geochemistry, 9(2): 83–99. https://doi.org/10.1016/0146-6380(86)90089-6
    Volkman, J. K., Kearney, P., Jeffrey, S. W., 1990. A New Source of 4-Methyl Sterols and 5α(H)-Stanols in Sediments: Prymnesiophyte Microalgae of the Genus Pavlova. Organic Geochemistry, 15(5): 489–497. https://doi.org/10.1016/0146-6380(90)90094-g
    Wang, S. J., Hu, S. B., Wang. J. Y., 2000. The Characteristics of Heat Flow and Geothermal Field in Junggar Basin. Chinese Journal of Geophysics, 43(6): 816–824. https://doi.org/10.1002/cjg2.98
    Wu, F. D., Li, S. T., Lu, Y. C., et al., 1998. The Tertiary Sea Level Changes in the East China Sea Shelf Basin. Chinese Journal of Geology (Scientia Geologica Sinica), 33(2): 214–221 (in Chinese with English Abstract)
    Wygrala, B. P., 1989. Integrated Study of an Oil Field in the Southern Po Basin, Northern Italy: [Dissertation]. University of Cologne, Cologne
    Yang, S. C., Hu, S. B., Cai, D. S., et al., 2004. Present-Day Heat Flow, Thermal History and Tectonic Subsidence of the East China Sea Basin. Marine and Petroleum Geology, 21(9): 1095–1105. https://doi.org/10.1016/j.marpetgeo.2004.05.007
    Yu, K., Ju, Y. W., Zhang, B. X., 2020. Modeling of Tectono-Thermal Evolution of Permo-Carboniferous Source Rocks in the Southern Qinshui Basin, China: Consequences for Hydrocarbon Generation. Journal of Petroleum Science and Engineering, 193: 107343. https://doi.org/10.1016/j.petrol.2020.107343
    Zhao, Z. F., Pang, X. Q., Jiang, F. J., et al., 2018. Hydrocarbon Generation from Confined Pyrolysis of Lower Permian Shanxi Formation Coal and Coal Measure Mudstone in the Shenfu Area, Northeastern Ordos Basin, China. Marine and Petroleum Geology, 97: 355–369. https://doi.org/10.1016/j.marpetgeo.2018.07.025
    Zhu, W. L., Zhong, K., Fu, X. W., et al., 2019. The Formation and Evolution of the East China Sea Shelf Basin: A New View. Earth-Science Reviews, 190: 89–111. https://doi.org/10.1016/j.earscirev.2018.12.009
  • Relative Articles

    [1]Lili Gui, Xuesong Lu, Shaobo Liu, Xiaowen Guo, Shihua Yao, Mengzhen Hao, Weiyan Chen, Li Yuan, Chunling Wang, Keyu Liu. Diagenesis and timing of hydrocarbon fluid charge in the Eocene reservoir of the SW Qaidam Basin, western China[J]. Journal of Earth Science. doi: 10.1007/s12583-025-0217-2
    [2]Ming Shao, Tianzhu Lei, Shuncun Zhang, Shengyin Zhang, Yu Pei, Sen Song. Effects of Volcanic Activity on Organic Matter Sources and the Paleoenvironment: Geochemical Evidence from Upper Carboniferous Source Rocks (Batamayineishan Formation) in Eastern Junggar, NW China[J]. Journal of Earth Science, 2024, 35(5): 1482-1498. doi: 10.1007/s12583-022-1620-6
    [3]Mostafa Hassan, Mahmoud Lotfy Leila, Mohammed Ahmed, Ghalib Issa, Branimir ŠegviĆ, Omar Hegab. Hydrocarbon-Source Correlation in the Obayied Sub-Basin, North Western Desert, Egypt: Controls on Generation of Natural Gas and Light Crude Hydrocarbon Blends[J]. Journal of Earth Science, 2024, 35(6): 1944-1965. doi: 10.1007/s12583-023-1817-3
    [4]Jian Huang, Changqian Ma, Shihui Zhang, Muyue Xu, Da Lou, Chongbiao Leng, Mutian Qin, Hongjun Li. Characteristics, Distribution Patterns, and Classification of Volcanic Reservoirs in the Huanghua Depression, Bohai Bay Basin, China[J]. Journal of Earth Science, 2024, 35(5): 1464-1481. doi: 10.1007/s12583-022-1781-3
    [5]Quanyun Miao, Changgui Xu, Fang Hao, Minjunshi Xie, Qi Wang, Jie Yin, Huayao Zou. Hydrocarbon Charging and Accumulation Process of the Large Bozhong19-6 Condensate Gas Reservoirs in the Southwestern Bozhong Sub-Basin, Bohai Bay Basin, China[J]. Journal of Earth Science, 2024, 35(2): 613-630. doi: 10.1007/s12583-021-1457-4
    [6]Yan Lyu, Ruixia Ma, Zuopeng Wang, Jianbing Peng, Tianzhuo Gu. A Study on the Genetic Dynamics and Development Characteristics of Granitic Rock Avalanches in the Northern Qinling Mountains, China[J]. Journal of Earth Science. doi: 10.1007/s12583-024-0016-1
    [7]Xiaolin Wang, Xiaomin Zhu, Jin Lai, Xingyue Lin, Yushan Du, Yurui Zhu. Heterogeneous characteristics of various lamina assemblage in shale of Shahejie Formation of the Zhanhua Sag, Bohai Bay Basin, eastern China[J]. Journal of Earth Science. doi: 10.1007/s12583-024-0054-8
    [8]Xiuyan Liu, Honghan Chen, Xuewei Xiao, Hongan Zhang, Tianwu Xu. Mixing Characteristics of Oil Inclusions with Different Thermal Maturities in the Wenliu Uplift, Dongpu Depression, Bohai Bay Basin, North China[J]. Journal of Earth Science, 2020, 31(6): 1251-1258. doi: 10.1007/s12583-020-1356-0
    [9]Yiming Liu, Jiaren Ye, Qiang Cao, Baolin Yang, Zhongrong Liu. Hydrocarbon Generation, Migration, and Accumulation in the Eocene Niubao Formation in the Lunpola Basin, Tibet, China: Insights from Basin Modeling and Fluid Inclusion Analysis[J]. Journal of Earth Science, 2020, 31(1): 195-206. doi: 10.1007/s12583-019-1211-3
    [10]Chengcheng Zhang, Hua Wang, Si Chen, Junjie Yu, Yuantao Liao, Zongsheng Lu, Jun Wei. Lacustrine Basin Fills in an Early Cretaceous Half-Graben, Jiuquan Basin, NW China: Controlling Factors and Implications for Source Rock Depositional Processes and Heterogeneity[J]. Journal of Earth Science, 2019, 30(1): 158-175. doi: 10.1007/s12583-017-0953-z
    [11]Gang Chen; Shuheng Li; Huiruo Zhang; Fu Yang; Chao Ding; Panpan Lei; Yanxu Hu. Fluid Inclusion Analysis for Constraining the Hydrocarbon Accumulation Periods of the Permian Reservoirs in Northeast Ordos Basin[J]. Journal of Earth Science, 2013, 24(4). doi: 10.1007/s12583-013-0354-x
    [12]Liang Li; Yanxin Wang; Ya Wu; Junxia Li. Major Geochemical Controls on Fluoride Enrichment in Groundwater: A Case Study at Datong Basin, Northern China[J]. Journal of Earth Science, 2013, 24(6). doi: 10.1007/s12583-013-0385-3
    [13]Junchuan Yu, Xuanxue Mo, Xuehui Yu, Guochen Dong, Qiang Fu, Fengcun Xing. Geochemical Characteristics and Petrogenesis of Permian Basaltic Rocks in Keping Area, Western Tarim Basin: A Record of Plume-Lithosphere Interaction[J]. Journal of Earth Science, 2012, 23(4): 442-454. doi: 10.1007/s12583-012-0267-0
    [14]Qiang Cao, Jiaren Ye, Hairuo Qing, Junze Lu, Shengbing Huang, Daqing Tang. Pressure Evolution and Hydrocarbon Migration-Accumulation in the Moliqing Fault Depression, Yitong Basin, Northeast China[J]. Journal of Earth Science, 2011, 22(3): 351-362. doi: 10.1007/s12583-011-0187-4
    [15]Yanming Zhu, Shangbin Chen, Xiaodong Lan, Meng Wang, Junhua Fang. Complex Petroleum Migration and Accumulation in Central Region of Southern Junggar Basin, Northwest China[J]. Journal of Earth Science, 2010, 21(1): 94-103. doi: 10.1007/s12583-010-0007-2
    [16]Shiguo Wu, Qinghua Han, Yubo Ma, Dongdong Dong, Fuliang Lü. Petroleum System in Deepwater Basins of the Northern South China Sea[J]. Journal of Earth Science, 2009, 20(1): 124-135. doi: 10.1007/s12583-009-0014-3
    [17]Fengli Yang, Haixiao Yu, Qinglin Zhang, Qianyu Li. Correlations between Shortening Rate, Uplift Rate, and Inversion Rate in Central Inversion Zone of Xihu Depression, East China Sea Basin[J]. Journal of Earth Science, 2009, 20(4): 699-708. doi: 10.1007/s12583-009-0056-6
    [18]Qiang Cao, Jiaren Ye, Wei Wang, Wanzhong Shi, Chunfeng Chen. Preliminary Prediction and Evaluation on Source Rock in Low Exploration Basin—A Case Study from the Northeast Depression, South Yellow Sea Basin, East China[J]. Journal of Earth Science, 2009, 20(5): 836-847. doi: 10.1007/s12583-009-0070-8
    [19]Dujie Hou, Zhongyao Xiao, Youjun Tang, Junzhang Zhu, Xianqing Li. Origin of Natural Gas in Kekeya Field, Tarim Basin, China[J]. Journal of Earth Science, 2004, 15(1): 91-98.
    [20]Dameng Liu, Kuili Jin. Contrasting on Hydrocarbon Generation Model and Characteristics of Pyrolysis of Modern Aquatic Plant (Gloeocapsa) vs Marine Animal (Mantis Shrimp)[J]. Journal of Earth Science, 2000, 11(1): 28-36.
  • Cited by

    Periodical cited type(4)

    1. Christopher N. Mkono, Chuanbo Shen, Alvin K. Mulashani, et al. A novel hybrid machine learning and explainable artificial intelligence approaches for improved source rock prediction and hydrocarbon potential in the Mandawa Basin, SE Tanzania. International Journal of Coal Geology, 2025, 302: 104699. doi:10.1016/j.coal.2025.104699
    2. Yansheng Qu, Jinqi Qiao, Ningning Zhong, et al. Geochemistry and Origin of Deep and Ultradeep Crude Oils from the Jurassic Qigu Formation, Yongjin Area, Central Junggar Basin, NW China. ACS Omega, 2025, 10(3): 2735. doi:10.1021/acsomega.4c08477
    3. Haodong Hou, Wei Yang, Rui Yang, et al. Formation and Evolution of Complex Pore-Fracture Systems in Shale Gas Reservoirs: Insights into Controlling Mechanisms. Energy & Fuels, 2025, 39(6): 3008. doi:10.1021/acs.energyfuels.4c05306
    4. Jiaxu Chen, Changwei Chen, Zhiliang He, et al. Differential evolution of pore fluid pressure in the Sinian carbonate reservoirs of the central and eastern Sichuan Basin, China: Implication for gas preservation and destruction. Geological Journal, 2024, 59(10): 2720. doi:10.1002/gj.5023

    Other cited types(0)

  • Created with Highcharts 5.0.7Amount of accessChart context menuAbstract Views, HTML Views, PDF Downloads StatisticsAbstract ViewsHTML ViewsPDF Downloads2024-052024-062024-072024-082024-092024-102024-112024-122025-012025-022025-032025-04010203040
    Created with Highcharts 5.0.7Chart context menuAccess Class DistributionFULLTEXT: 33.0 %FULLTEXT: 33.0 %META: 33.0 %META: 33.0 %PDF: 33.9 %PDF: 33.9 %FULLTEXTMETAPDF
    Created with Highcharts 5.0.7Chart context menuAccess Area Distribution其他: 2.7 %其他: 2.7 %Canada: 0.4 %Canada: 0.4 %China: 18.8 %China: 18.8 %Honduras: 0.9 %Honduras: 0.9 %Hong Kong, China: 0.9 %Hong Kong, China: 0.9 %India: 6.7 %India: 6.7 %Iran (ISLAMIC Republic Of): 1.3 %Iran (ISLAMIC Republic Of): 1.3 %Norway: 0.9 %Norway: 0.9 %Other: 0.9 %Other: 0.9 %Reserved: 9.8 %Reserved: 9.8 %Russian Federation: 4.5 %Russian Federation: 4.5 %Tunisia: 0.9 %Tunisia: 0.9 %United Kingdom: 0.4 %United Kingdom: 0.4 %United States: 49.1 %United States: 49.1 %海得拉巴: 0.9 %海得拉巴: 0.9 %罗奥尔凯埃: 0.9 %罗奥尔凯埃: 0.9 %其他CanadaChinaHondurasHong Kong, ChinaIndiaIran (ISLAMIC Republic Of)NorwayOtherReservedRussian FederationTunisiaUnited KingdomUnited States海得拉巴罗奥尔凯埃

Catalog

    通讯作者: 陈斌, bchen63@163.com
    • 1. 

      沈阳化工大学材料科学与工程学院 沈阳 110142

    1. 本站搜索
    2. 百度学术搜索
    3. 万方数据库搜索
    4. CNKI搜索

    Figures(8)  / Tables(3)

    Article Metrics

    Article views(72) PDF downloads(75) Cited by(4)
    Proportional views
    Related

    /

    DownLoad:  Full-Size Img  PowerPoint
    Return
    Return