
Citation: | Xinglong Gong, Shuping Du, Fengyu Li, Yibo Ding. Spatiotemporal Variations in Climatic Factors, Catchment Characteristic Induced Runoff Changes with Multi-Time Scales across the Contiguous United States. Journal of Earth Science, 2025, 36(1): 146-160. doi: 10.1007/s12583-021-1542-8 |
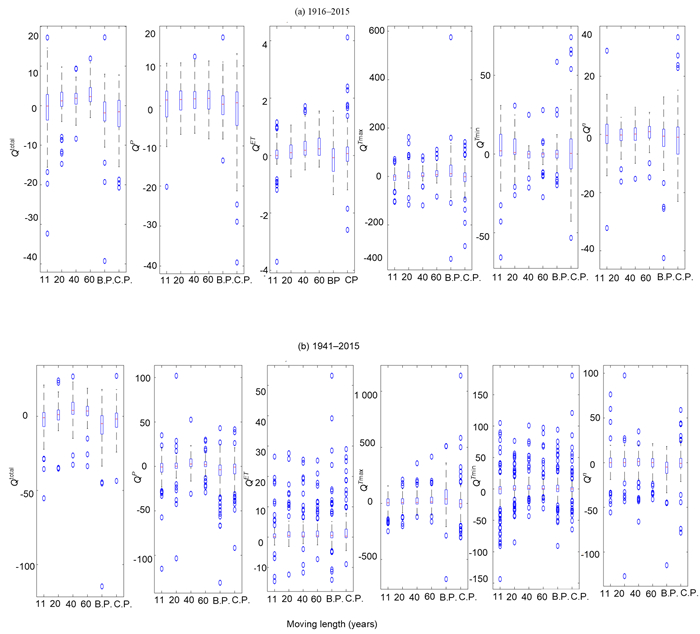
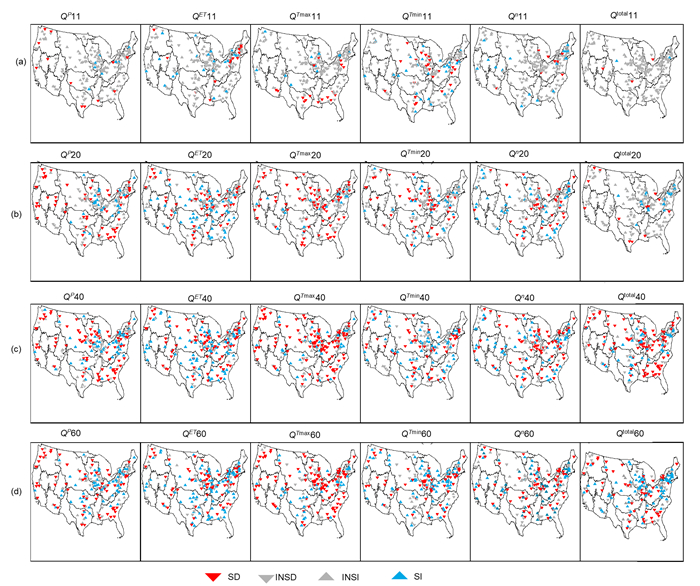
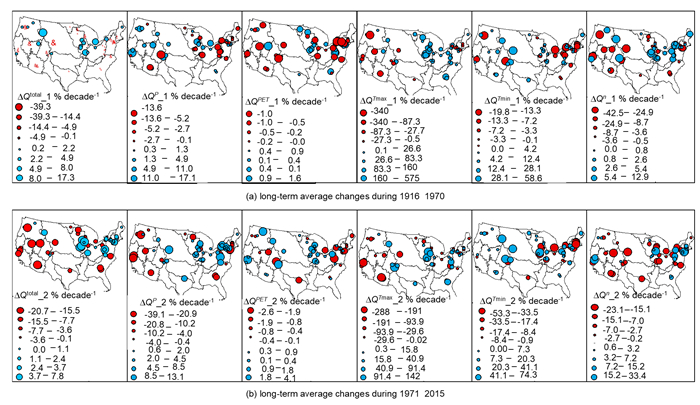
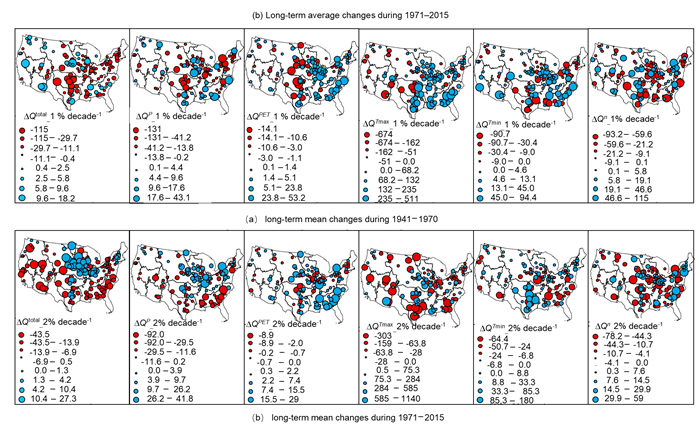
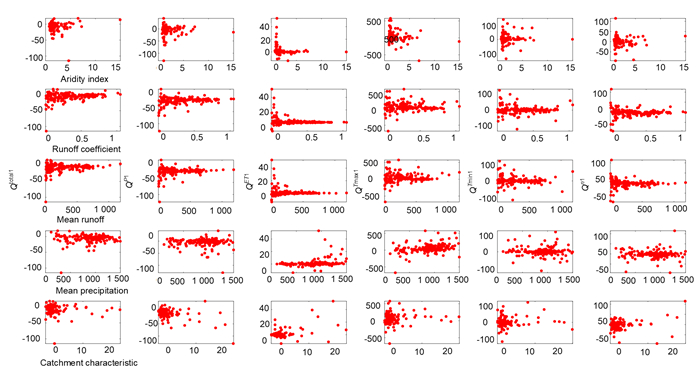
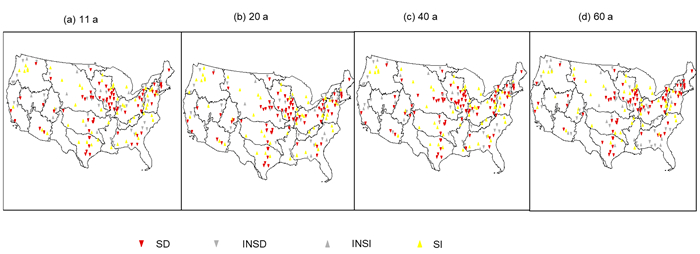
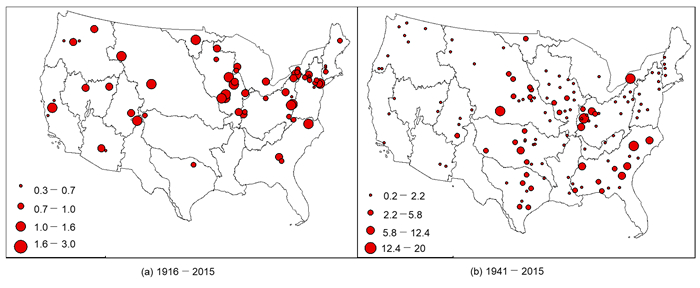
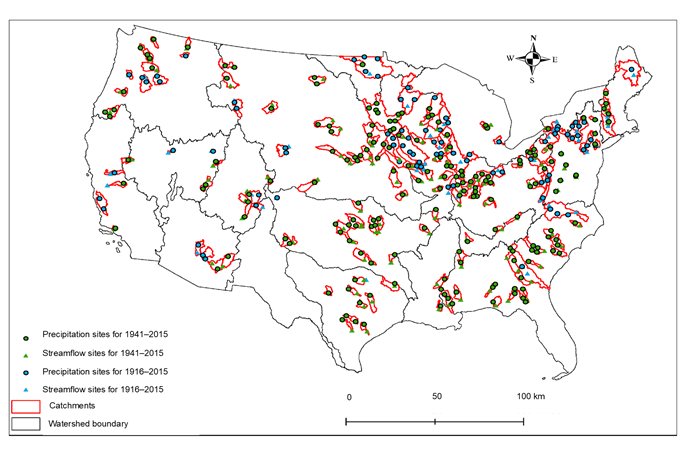
Previous works were mainly concentrated on long-term average runoff alterations, and extreme temperatures and watershed conditions are little analyzed. In this study, we collected gauged river flow and meteorological data time series from 1916 to 2015 and 1941 to 2015 across the contiguous United States (CONUS) for 188 catchments to investigate the temporal trends and spatial features of runoff changes at multi-time scales. We also analyzed the relationships between runoff changes and climatic factors. Median descriptive statistics and Budyko coupled climate elasticity methods were used to calculate runoff elasticity in each time scale. The original Mann-Kendall trend test was used to test their trend significance in four time-scale (11, 20, 40, and 60 a), respectively. The results show that the trend of runoff changes is more significant in high time scales; total changes are heterogeneous over CONUS. After the 1970s, increases of up to 27% decade-1 were mainly concentrated in the mid-northern regions. Maximum temperature and catchment characteristics are vital factors for runoff alteration; runoff changes are independent of rainfall, and wet regions tend to have lower changes. These findings could help develop better regional water resource planning and management.
Climate change and human activity are two main drivers that alter hydrological cycle processes and cause changes in the spatiotemporal distribution of water availability (Zhang et al., 2014; Kundzewicz et al., 2008). Streamflow, the most important component of the hydrological cycle, undergoes alteration over space and time and is influenced by climate change and human activities (Dey and Mishra, 2017). In recent decades, many researchers have qualitatively and quantitatively analyzed runoff variation and its cause based on measured long-term runoff data over different spatiotemporal scales and obtained valuable results (Liu J J et al., 2019; Nalley et al., 2019; Li et al., 2018; Liu J Y et al., 2017; Donohue et al., 2011). However, these studies analyzed only the long-term total impact of climate changes and human activity on runoff, and runoff is usually a result of the combined effects of multiple influential factors. The temporal trend and spatial distribution of individual factor-induced runoff changes are also important for regional water planning and management apart from total runoff changes (Mostowik et al., 2019; Wang et al., 2018).
Changes in runoff obtained from measured long-term runoff data are the result of the combined effect of climatic factors and human activities (Veettil and Kamp, 2021; Huntington, 2006), and the quantification of changes in runoff needs to separate the individual influences of climatic factors and human activities on runoff from the total changes in runoff (Wang D D et al., 2019; Wang W G et al., 2016; Sun et al., 2014; Jiang et al., 2011). Numerous methods have been utilized to separate the individual impacts of climate variability and human activities on streamflow (Dey and Mishra, 2017). These methods can be categorized as hydrological modeling (Chang et al., 2015; Hu et al., 2012), conceptual approaches (Roderick and Farquhar, 2011; Tomer and Schilling, 2009; Fu et al., 2007), analytical approaches (Sun et al., 2014; Yang et al., 2014; Sankarasubramanian et al., 2001), and experimental approaches (Zhao et al., 2010; Brown et al., 2005). One shortcoming of hydrological models is that a large number of parameters cannot be obtained from field measurements. The experimental approaches include time trends and paired catchment observations and analysis. They can test runoff changes due to vegetation variation (Brown et al., 2005). However, it is extremely difficult to locate similar catchments under identical climatic conditions which further go against the assumptions of the method. The conceptual approaches include applications of the Budyko hypothesis (decomposition and sensitivity method) and the Tomer-Schilling framework. Budyko (1974) assumed the ratio of mean annual actual evapotranspiration to the mean annual precipitation as a function of the ratio of mean annual potential evapotranspiration to the mean annual precipitation and other watershed properties. The Budyko relationship in the form of a mathematical function can be classified into nonparametric relationships (Budyko, 1974; Pike, 1964; Turc, 1953), with different catchment property parameters (Porporato et al., 2004; Zhang et al., 2001; Fu, 1981). Based on the Budyko hypothesis, two methods, elasticity of streamflow under climate change (Wang et al., 2016; Fu et al., 2007) and decomposition of the Budyko type curve (Wang and Hejazi, 2011), can be used to separate climate variability and human activities.
Climate elasticity can also be computed through a nonparametric estimator (Sankarasubramanian et al., 2001) and partial differential Budyko-based methods (Yang and Yang, 2011). A nonparametric approach is also called the median descriptive statistics method. The descriptive statistics of climate elasticity were tested and found to be robust via Monte Carlo experiments for three basins in the United States (Sankarasubramanian et al., 2001). Compared to the climate elasticity method, the nonparametric method can be used to calculate different climatic factors, such as extreme temperatures, and this method is not only easily applied but can also be used to analyze the sensitivity of runoff to multiple climatic factors (Wang et al., 2016). However, Yang and Yang (2011) compared the partial differential Budyko hypothesis-based with nonparametric methods in the Futuo River catchment in the Hai River Basin and found that the total changes in runoff were essentially different (-11% changes for the partial differential Budyko hypothesis-based method and -18% for the nonparametric estimator approach). The authors thought the reason for this difference was the short length of the data (1961–2000). Analytical approaches and conceptual methods are currently widely used to analyze runoff change, and they can accurately evaluate the sensitivity of runoff to climatic factors (1% change in influential factors causes the corresponding changes in runoff) (Wang D D et al., 2019; Wang T H et al., 2018; Wang and He, 2017; Wang W G et al., 2016; Xu et al., 2014). However, the elasticity of runoff is usually calculated by long-term average hydrometeorological data, and the minimum data length is not less than 11 a because soil water storage can be neglected (Shao et al., 2012). There is little analysis on the impact of different calculation scales on the elasticity of runoff to influential factors.
Climatic factors, human activities, and runoff itself change over time and space (Bartels et al., 2020; Jehanzaib et al., 2020; Mostowik et al., 2019; Markonis et al., 2018; Berghuijs et al., 2014; McCabe and Wolock, 2014; Lins and Slack, 2005). Generally, climatic and landscape conditions control water balance's variability (precipitation, energy, and physical processes of landscape). Partitioning of precipitation into evapotranspiration and runoff is controlled by climate and catchment characteristics. The degree of control exerted by these factors varies with the spatial and temporal scales of processes modeled. Following the above-mentioned methods in attribution analysis of runoff, many studies have investigated long-term changes in water balance and its space-time symmetry (Sivapalan et al., 2011). However, our understanding of long-term variability and change in streamflow, and its spatial variability and physical causes (Gudmundsson et al., 2019), remains largely inadequate, due to anthropogenic activities and monotonic trends. For example, Sang et al. (2020) demonstrated that non-monotonic trends of streamflow and its spatial variability across the continental United States, and which may cause underestimation of long-term variability of streamflow. Even though the long-term variability of streamflow for short data records would tend to be monotonic, the relative attributions of climatic patterns and human activities are not easily distinguished (Sang et al., 2020). Moreover, the elasticity of runoff to each factor is usually calculated by long-term average hydrometeorological data, and the minimum data length is not less than 11 a, because the soil water storage can be neglected (Shao et al., 2012). There is little analysis in studying the impact of different time scales on the elasticity of runoff to influential factors. Therefore, it is necessary to examine temporal trend of changes in runoff due to climate change and catchment characteristics and elasticity of runoff to them across variable time-scales.
Therefore, the primary objectives in this study are (1) to analyze the temporal trend and spatial distribution of changes in runoff caused by individual factors (precipitation, potential evaporation, maximum and minimum temperature, catchment characteristics) and spatial characteristics of elasticity of runoff to these factors at different time scales. We also compared the above results with long-term average changes in runoff and elasticity of runoff, and (2) to explore the relationship of changes in runoff with other factors (mean rainfall, mean runoff, aridity index, runoff coefficient, and catchment characteristic). We select four slipping windows (11, 20, 40, and 60 a) according to our length of data, and then runoff change time series and elasticity of runoff series in each window can be obtained by calculating the elasticity of runoff and changes in each slipping window in 188 catchments of CONUS. The original Mann-Kendall method is used to test the trend significance of the series. This work is helpful to determine in detail the variation process of runoff or sensitivity of runoff to influential factors under climate change and human interference.
The United States Geological Survey (USGS) streamflow gauges considered in this study are similar with the gauges considered in Dudley et al. (2020), and those sites were selected from the Geospatial Attributes of Gages for Evaluating Streamflow, version Ⅱ, (GAGES-Ⅱ) database (Falcone et al., 2010). The GAGES-Ⅱ database contains many basin-specific characteristics for 9 322 basins throughout the U.S., including climatic, hydrologic, topographic, land cover and use, and geologic attributes.
Daily streamflow data from the climatic year 1916 through the climatic year 2015 were selected, and to show full spatiotemporal change, we also considered daily streamflow from the climatic year 1941 through the climatic year 2015. We selected the water year (April 1 to March 31 of the next year) as a yearly scale but calendar year. These daily streamflow data were downloaded from the USGS National Water Information System (NWIS). We downloaded data according to the standard in Dudley et al. (2020), i.e., streamflow gauges were required to have complete data (a daily value for every day of the year) for at least 8 out of every 10 a for each decade in the periods tested. The selection criteria resulted in 2 482 total study gauges, 1 408 for the 1941–2015 period, and 203 for the 1916–2015 period. We extracted a large number of catchments according to the stream network and digital elevation of the United States and then filtered some excess sites that were not distributed in the selected catchments. The above process resulted in 128 runoff gauges, and those sites were generally located at the outlet of the catchment from 1941–2015 and 60 from 1916–2015.
The Global Historical Climatology Network-Daily (GHCN-D) was produced and archived by the National Oceanic and Atmospheric Administration (NOAA) National Climatic Data Center (Menne et al., 2012). It comprises over 96 000 sites worldwide that capture all or a subset of daily maximum and minimum temperature, precipitation, snowfall, and snow depth. The record period varies by the station from less than one year to 177 a, with the average precipitation record spanning 33.1 a (Menne et al., 2012). We also required that each year's data records be at least 80% complete in two periods (1916–2015 and 1941–2015) (Huang et al., 2017). In this study, we need daily precipitation and maximum and minimum temperature records. Based on these selection criteria, we obtained 993 meteorological stations for 1916–2015 and 1 116 meteorological stations for 1941–2015. Maximum and minimum temperatures were averaged to yield mean daily temperature, and daily potential evaporation values were multiplied by the total days of each year to obtain annual total amounts. The process that filters extra rainfall gauges is similar with the method of selecting runoff gauges, and there are a large number of precipitation sites in selected catchments. The above process resulted in 186 rainfall sites from 1941–2015 and 103 from 1916–2015.
Continental U.S. was divided and subdivided into successively smaller hydrologic units classified into four levels: regions, subregions, accounting units, and cataloging units. Each region is denoted with a unique hydrological unit code (HUC) and its typical topography. The hydrologic units are arranged or nested within each other, from the largest geographic area (regions) to the smallest geographic area (cataloging units). The watershed boundary dataset (WBD) consists of the newest and the most recent HUC delineation and further divides the HUC levels into the 5th and 6th levels. Hydrologic unit boundaries in the WBD are determined based on topographic, hydrologic, and other relevant landscape characteristics without regard for administrative, political, or jurisdictional boundaries. We obtained hydrologic units, which are shapefile or geodatabase data types, across the contiguous U.S. from the National Hydrography Dataset (NHD) in the USGS (https://www.usgs.gov/core-science-systems/ngp/national-hydrography/access-national-hydrography-products) and downloaded national 30 m digital elevation data from the Soil and Water Hub (SWH, https://soilandwaterhub.brc.tamus.edu/Home/GISData). We extracted the streamflow network and then selected the catchment according to the streamflow gauges and meteorological stations in Section 1.1 based on having obtained H.U. with varied levels. A catchment defines the areal extent drainage to an outlet point (streamflow gauges) on a dendritic stream network or multiple outlet points where the stream network is not dendritic and one or more meteorological stations are distributed throughout the catchment of interest by using the hydrological analysis tool in ArcGIS. The above procedure resulted in 60 study catchments for 1916–2015 and 128 for 1941–2015 (Figure 1).
The Food and Agricultural Organization of the United Nations (FAO) improved and upgraded the methodologies for reference evapotranspiration (ET0) estimation by introducing the reference crop (grass) concept, described by the FAO Penman-Monteith (PM-ET0) equation (Allen, 1995), and this approach was tested well under different climates and time step calculations and is currently adopted worldwide (Almorox et al., 2015; Todorovic et al., 2013). However, the high cost and maintenance of agrometeorological stations and the high number of sensors required to estimate ET0 make it non-plausible, especially in rural areas (Moratiel et al., 2020). For this reason, the estimation of ET0 using air temperature in places where wind speed, solar radiation, and air humidity data are not readily available is particularly attractive (Moratiel et al., 2020). In this case, methods of estimating ET0 based on only the air temperature have been recommended by many researchers. Allen (1995), in the guidelines for PM-ET0, recommended two approaches: (a) using the equation of Hargreaves-Samani and (b) using the Penman-Monteith temperature (PMT) method that requires temperature data to estimate Rn and VPD to obtain ET0. Our study only obtained temperature data (daily maximum and minimum temperature). Therefore, the PMT method is applied in this study to estimate ET0, and its calculation process for more details can be seen in Appendix.
The Mann-Kendall test (Mann, 1945) (p ≤ 0.05) is applied to calculate the statistical significance of trends for time-series data because this method is distribution-free, robust against outliers, and has higher power for nonnormally distributed data. The significance of trends over time is easily affected by assumptions of whether the time-series data are independent, have short-term persistence (STP), or have long-term persistence (LTP) (Sagarika et al., 2014; Hodgkins and Dudley, 2011; Khaliq et al., 2009; Kumar et al., 2009). The Mann-Kendall test assumes the input data to be serially independent, but the presence of positive serial correlation in the time-series data can overestimate the significance of trends (Yue et al., 2002; Hamed and Ramachandra Rao, 1998). To overcome the effect of serial correlation, the Mann-Kendall test after trend-free pre-whitening, as suggested by Yue et al. (2002), and the modified Mann-Kendall test, as suggested by Hamed and Ramachandra Rao (1998), can be adopted. Apart from short-term persistence, the presence of LTP behavior in the time-series data led to an underestimation of serial correlation in the data structure and overestimation of the significance of the Mann-Kendall test. Hamed (2008) proposed a technique to incorporate LTP behavior in the Mann-Kendall test, but the method is suitable for serial data with lengths of at least 100 a. In this study, our data series, data record lengths less than 100, are elasticities of climate and catchment characteristics of streamflow and runoff changes during each sliding window; therefore, we adopted the original Mann-Kendall method with assumption-independent time-series data.
In this study, the Budyko coupled climate elasticity method was used to estimate the elasticity of runoff to precipitation and potential evaporation and catchment characteristics. Budyko (1974) assumed the ratio of mean annual actual evapotranspiration to the mean annual precipitation as a function of the ratio of mean annual potential evapotranspiration to the mean annual precipitation and other watershed properties.
$$ \frac{E}{P}=f(\frac{{E}_{T}}{P}, n) $$ | (1) |
where E is actual evapotranspiration [mm]; P is annual rainfall [mm]; $ {E}_{T} $ is potential evapotranspiration [mm]; and n represents watershed properties. Since the theory was published by Budyko in 1974, its mathematical function forms have been provided by many researchers (Donohue et al., 2011; Yang et al., 2008; Porporato et al., 2004; Zhang et al., 2001; Fu, 1981; Pike, 1964; Turc, 1953). In our study, Yang et al.'s (2008) analytical derivation of the Budyko hypothesis was applied, and the function forms as follows.
$$ E=\frac{{E}_{T}\times P}{{\left({{E}_{T}}^{n}+{P}^{n}\right)}^{1/n}} $$ | (2) |
We defined Eq. (2) as $ f=(P, {E}_{T}, n) $ and we can express the total differential as
$$ \mathrm{d}E=\frac{\partial f}{\partial P}\mathrm{d}P+\frac{\partial f}{\partial {E}_{T}}\mathrm{d}{E}_{T}+\frac{\partial f}{\partial n}\mathrm{d}n $$ | (3) |
The large area (> 1 000 km2) and long period (> 11 a) allow the water balance equation to be made such that the watershed storage is approximately zero (Patterson et al., 2013), so the water balance equation can be simplified as $ P=E+R $ for a watershed (Wang et al., 2016). Thus, substituting Eq. (3) into the water balance equation and leading to the differential form
$$ \mathrm{d}Q=\left(1-\frac{\partial f}{\partial p}\right)\mathrm{d}P-\frac{\partial f}{\partial {E}_{T}}\mathrm{d}{E}_{T}-\frac{\partial f}{\partial n}\mathrm{d}n $$ | (4) |
Dividing Eq. (4) by $ Q=P-E $ yields the following expression to show the relative change in Q.
$$ \begin{array}{l} \frac{\mathrm{d}Q}{Q}=\left(1-\frac{\partial f}{\partial p}\right)\frac{P}{P-E}\frac{\mathrm{d}P}{P}-\frac{\partial f}{\partial {E}_{T}}\frac{{E}_{T}}{P-E}\frac{\mathrm{d}{E}_{T}}{{E}_{T}}-\\ \;\;\;\;\frac{\partial f}{\partial n}\frac{n}{P-E}\frac{\mathrm{d}n}{n} \end{array}$$ | (5) |
which can be denoted as
$$ \frac{\mathrm{d}Q}{Q}={\varepsilon }_{P}\frac{\mathrm{d}P}{P}+{\varepsilon }_{{E}_{T}}\frac{\mathrm{d}{E}_{T}}{{E}_{T}}+{\varepsilon }_{n}\frac{\mathrm{d}n}{n} $$ | (6) |
where $ {\varepsilon }_{p} $, $ {\varepsilon }_{{E}_{T}} $, and $ {\varepsilon }_{n} $ are the precipitation elasticity, potential evaporation elasticity and catchment characteristic elasticity of runoff, respectively. Previous studies estimated the climate and catchment characteristic elasticity of runoff by mean annual climatic variables (Zheng et al., 2009; Arora, 2002). Thus, we can calculate climate elasticity (precipitation, potential evaporation), and watershed characteristic elasticity of runoff by substituting annual climatic variable values into Budyko type curves. Because we have insufficient meteorological variables apart from temperature and to further fully reflect the influence of maximum and minimum temperatures on runoff, we need to compute the maximum and minimum temperature elasticity of runoff. Unlike the calculation process of precipitation and potential evapotranspiration elasticity, maximum and minimum temperature elasticity in this study was estimated by median descriptive statistics (Sankarasubramanian et al., 2001).
$$ \varepsilon =\mathrm{m}\mathrm{e}\mathrm{d}\mathrm{i}\mathrm{a}\mathrm{n}\left[\frac{({R}_{i}-\stackrel{-}{R})/\stackrel{-}{R}}{({X}_{i}-\stackrel{-}{X})/\stackrel{-}{X}}\right] $$ | (7) |
where $ \varepsilon $ is the climatic factor (maximum and minimum temperature) elasticity of runoff; $ {R}_{i} $ is the annual mean runoff [mm]; $ \stackrel{-}{R} $ is the multiyear average runoff [mm]; $ {X}_{i} $ denotes the climate variables; and $ \stackrel{-}{X} $ denotes the mean of any climatic variable. $ \left[\frac{({R}_{i}-\stackrel{-}{R})/\stackrel{-}{R}}{({X}_{i}-\stackrel{-}{X})/\stackrel{-}{X}}\right] $ is calculated for each pair of $ {R}_{i} $ and $ {X}_{i} $, and the median of these values is the nonparametric estimator of the climate elasticity of runoff. However, there is a mathematical error when $ {X}_{i}=\stackrel{-}{X} $. Thus, Zheng et al. (2009) suggested the following least squares estimator.
$$ \varepsilon =\frac{\stackrel{-}{X}}{\stackrel{-}{R}}\frac{\sum \left({X}_{i}-\stackrel{-}{X}\right)\left({R}_{i}-\stackrel{-}{R}\right)}{\sum {\left({X}_{i}-\stackrel{-}{X}\right)}^{2}} $$ | (8) |
Thus, maximum and minimum temperature elasticity can be obtained as follows.
$$ {\varepsilon }_{T\mathrm{m}\mathrm{a}\mathrm{x}}=\frac{\overline{T\mathrm{m}\mathrm{a}\mathrm{x}}}{\stackrel{-}{R}}\frac{\sum \left(T\mathrm{m}\mathrm{a}{\mathrm{x}}_{i}-\overline{T\mathrm{m}\mathrm{a}\mathrm{x}}\right)\left({R}_{i}-\stackrel{-}{R}\right)}{\sum {\left(T\mathrm{m}\mathrm{a}{\mathrm{x}}_{i}-\overline{T\mathrm{m}\mathrm{a}\mathrm{x}}\right)}^{2}} $$ | (9) |
$$ {\varepsilon }_{T\mathrm{m}\mathrm{i}\mathrm{n}}=\frac{\overline{T\mathrm{m}\mathrm{i}\mathrm{n}}}{\stackrel{-}{R}}\frac{\sum \left(T\mathrm{m}\mathrm{i}{\mathrm{n}}_{i}-\overline{T\mathrm{m}\mathrm{i}\mathrm{n}}\right)\left({R}_{i}-\stackrel{-}{R}\right)}{\sum {\left(T\mathrm{m}\mathrm{i}{\mathrm{n}}_{i}-\overline{T\mathrm{m}\mathrm{i}\mathrm{n}}\right)}^{2}} $$ | (10) |
where $ {\varepsilon }_{T\mathrm{m}\mathrm{a}\mathrm{x}} $ and $ {\varepsilon }_{T\mathrm{m}\mathrm{i}\mathrm{n}} $ are the maximum and minimum temperature elasticities of runoff, respectively.
Therefore, by substituting climatic factors, runoff series, and their mean values in each slipping window into Eqs. (6), (9), and (10), we can obtain the climate, watershed characteristic elasticity of runoff, and runoff change time series in each slipping window.
We compared both proportional and total runoff changes under each time window with long-term average changes during baseline and changed periods (Figure 2). Here, the median value of runoff change time series under each slipping window is employed. In addition, Wang and Hejazi (2011) documented that 1970 is the same change point of mean annual runoff in all watersheds of the contiguous United States; thus, for the purpose of cross-comparison among watersheds and their spatial patterns, the dataset is split into two periods at the same change point: 1916–1970 (baseline periods, B.P.), 1971–2015 (changed periods, C.P.) for the 1916–2015 period and 1941–1970 (B.P.), 1971–2015 (C.P.) for the 1941–2015 period. Figure 2 shows that runoff changes may be different in different time windows. Precipitation, potential evapotranspiration, and watershed characteristic-induced runoff changes increase with moving steps. The runoff changes caused by these factors during both B.P. and C.P. periods are slightly less than that in four slipping windows. However, changes during C.P. period are bigger than those during B.P. period (Figure 2a); this indicates that precipitation, evapotranspiration, and catchment characteristic-induced runoff changes increase after the abrupt change; Maximum temperature-induced runoff changes also increase over time, but changes decrease after the abrupt change and changes during C.P. period is minimum in all periods. Minimum temperature-induced changes in 11, 20 a are higher than those in 40, 60 a, and the changes increase after abrupt changes. Total changes increase over the slipping windows and increase after the change point.
We further investigated the temporal trend of runoff change time series in each slipping window (Figure 3). The results show that the trend significance of runoff changes is related to time windows. Runoff changes caused by all impact factors mainly present insignificant trends in low time windows (11, 20 a), and the number of catchments with significant trends dramatically increases with the ascent of time windows (Table 1). Precipitation and maximum temperature-induced changes mainly present significant decreasing trends, and those catchments are concentrated in the northeastern and western United States for maximum temperature-induced changes. Potential evaporation-induced changes mainly present a significant increasing trend over the United States. The number of catchments with a significant increasing trend was approximately close to the number of catchments with a significant declining trend for minimum temperature- and catchment characteristic-induced changes. In contrast, a significant decreasing trend in 20, 40 a time windows converts to a significant increasing trend in the 60 a time window in northeastern regions. This result indicates that runoff changes are relative to time periods, and even different trends are observed in different time periods.
11 a | 20 a | 40 a | 60 a | ||||||||
SD | SI | SD | SI | SD | SI | SD | SI | ||||
QP | 14 | 7 | 56 | 28 | 82 | 49 | 66 | 59 | |||
QET | 13 | 9 | 47 | 53 | 59 | 83 | 64 | 70 | |||
QTmax | 18 | 12 | 66 | 17 | 102 | 32 | 98 | 54 | |||
QTmin | 23 | 27 | 44 | 32 | 53 | 59 | 54 | 68 | |||
Qn | 7 | 17 | 34 | 46 | 69 | 60 | 59 | 64 | |||
Qtotal | 3 | 2 | 30 | 28 | 87 | 47 | 48 | 67 |
Above results shows that not only the trend of runoff changes but also changes in runoff are correlated with calculation periods. The opposite trend is observed among different slipping windows. In this section, we analyzed long-term average changes caused by multiple factors during 1916–2015 and 1941–2015. Considering the abrupt changes in runoff changepoints, long-term average changes in two periods (i.e., the baseline period and the changed period) in the 188 catchments of the contiguous United States were analyzed. Figures 4–5 show the spatial distribution of long-term average changes caused by climatic factors and catchment characteristics during 1916–2015 and 1941–2015, respectively ((a) baseline period and (b) changed period). The results show that in baseline periods, precipitation-induced changes are heterogeneous over the entire contiguous United States. The greatest change is in most areas of the United States, where 18%–43% decade-1 increase and -41%– -131% decade-1 decrease. However, positive changes are mainly concentrated in mid-northern regions in the changed period, and the greatest increase change is 42% decade-1. The greatest decrease change is located at southeastern regions where -92% decade-1 declines. Potential evapotranspiration-induced changes with the most increase change 24%–53% decade-1 in mid-northern and southeastern regions in baseline period, the most decrease change range from -11% to -14% decade-1. Those regions are mainly located in central regions, especially after the abrupt change; the positive change is more pronounced (the most increase change 16%–29% decade-1, 9% decade-1 decrease). The contributions of both maximum and minimum temperatures to mean runoff are somewhat positive in most regions in the baseline period, with ranges from 51% to 511% decade-1 increase for maximum temperature and 5%–94% decade-1 increase for minimum temperature, and those catchments are mainly distributed in northern and southeastern regions. However, for maximum temperature after the abrupt change, most catchments with the greatest decline change of -300% decade-1 present a negative change in the runoff, and changes are largely lower than positive changes (the greatest increase change ranges from 585%–1 140% decade-1). After an abrupt change, minimum temperature-induced changes are also positive in most regions, but their changes (the greatest increase change is 45%–94% decade-1, and -51– -64% decade-1 decrease) are significantly lower than the maximum temperature-induced changes. The spatial distribution of the contribution of catchment characteristics to runoff is heterogeneous over the United States in both baseline and changed periods. However, we can find that the number of catchments with decreasing change is slightly greater than the increasing change; thus, we can demonstrate that after abrupt change, watershed properties mainly caused a decreasing change in the runoff. The greatest change is in most regions of the United States, where 47%–115% decade-1 increase and the greatest decreasing changes are somewhat in the southeastern regions, where catchment characteristics caused a -60%– -93% decade-1 decrease in the baseline period and a 30%–59% decade-1 increase, -44– -78% decade-1 decrease in the changed period. Total changes with positive change are mainly concentrated in northern regions, and other regions present negative changes, which is similar with the distribution of precipitation-induced changes. In the baseline period, the greatest increase change ranged from a 9%–18% decade-1 decrease and a -115% decade-1 decrease. In the changed period, the greatest increase change is up to 10%–27% decade-1, and the -44% decade-1 decrease.
Overall, the impact of climatic factors and catchment characteristics on runoff is somewhat heterogeneous, but climatic factor-induced changes may present positive changes at baseline, and catchment characteristics cause negative changes. Total changes are also heterogeneous, and their distribution is similar with climatic factor-induced changes. Maximum temperature-induced changes convert to a negative trend after the abrupt change, especially in the southeastern parts. This conclusion is consistent with the temporal trend variation of runoff in Section 3.1. Generally, after the abrupt change, total changes are mainly negative in most regions. Positive change is mainly concentrated in northern regions, consistent with most of the factor-induced changes and is contrary to potential evaporation- and catchment characteristic-induced changes. This indicates that watershed properties are a major factor that leads to runoff decrease alteration in the United States, but climatic factors induce positive changes, and this conclusion is the same as Wang and Hejazi (2011). Additionally, we can demonstrate that maximum and minimum temperatures are the main factors affecting runoff alteration.
Carmona et al. (2014) studied the interannual variability of the water balance and constructed a graph in the form of Q versus P and E versus P relationships based on annual values. Wang and Hejazi (2011) plotted direct human-induced changes against the climate dryness index and evaporation ratio to further investigate whether the estimated climate- and direct human-induced changes can be explained by other factors, and they found that arid regions (i.e., water-limited) are more vulnerable to climate change and direct human interferences than wet regions (i.e., energy limited). To further investigate whether the runoff changes can be explained by other factors, the relationships between long-term mean runoff changes and P (precipitation), R (runoff), aridity index, runoff coefficient and catchment characteristics were studies and a graph in the form of a correlation for their relationship was depicted in our study (Figure 6). The relationship between the runoff changes and runoff coefficient presents an exponential trend and high changes in regions with a low runoff index. Meanwhile, we can also find that the relationship between multiple factors-induced changes and mean runoff is consistent with the relationships between runoff changes and the runoff index. However, this relationship tends to be a horizontal line trend for mean rainfall. This result indicates that multiple climate factors- (precipitation, potential evaporation, maximum and minimum temperatures) and catchment characteristic-induced changes are independent of precipitation and that wet regions tend to have lower changes values. This conclusion can illustrate the spatial distribution of the multiple factors that induced runoff changes in the United States in Figures 4–5. The relationship between catchment characteristics and catchment characteristic induced runoff changes tends to be a line trend and the values increase with the ascent of n. Catchment characteristic reveals interrelated dynamics between vegetation type, soil properties, and topography (Dey and Mishra, 2017). Its value impacts the evaporation of the catchment. Higher values of n indicate that the watershed characteristics favor evapotranspiration (for densely vegetated basins). Lower values indicate that the characteristics do not favor evapotranspiration. In this study, we can demonstrate that the evaporation ratio and multiple factor-induced changes are affected by catchment characteristics. We also found that the trend in total changes was consistent with the trend for precipitation, which indicated that precipitation played a vital role in runoff changes.
In our study, we found that the trend of runoff changes is closely related to time scales, and even a positive trend on a short scale converts to a negative trend and vice versa (Figure 3). Thus, we can consider that runoff is not a monotonic trend but is nonmonotonic. The common practice of detecting only the monotonic trend cannot reflect the long-term variability and change in streamflow; for instance, Rice et al. (2015) proved that flow tended to be increasing across the continental U.S., and trends in streamflow were identified by analyzing mean daily flow observations between 1940 and 2009 from 967 U.S. Geological Survey stream gages, Sang et al. (2020) considered that this would result in an insufficient or biased understanding. Thus, our conclusions prove Sang et al.'s (2020) result from the perspective of the trend of runoff changes.
We found total changes are up to -115% decade-1 decrease and 18% decade-1 increase during 1941–1970, but lower changes during 1916–1970 (17% decade-1 increase, -39% decade-1 decrease). Generally, streamflow was mainly controlled by the changing climate before the 1970s in the CONUS, and human modification was the main factor after the 1970s. Thus, we can demonstrate that climate change gradually amplified runoff alteration regardless of whether runoff change increased or decreased. Our results show that climatic change somewhat increased mean runoff during both the baseline and changed periods, and catchment characteristic-induced change is spatially heterogeneous in the contiguous United States. Since the 1970s, in our study, the increased change is up to 27% decade-1, and the -44% decade-1 decrease, and the increased changes were mainly concentrated in the mid-north region (Figures 4–5). These conclusions are consistent with the results from Wang and Hejazi (2011). Patterson et al. (2013) found that climate contributed to increased streamflow (average of 14%) in the South Atlantic since the 1970s, and human impacts were equivalent to, or greater than, climate impacts in 27%. In a certain meaning, indirect human modifications cause alteration of watershed characteristics (e.g., vegetation coverage, land use/land change, slope), and we can roughly classify catchment characteristic-induced changes as changes caused by indirect human activities. There is little difference for catchment characteristic-induced change between baseline and changed periods. The increased change is mainly concentrated in the Midwest during the baseline period and Mideast and south during changed periods Figures 4–5). Wang and Hejazi (2011) showed human activities causing increased MAS in the Midwest and significantly decreased MAS in the High Plains during 1948–2003. The difference between the above may be the length of the study period. Therefore, not only the number of changes but also location changes over time due to aggravating climatic change and frequent human activities, and we need to frequently determine runoff change for water resource management.
Maximum and minimum temperature contribution to runoff is essentially outstanding (maximum temperature-induced -674% decade-1 decrease, 585%– -1 140% decade-1 increase). Despite the large contribution of extreme temperature to runoff, the total changes are relatively small. A possible reason for this is that runoff is also affected by other climatic factors (e.g., net radiation, relative humidity, wind).
In our study, potential evaporation is obtained by methods of estimating ET0, which are based on only the air temperature. Various international agencies are attempting to develop a consensus with respect to the best and most appropriate methods to use for routine calculation of potential evapotranspiration, and currently, evapotranspiration (ET0) recommended by the Food and Agricultural Organization of the United Nations (FAO) Penman-Monteith method is mostly used in calculation of ET0. However, considering this method needs enough climatic data, simplified approaches, specifically temperature-based methods for ET0 estimation, are widely and successfully applied all over the world (Wang D D et al. 2019; Wang T H et al. 2018; Bartels et al., 2020) for 3 reasons: rely on only one ground-measured meteorological variable (i.e., air temperature); a temperature estimation at different-derived quantities, namely, the daily temperature range, can provide useful or even crucial information for ET0 time ranges because it can be successfully used as a proxy for the average behavior of missing data such as relative humidity, wind speed, and solar radiation (Senatore et al. 2020); and due to its usually high correlation with height, a single air temperature measurement can be representative of a relatively large area, and spatial interpolation of temperature data can be achieved more easily than other climatic parameters. There is a large number of temperature-based approaches for estimating ET0. For instance, Penman-Monteith temperature (PMT) method can be applied with only minimum and maximum daily air temperature data (the minimum data required according to the FAO-56 guidelines); The alternative equation is the empirical Hargreaves-Samani (H.S.) model (Hargreaves et al., 1985), but this method tends to underpredict under high wind conditions and to overpredict under conditions of high relative humidity. Among various temperature-based methods for estimating ET0, the FAO-56 guidelines (Allen, 1995) strongly recommend estimating missing climatic data with specifically prescribed procedures and then calculating ET0 with the Penman-Monteith (PM) FAO 56 method. In our study, we applied maximum and minimum daily temperatures only to calculate other meteorological parameters (e.g., relative humidity, solar radiation), this process may induce bias compared to ET0 calculated by the FAO PM model, which applied enough climatic data apart from temperature. For example, Senatore et al. (2020) proved that the H.S. model performed better than the corresponding PMT model versions; Moratiel et al. (2020) used two Hargreaves-Samani (H.S.) models, with and without calibration, and five Penman-Monteith temperature (PMT) models to estimate ET0 against Penman-Monteith (PM) FAO 56 and result has shown that models' performance changes considerably, depending on whether the scale is annual or seasonal, the performance of the seven models was acceptable from an annual perspective, in the most of the seasons apart from winter, the models with the best performance was Penman-Monteith temperature with calibration of Hargreaves empirical coefficient KR, S, the average monthly value of wind speed, and average monthly value of the maximum and minimum relative humidity, the following was Hargreaves-Samani with calibration of KR, S. In our estimation of ET0, we calculate ET0 on a seasonal scale and then sum them to obtain annual ET0; thus, we can consider our annual ET0 to be reasonable. Additionally, Shirmohammadi-Aliakbarkhani and Saberali (2020) compared five radiation-based models and temperature-based models with the FAO-Penman-Monteith method on a daily and growing season scale. The results revealed that the temperature-based methods outperformed the radiation-based methods in the study area. Hargreaves and Samani were the best methods for predicting daily ET0, and the best ET0 alternative methods might be unreliable in some regions and could not be recommended for estimating crop water requirements. Accordingly, the spatiotemporal variability in the predictability performance of ET0 models should be taken into account before use.
The influence of n on mean runoff is long-term and sometimes ignored by some researchers, such as Yang et al. (2008), while some scholars (Hodgkins et al., 2019; Patterson et al., 2013; Wang and Hejazi, 2011) classified it as human activities. Wang et al. (2016) considered that total runoff changes could be estimated by the summation of runoff changes due to variations in climate factors and the alteration of catchment characteristics. Wang et al. (2016) demonstrated that the alteration of catchment characteristics and climatic change should be mainly responsible for runoff changes in water-limited and humid basins, respectively. In the calculation process, the contribution of catchment characteristic n to mean runoff is the long-term average value and is unchanged over time and space n is correlated with vegetation coverage, soil types, LULC, topography, season. These factors' conditions vary in different parts of the watershed. In our study, Figures 4–5 clearly shows that catchment characteristic-induced runoff changes change with time and even show significant variation in some regions. Thus, the variation in n over time and space should be considered in the attribution analysis of runoff change. To investigate the spatiotemporal change characteristics of catchment characteristic n, we analyzed the temporal trend of catchment characteristic n during different slipping windows and the spatial distribution of its mean value across 188 catchments of the United States (Figure 7). Considering that the average value of n under the four slipping windows is similar, here, we analyzed the spatial distribution of the long-term average n during the two study periods (75 and 100 a) (Figure 8). Figures 7 and 8 show that a significant decreasing trend for n occurs mainly in the northeastern regions of the United States, catchments with the same trend are seldom concentrated in the south, and a significant increasing trend for n mainly occurs in the western regions. The value of n in the south is larger than that in the north, the n value in the east is larger than that in the west, and the largest value n occurs mainly in the eastern and southeastern regions. This means that human activities in the east and south are more serious, this result is similar with the results of Dudley et al. (2020) and Hodgkins et al. (2019).
In this study, spatial and temporal variations in runoff changes during 1916–2015 and 1941–2015 in the 188 catchments of the CONUS are first investigated. Then, we explored the relationships of the long-term average runoff changes with other factors (aridity index, runoff coefficient, mean rainfall, mean runoff, catchment characteristic). We found that: (1) Runoff changes caused by each driver factor have great fluctuations over time. (2) Total changes are heterogeneous over the United States, with the greatest changes being an 18% decade-1 increase and a -115% decade-1 decrease in the baseline period. After the 1970s, the increase changes (27% decade-1) were mainly concentrated in the mid-northern regions, and the decrease changes with the greatest change of -44% decade-1 were distributed in most of the other regions. Each factor may have a varying degree of influence on runoff. Apart from precipitation, maximum temperature (585%–1 140% decade-1 increase, -162%– -674% decade-1 decrease) and catchment characteristics (-60%– -93% decade-1 increase, 47%–115% decade-1 decrease) are also vital factors that caused runoff alteration. (3) Multiple climate factors (precipitation, potential evaporation, maximum and minimum temperatures) induced runoff changes are independent of precipitation, and wet regions tend to have lower runoff changes. The relationship of multiple factors induced runoff changes with runoff coefficient present exponential trend, which is consistent with the relationship of multiple factors caused runoff changes with mean runoff, but this relationship tends to be horizontal line trend for mean rainfall.
ACKNOWLEDGMENTS: This study is supported by National Key R & D Program of China (No. 2018YFC0407303), "Young Talents" Project of Northeast Agricultural University (No. 20QC13) and the Natural Science Foundation of Heilongjiang Province of China (No. E2017009). To our knowledge, no conflicts of interest are present. We thank four anonymous reviewers for their thoughtful comments, which greatly improved the quality of our manuscript. The final publication is available at Springer via https://doi.org/10.1007/s12583-021-1542-8.Allen, R. G., 1995. Evaluation of Procedures for Estimating Grass Reference Evapotranspiration Using Air Temperature Data Only. Report Submitted to Water Resources Development and Management Service, Land and Water Development Division, United Nations Food and Agriculture Service, Rome, Italy |
Almorox, J., Quej, V. H., Martí, P., 2015. Global Performance Ranking of Temperature-Based Approaches for Evapotranspiration Estimation Considering Köppen Climate Classes. Journal of Hydrology, 528: 514–522. https://doi.org/10.1016/j.jhydrol.2015.06.057 |
Arora, V. K., 2002. The Use of the Aridity Index to Assess Climate Change Effect on Annual Runoff. Journal of Hydrology, 265(1/2/3/4): 164–177. https://doi.org/10.1016/S0022-1694(02)00101-4 |
Bartels, R. J., Black, A. W., Keim, B. D., 2020. Trends in Precipitation Days in the United States. International Journal of Climatology, 40(2): 1038–1048. https://doi.org/10.1002/joc.6254 |
Berghuijs, W. R., Woods, R. A., Hrachowitz, M., 2014. A Precipitation Shift from Snow towards Rain Leads to a Decrease in Streamflow. Nature Climate Change, 4(7): 583–586. https://doi.org/10.1038/nclimate2246 |
Brown, A. E., Zhang, L., McMahon, T. A., et al., 2005. A Review of Paired Catchment Studies for Determining Changes in Water Yield Resulting from Alterations in Vegetation. Journal of Hydrology, 310(1/2/3/4): 28–61. https://doi.org/10.1016/j.jhydrol.2004.12.010 |
Budyko, M. I., 1974. Climate and Life. Academic Press, New York |
Carmona, A. M., Sivapalan, M., Yaeger, M. A., et al., 2014. Regional Patterns of Interannual Variability of Catchment Water Balances across the Continental U. S.: A Budyko Framework. Water Resources Research, 50(12): 9177–9193. https://doi.org/10.1002/2014wr016013 |
Chang, J. X., Wang, Y. M., Istanbulluoglu, E., et al., 2015. Impact of Climate Change and Human Activities on Runoff in the Weihe River Basin, China. Quaternary International, 380/381: 169–179. https://doi.org/10.1016/j.quaint.2014.03.048 |
Dey, P., Mishra, A., 2017. Separating the Impacts of Climate Change and Human Activities on Streamflow: A Review of Methodologies and Critical Assumptions. Journal of Hydrology, 548: 278–290. https://doi.org/10.1016/j.jhydrol.2017.03.014 |
Donohue, R. J., Roderick, M. L., McVicar, T. R., 2011. Assessing the Differences in Sensitivities of Runoff to Changes in Climatic Conditions across a Large Basin. Journal of Hydrology, 406(3/4): 234–244. https://doi.org/10.1016/j.jhydrol.2011.07.003 |
Dudley, R. W., Hirsch, R. M., Archfield, S. A., et al., 2020. Low Streamflow Trends at Human-Impacted and Reference Basins in the United States. Journal of Hydrology, 580: 124254. https://doi.org/10.1016/j.jhydrol.2019.124254 |
Falcone, J. A., Carlisle, D. M., Weber, L. C., 2010. Quantifying Human Disturbance in Watersheds: Variable Selection and Performance of a GIS-Based Disturbance Index for Predicting the Biological Condition of Perennial Streams. Ecological Indicators, 10(2): 264–273. https://doi.org/10.1016/j.ecolind.2009.05.005 |
Fu, B. P., 1981. On the Calculation of the Evaporation from Land Surface. Scientia Atmospherica Sinica, 5(1): 23–31 (in Chinese with English Abstract) |
Fu, G. B., Charles, S. P., Chiew, F. H. S., 2007. A Two-Parameter Climate Elasticity of Streamflow Index to Assess Climate Change Effects on Annual Streamflow. Water Resources Research, 43(11): W11419. https://doi.org/10.1029/2007wr005890 |
Gudmundsson, L., Leonard, M., Do, H. X., et al., 2019. Observed Trends in Global Indicators of Mean and Extreme Streamflow. Geophysical Research Letters, 46(2): 756–766. https://doi.org/10.1029/2018gl079725 |
Hamed, K. H., 2008. Trend Detection in Hydrologic Data: The Mann-Kendall Trend Test under the Scaling Hypothesis. Journal of Hydrology, 349(3/4): 350–363. https://doi.org/10.1016/j.jhydrol.2007.11.009 |
Hamed, K. H., Ramachandra Rao, A., 1998. A Modified Mann-Kendall Trend Test for Autocorrelated Data. Journal of Hydrology, 204(1/2/3/4): 182–196. https://doi.org/10.1016/S0022-1694(97)00125-X |
Hargreaves, G. L., Hargreaves, G. H., Riley, J. P., 1985. Irrigation Water Requirements for Senegal River Basin. Journal of Irrigation and Drainage Engineering, 111(3): 265–275. https://doi.org/10.1061/(asce)0733-9437(1985)111:3(265) |
Hodgkins, G. A., Dudley, R. W., 2011. Historical Summer Base Flow and Stormflow Trends for New England Rivers. Water Resources Research, 47(7): 2010WR009109. https://doi.org/10.1029/2010wr009109 |
Hodgkins, G. A., Dudley, R. W., Archfield, S. A., et al., 2019. Effects of Climate, Regulation, and Urbanization on Historical Flood Trends in the United States. Journal of Hydrology, 573: 697–709. https://doi.org/10.1016/j.jhydrol.2019.03.102 |
Hu, S. S., Liu, C. M., Zheng, H. X., et al., 2012. Assessing the Impacts of Climate Variability and Human Activities on Streamflow in the Water Source Area of Baiyangdian Lake. Journal of Geographical Sciences, 22(5): 895–905. https://doi.org/10.1007/s11442-012-0971-9 |
Huang, H. P., Winter, J. M., Osterberg, E. C., et al., 2017. Total and Extreme Precipitation Changes over the Northeastern United States. Journal of Hydrometeorology, 18(6): 1783–1798. https://doi.org/10.1175/jhm-d-16-0195.1 |
Huntington, T. G., 2006. Evidence for Intensification of the Global Water Cycle: Review and Synthesis. Journal of Hydrology, 319(1/2/3/4): 83–95. https://doi.org/10.1016/j.jhydrol.2005.07.003 |
Jehanzaib, M., Ali Shah, S., Yoo, J., et al., 2020. Investigating the Impacts of Climate Change and Human Activities on Hydrological Drought Using Non-Stationary Approaches. Journal of Hydrology, 588: 125052. https://doi.org/10.1016/j.jhydrol.2020.125052 |
Jiang, S. H., Ren, L. L., Yong, B., et al., 2011. Quantifying the Effects of Climate Variability and Human Activities on Runoff from the Laohahe Basin in Northern China Using Three Different Methods. Hydrological Processes, 25(16): 2492–2505. https://doi.org/10.1002/hyp.8002 |
Khaliq, M. N., Ouarda, T. B. M. J., Gachon, P., 2009. Identification of Temporal Trends in Annual and Seasonal Low Flows Occurring in Canadian Rivers: The Effect of Short- and Long-Term Persistence. Journal of Hydrology, 369(1/2): 183–197. https://doi.org/10.1016/j.jhydrol.2009.02.045 |
Kumar, S., Merwade, V., Kam, J., et al., 2009. Streamflow Trends in Indiana: Effects of Long Term Persistence, Precipitation and Subsurface Drains. Journal of Hydrology, 374(1/2): 171–183. https://doi.org/10.1016/j.jhydrol.2009.06.012 |
Kundzewicz, Z. W., Mata, L. J., Arnell, N. W., et al., 2008. The Implications of Projected Climate Change for Freshwater Resources and Their Management. Hydrological Sciences Journal, 53(1): 3–10. https://doi.org/10.1623/hysj.53.1.3 |
Li, Q., Wei, X. H., Zhang, M. F., et al., 2018. The Cumulative Effects of Forest Disturbance and Climate Variability on Streamflow Components in a Large Forest-Dominated Watershed. Journal of Hydrology, 557: 448–459. https://doi.org/10.1016/j.jhydrol.2017.12.056 |
Lins, H. F., Slack, J. R., 2005. Seasonal and Regional Characteristics of U. S. Streamflow Trends in the United States from 1940 to 1999. Physical Geography, 26(6): 489–501. https://doi.org/10.2747/0272-3646.26.6.489 |
Liu, J. J., Zhou, Z. H., Yan, Z. Q., et al., 2019. A New Approach to Separating the Impacts of Climate Change and Multiple Human Activities on Water Cycle Processes Based on a Distributed Hydrological Model. Journal of Hydrology, 578: 124096. https://doi.org/10.1016/j.jhydrol.2019.124096 |
Liu, J. Y., Zhang, Q., Singh, V. P., et al., 2017. Contribution of Multiple Climatic Variables and Human Activities to Streamflow Changes across China. Journal of Hydrology, 545: 145–162. https://doi.org/10.1016/j.jhydrol.2016.12.016 |
Mann, H. B., 1945. Nonparametric Tests Against Trend. Econometrica, 13(3): 245. https://doi.org/10.2307/1907187 |
Markonis, Y., Moustakis, Y., Nasika, C., et al., 2018. Global Estimation of Long-Term Persistence in Annual River Runoff. Advances in Water Resources, 113: 1–12. https://doi.org/10.1016/j.advwatres.2018.01.003 |
McCabe, G. J., Wolock, D. M., 2014. Spatial and Temporal Patterns in Conterminous United States Streamflow Characteristics. Geophysical Research Letters, 41(19): 6889–6897. https://doi.org/10.1002/2014gl061980 |
Menne, M. J., Durre, I., Vose, R., et al., 2012. An Overview of the Global Historical Climatology Network-Daily Database. Journal of Atmospheric and Oceanic Technology, 29(7): 897–910. https://doi.org/10.1175/JTECH-D-11-00103.1 |
Moratiel, R., Bravo, R., Saa, A., et al., 2020. Estimation of Evapotranspiration by the Food and Agricultural Organization of the United Nations (FAO) Penman-Monteith Temperature (PMT) and Hargreaves-Samani (HS) Models under Temporal and Spatial Criteria: A Case Study in Duero Basin (Spain). Natural Hazards and Earth System Sciences, 20: 859–875. https://doi.org/10.5194/nhess-20-859-2020 |
Mostowik, K., Siwek, J., Kisiel, M., et al., 2019. Runoff Trends in a Changing Climate in the Eastern Carpathians (Bieszczady Mountains, Poland). Catena, 182: 104174. https://doi.org/10.1016/j.catena.2019.104174 |
Nalley, D., Adamowski, J., Biswas, A., et al., 2019. A Multiscale and Multivariate Analysis of Precipitation and Streamflow Variability in Relation to ENSO, NAO and PDO. Journal of Hydrology, 574: 288–307. https://doi.org/10.1016/j.jhydrol.2019.04.024 |
Patterson, L. A., Lutz, B., Doyle, M. W., 2013. Climate and Direct Human Contributions to Changes in Mean Annual Streamflow in the South Atlantic, USA. Water Resources Research, 49(11): 7278–7291. https://doi.org/10.1002/2013wr014618 |
Pike, J. G., 1964. The Estimation of Annual Run-off from Meteorological Data in a Tropical Climate. Journal of Hydrology, 2(2): 116–123. https://doi.org/10.1016/0022-1694(64)90022-8 |
Porporato, A., Daly, E., Rodriguez-Iturbe, I., 2004. Soil Water Balance and Ecosystem Response to Climate Change. The American Naturalist, 164(5): 625–632. https://doi.org/10.1086/424970 |
Rice, J. S., Emanuel, R. E., Vose, J. M., et al., 2015. Continental U. S. Streamflow Trends from 1940 to 2009 and Their Relationships with Watershed Spatial Characteristics. Water Resources Research, 51(8): 6262–6275. https://doi.org/10.1002/2014wr016367 |
Roderick, M. L., Farquhar, G. D., 2011. A Simple Framework for Relating Variations in Runoff to Variations in Climatic Conditions and Catchment Properties. Water Resources Research, 47(12): W00G07. https://doi.org/10.1029/2010wr009826 |
Sagarika, S., Kalra, A., Ahmad, S., 2014. Evaluating the Effect of Persistence on Long-Term Trends and Analyzing Step Changes in Streamflows of the Continental United States. Journal of Hydrology, 517: 36–53. https://doi.org/10.1016/j.jhydrol.2014.05.002 |
Sang, Y. F., Sivakumar, B., Zhang, Y. C., 2020. Is there an Underestimation of Long-Term Variability of Streamflow across the Continental United States? Journal of Hydrology, 581: 124365. https://doi.org/10.1016/j.jhydrol.2019.124365 |
Sankarasubramanian, A., Vogel, R. M., Limbrunner, J. F., 2001. Climate Elasticity of Streamflow in the United States. Water Resources Research, 37(6): 1771–1781. https://doi.org/10.1029/2000wr900330 |
Senatore, A., Parrello, C., Almorox, J., et al., 2020. Exploring the Potential of Temperature-Based Methods for Regionalization of Daily Reference Evapotranspiration in Two Spanish Regions. Journal of Irrigation and Drainage Engineering, 146(3): 1–13. https://doi.org/10.1061/(asce)ir.1943-4774.0001447 |
Shao, Q. X., Traylen, A., Zhang, L., 2012. Nonparametric Method for Estimating the Effects of Climatic and Catchment Characteristics on Mean Annual Evapotranspiration. Water Resources Research, 48(3): W03517. https://doi.org/10.1029/2010wr009610 |
Shirmohammadi-Aliakbarkhani, Z., Saberali, S. F., 2020. Evaluating of Eight Evapotranspiration Estimation Methods in Arid Regions of Iran. Agricultural Water Management, 239: 106243. https://doi.org/10.1016/j.agwat.2020.106243 |
Sivapalan, M., Yaeger, M. A., Harman, C. J., et al., 2011. Functional Model of Water Balance Variability at the Catchment Scale: 1. Evidence of Hydrologic Similarity and Space-Time Symmetry. Water Resources Research, 47(2): W02522. https://doi.org/10.1029/2010wr009568 |
Sun, Y., Tian, F. Q., Yang, L., et al., 2014. Exploring the Spatial Variability of Contributions from Climate Variation and Change in Catchment Properties to Streamflow Decrease in a Mesoscale Basin by Three Different Methods. Journal of Hydrology, 508: 170–180. https://doi.org/10.1016/j.jhydrol.2013.11.004 |
Todorovic, M., Karic, B., Pereira, L. S., 2013. Reference Evapotranspiration Estimate with Limited Weather Data across a Range of Mediterranean Climates. Journal of Hydrology, 481: 166–176. https://doi.org/10.1016/j.jhydrol.2012.12.034 |
Tomer, M. D., Schilling, K. E., 2009. A Simple Approach to Distinguish Land-Use and Climate-Change Effects on Watershed Hydrology. Journal of Hydrology, 376(1/2): 24–33. https://doi.org/10.1016/j.jhydrol.2009.07.029 |
Turc, L., 1953. Le Bilan D'Eau Des Sols: Relation Entre Les Precipitations, L'Evaporation er L'Ecoulement. Ann. Agron., 5: 491–569 |
Veettil, B. K., Kamp, U., 2021. Glacial Lakes in the Andes under a Changing Climate: A Review. Journal of Earth Science, 32(6): 1575–1593. https://doi.org/10.1007/s12583-020-1118-z |
Wang, D. B., Hejazi, M., 2011. Quantifying the Relative Contribution of the Climate and Direct Human Impacts on Mean Annual Streamflow in the Contiguous United States. Water Resources Research, 47(10): W00J12. https://doi.org/10.1029/2010wr010283 |
Wang, D. D., Yu, X. X., Jia, G. D., et al., 2019. Sensitivity Analysis of Runoff to Climate Variability and Land-Use Changes in the Haihe Basin Mountainous Area of North China. Agriculture, Ecosystems & Environment, 269: 193–203. https://doi.org/10.1016/j.agee.2018.09.025 |
Wang, H., He, K. N., 2017. Sensitivity Analysis of the Effects of Climate Change on Streamflow Using Climate Elasticity in the Luan River Basin, China. Polish Journal of Environmental Studies, 26(2): 837–845. https://doi.org/10.15244/pjoes/66715 |
Wang, T. H., Yang, H. B., Yang, D. W., et al., 2018. Quantifying the Streamflow Response to Frozen Ground Degradation in the Source Region of the Yellow River within the Budyko Framework. Journal of Hydrology, 558: 301–313. https://doi.org/10.1016/j.jhydrol.2018.01.050 |
Wang, W. G., Zou, S., Shao, Q. X., et al., 2016. The Analytical Derivation of Multiple Elasticities of Runoff to Climate Change and Catchment Characteristics Alteration. Journal of Hydrology, 541: 1042–1056. https://doi.org/10.1016/j.jhydrol.2016.08.014 |
Xu, X. Y., Yang, D. W., Yang, H. B., et al., 2014. Attribution Analysis Based on the Budyko Hypothesis for Detecting the Dominant Cause of Runoff Decline in Haihe Basin. Journal of Hydrology, 510: 530–540. https://doi.org/10.1016/j.jhydrol.2013.12.052 |
Yang, H. B., Yang, D. W., 2011. Derivation of Climate Elasticity of Runoff to Assess the Effects of Climate Change on Annual Runoff. Water Resources Research, 47(7): W07526. https://doi.org/10.1029/2010wr009287 |
Yang, H. B., Yang, D. W., Hu, Q. F., 2014. An Error Analysis of the Budyko Hypothesis for Assessing the Contribution of Climate Change to Runoff. Water Resources Research, 50(12): 9620–9629. https://doi.org/10.1002/2014wr015451 |
Yang, H. B., Yang, D. W., Lei, Z. D., et al., 2008. New Analytical Derivation of the Mean Annual Water-Energy Balance Equation. Water Resources Research, 44(3): W03410. https://doi.org/10.1029/2007wr006135 |
Yue, S., Pilon, P., Phinney, B., et al., 2002. The Influence of Autocorrelation on the Ability to Detect Trend in Hydrological Series. Hydrological Processes, 16(9): 1807–1829. https://doi.org/10.1002/hyp.1095 |
Zhang, L., Dawes, W. R., Walker, G. R., 2001. Response of Mean Annual Evapotranspiration to Vegetation Changes at Catchment Scale. Water Resources Research, 37(3): 701–708. https://doi.org/10.1029/2000wr900325 |
Zhang, Y., Wang, J. C., Jing, J. H., et al., 2014. Response of Groundwater to Climate Change under Extreme Climate Conditions in North China Plain. Journal of Earth Science, 25(3): 612–618. https://doi.org/10.1007/s12583-014-0443-5 |
Zhao, F. F., Zhang, L., Xu, Z. X., et al., 2010. Evaluation of Methods for Estimating the Effects of Vegetation Change and Climate Variability on Streamflow. Water Resources Research, 46(3): W03505. https://doi.org/10.1029/2009wr007702 |
Zheng, H. X., Zhang, L., Zhu, R. R., et al., 2009. Responses of Streamflow to Climate and Land Surface Change in the Headwaters of the Yellow River Basin. Water Resources Research, 45(7): W00A19. https://doi.org/10.1029/2007wr006665 |
11 a | 20 a | 40 a | 60 a | ||||||||
SD | SI | SD | SI | SD | SI | SD | SI | ||||
QP | 14 | 7 | 56 | 28 | 82 | 49 | 66 | 59 | |||
QET | 13 | 9 | 47 | 53 | 59 | 83 | 64 | 70 | |||
QTmax | 18 | 12 | 66 | 17 | 102 | 32 | 98 | 54 | |||
QTmin | 23 | 27 | 44 | 32 | 53 | 59 | 54 | 68 | |||
Qn | 7 | 17 | 34 | 46 | 69 | 60 | 59 | 64 | |||
Qtotal | 3 | 2 | 30 | 28 | 87 | 47 | 48 | 67 |