
Citation: | Lelin Xing, Yufei Han, Xiaowei Niu, Lei Bai. Gravity Change Caused by Heavy Rainfall Detected by A gPhone Gravimeter in Zhengzhou, China. Journal of Earth Science, 2024, 35(4): 1273-1276. doi: 10.1007/s12583-021-1568-y |
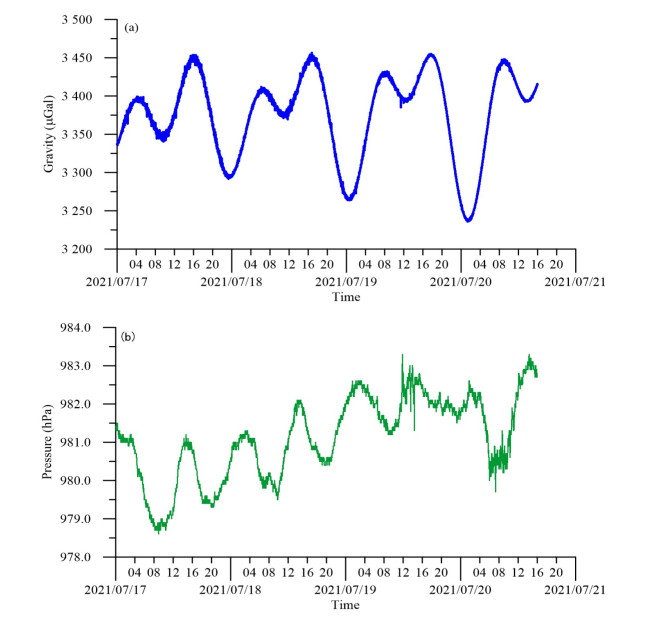
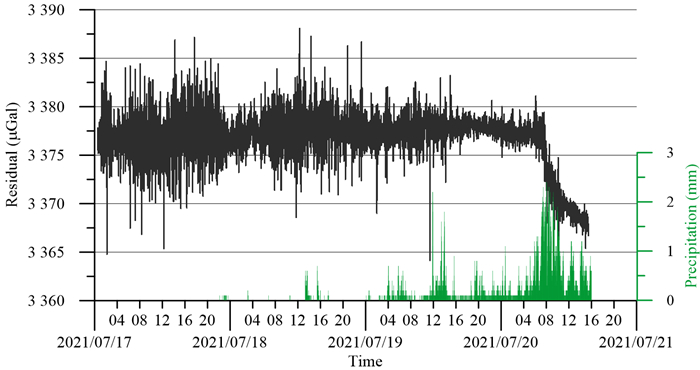
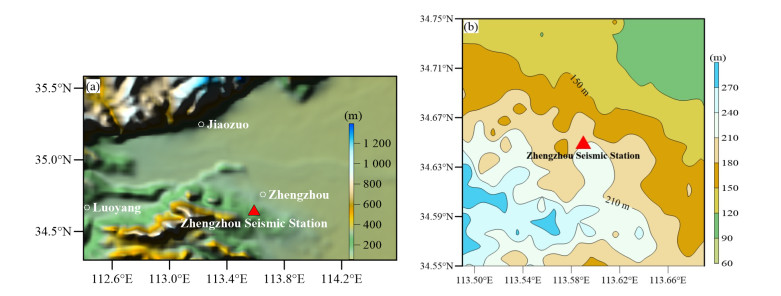
The short-term effect of heavy rainfall on gPhone gravimeter observation at Zhengzhou Seismic Station is investigated. According to the observation data during Jul. 17–20, 2021, the corrected gravity residual reflects the gravimetric response caused by heavy rainfall. The observed gravity change is dominated by the local effect considering topographic effect on gravity. The deduced water depth near the observation station is about 300 mm.
Since July 17, 2021, Henan Province in China has suffered extremely heavy rainfall, among which Zhengzhou City suffered a heavy rainstorm from 8–9 o'clock, with an hourly rainfall of 201.9 mm and heavy water accumulation in many sections on July 20, causing heavy casualties and property losses. According to the annual average rainfall data, the annual rainfall in Zhengzhou is about 640.8 mm, but the average monthly rainfall in July is only 146.2 mm. The rainfall is deemed a rare weather event in climate history in terms of both intensity and influence. Continuous intense rainfall process was exacerbated by severe surface flood. The water has a significant effect on gravity, and the effect is mainly through Newtonian attraction by the mass of water. Although gravity changes associated with rainfall are often observed because of changes in underground water table or soil moisture, the effects are strongly dependent on climate, weather, geology and the geometric setting of the gravity station (Peng et al., 2021; Wang et al., 2014; Li and Shen, 2011; Imanishi et al., 2006). Imanishi (2000) observed a strong correlation between residual gravity and local rainfall, it shows that a gravity decrease of 1.4 μGal (1 μGal = 1 × 10⁻⁸ m·s-2) induced by a total of 38.5 mm of rainfall in one hour was observed by a superconducting gravimeter. A gPhone gravimeter has been established in Zhengzhou Seismic Station (113.59°E, 34.65°N, 225 m) since 2008 based on the Crustal Movement Observation Network of China (CMONOC). The gravimeter was about 10 m below the ground surface, it can be seen as an underground station (Figure 1).
In this paper, we investigate the short-term of effect of heavy rainfall on gravity observed at the Zhengzhou Seismic Station using rainfall data as well as gravimeter data. Newtonian and loading attraction by the mass of flood water above the gravimeter will be shown.
The raw gravity data of gPhone gravimeter can be downloaded from the Gravity Network Center of China (GNCC) in Wuhan through Internet in real time. The raw data was in 1 Hz sample rate along with the observed barometric pressure variations and stored in daily files of the Tsoft format (Van Camp and Vauterin, 2005). Rainfall is also recorded every 1 min routinely. Flooding caused a power outage for several days, and the raw gravity records were interrupted in 00:00:01, July 21. Raw data are changed to minute sampling data using a low-pass filter with a cut-off frequency of 720 cpd (circle per day). It was shown in Figure 2.
Before using the gravity data for the study of short-term rainfall effects, major instrumental perturbations such as spikes, earthquakes, steps and gaps should be corrected. The minute re-sampling data has no these perturbations described as above. To obtain the effect of short-term rainfall on gravity, the filtered gravity data need to be corrected for other geophysical contributions such as Earth tide, pressure and polar motion. We used DDW model (Dehant et al., 1999) for Earth tide correction, and -0.3 μGal·hPa-1 of atmosphere pressure admittance value for atmospheric pressure correction. The pole tide, induced by polar motion and length-of-day variations, was modeled using daily Earth orientation parameters provided by the International Earth Rotation Service (ftp://hpiers.obspm.fr/iers/eop/eopc04/). The gravity sensor of the gPhone system consists of a low drift, and the instrument drift correction was neglected due to the length of the observation time is less than three days. Finally, the corrected gravity residual in 1 min sample rate was obtained using Tsoft (Van Camp and Vauterin, 2005) as shown in Figure 3.
Gravity changed caused by heavy rainfall at Zhengzhou Seismic Station was shown in Figure 3. This is the heaviest rainfall events since 1951. After correction for tidal and atmospheric effects, it can be seen that the residual gravity stayed at a steady value but with a large amplitude, the amplitude was over 5 μGal, and gravity change caused by heavy rainfall was clearly detected since 7 o'clock on July 20. There is no noticeable time lag in the response of gravity to rainfall. The decrease in gravity continued with the accumulation of rainfall. A significant gravity change (near 10 μGal) was observed, which has a significant correlation with the rainfall in Zhengzhou Seismic Station in time, and the change amplitude is far greater than the observation error of the gPhone gravimeter. Unfortunately, we can not estimate the gravity recovery response due to the interrupted of the gPhone gravimeter. The total magnitude of the gravity change is about 10 μGal, the cumulative rainfall is 408.5 mm in Zhengzhou Seismic Station (7:00–8:00 on July 20), and the ratio of the rainfall amount (in mm) and the gravity change (in μGal) is -0.025 μGal·mm-1.
Because the gravity change depends on the relative height of the observation point, if the height of the gPhone's sensor is higher than the attraction point mass, then the gravity will increase due to the flood water mass is below the observation point (Zhou et al., 2014). For the local area, the gravity will decrease because the flood water mass is on the above of the station due to the terrain is flat (Figure 1). Therefore, short-term rainfall affects gravity, but the change trend depends on the height of observation point and its surrounding topography. The average elevation of Zhengzhou is about 108 m, the overall terrain is high in the southwest and low in the northeast with a ladder decline, and the Zhengzhou Seismic Station is located in the southwest of Zhengzhou (Figure 1), so the gravity change due to topographic effect should be considered. To estimate topography effect on gravity change, precipitation and the surrounding topography should be considered. Due to lack of precipitation data in the other stations of Henan Province, we can not estimate the topography effect on gravity change accurately. However, there is no doubt that flood at the lower height has an increasing effect on gravity, next we will compute the topography effect on gravity. Although rainfall is not the same concept as the water storage depth near the observation station, the water storage depth is affected by rainfall directly.
The gravity variations due to hydrology can be separated into two major scales: local (Ψ≤0.1∘) and non-local (0.1∘<Ψ<1∘) (Llubes et al., 2004). The gravitational effect per unit mass with Ψ≤0.1∘ is based on Newton's and cosines laws (Wang et al., 2016)
gN=G(hP−hS)d3 | (1) |
where G is the gravitational constant, d is the direct distance to the point mass of one kg, hS and hP are the heights of the gravimeter and the point mass respectively.
The loading effect per unit mass is computed using Green's function formalism as given by Farrell (1972).
gL=−gM∞∑n=02hn−(n+1)knPn(cosΨ) | (2) |
where the hn and kn symbols represent the load Love number, M is the Earth's mass, g is the mean surface gravity and Pn are the Legendre polynomials. To accelerate the computation, the loading effect is interpolated from tabulated values given by Wang et al. (2012).
The local effect within 0.1° was estimated with NASA Shuttle Radar Topography Mission Global 1 arc second elevation data from the SRTMGL1v003 product (https://lpdaac.usgs.gov/products/srtmgl1v003/), and the non-local effect was estimated with ETOPO1(https://www.ngdc.noaa.gov/mgg/global/global.html) data, which is a 1 arc-minute global relief model of Earth's surface that integrates land topography and ocean bathymetry. Here, we used SRTM and ETOPO1 data to compute the topography effect according to the different water storage height: 150, 200, 250, 300, 350, 400, and 450 mm. The estimated water storage height effect on gravity is depicted in Table 1.
Water storage height (mm) | Non-local (μGal) | Local (μGal) | Total (μGal) |
150 | 0.21 | -5.48 | -5.27 |
200 | 0.28 | -7.30 | -7.02 |
250 | 0.36 | -9.13 | -8.77 |
300 | 0.43 | -10.95 | -10.52 |
350 | 0.50 | -12.78 | -12.28 |
400 | 0.57 | -14.61 | -14.04 |
450 | 0.63 | -16.44 | -15.81 |
According to the Henan Meteorological Service, heavy rain occurred in Zhengzhou, Xinxiang, Jiaozuo, Luoyang and other cities, there were 1 163 rainfall stations with precipitation of over than 50 mm, of which 816 were over than 100 mm and 176 were over than 250 mm on July 20. The maximum precipitation is 672.0 mm occurred in Houzhai Town, Zhengzhou. The maximum hourly rainfall intensity appeared in Zhengzhou, which is about 201.9 mm. As we know, this event is very extremely rare, the rain formed a flood spread all over Zhengzhou, several other cities were paralyzed by flood waters, with cars submerged and tunnels flooded (about 300 mm water depth). The average precipitation is 458.2 mm in Zhengzhou City and 150 mm in Henan Province.
The estimated gravity change considering the load effect and the gravitational force of water at the same time is ranged from -5.27 to 18.81 μGal. The simulations show that non-local effect on gravity is positive, which means gravity increase, and the local effect on gravity is negative, which means gravity decrease, the local effect is larger than the non-local effect, and the total effect on gravity is negative. Because of the gravitational property that gravitation is proportional to the square of distance, the contribution of water mass in the near field dominates that from a far filed, and also considering that the rainfall is not uniform within the calculated area, we can use the observed gravity change to deduce the depth of water storage near the observation station. So we can get a conclusion that the average depth is about 300 mm, which is less than the accumulation of rainfall (408.5 mm).
Research has shown that the short-term of heavy rainfall on gravity observed at the Zhengzhou Seismic Station can be observed by using the gPhone gravimeter. The gravity series measured by gPhone gravimeter contains several geophysical contributions, after re-sampling and correcting the solid Earth tide, polar motion, atmospheric loading effects, the residual gravity stayed at a steady value but with a large amplitude, the amplitude was over 5 μGal, and gravity response caused by rainfall was clearly detected as gravity decrease since 7 o'clock on July 20, which has a significant correlation with the rainfall in time, and the change amplitude is far greater than the observation error of the instrument. The decrease in gravity continued with the accumulation of rainfall. The deduced water depth of surface ponding near the observation station is about 300 mm.
ACKNOWLEDGMENTS: We are very grateful to two anonymous reviewers for their helpful and constructive comments and suggestions, which greatly improved our manuscript. This study is supported by the National Natural Science Foundation of China (No. 41774093). The final publication is available at Springer via https://doi.org/10.1007/s12583-021-1568-y.Dehant, V., Defraigne, P., Wahr, J. M., 1999. Tides for a Convective Earth. Journal of Geophysical Research: Solid Earth, 104(B1): 1035–1058. https://doi.org/10.1029/1998jb900051 |
Farrell, W. E., 1972. Deformation of the Earth by Surface Loads. Reviews of Geophysics, 10(3): 761–797. https://doi.org/10.1029/rg010i003p00761 |
Imanishi, Y., 2000. Present Status of SG T011 at Matsushiro, Japan. In: Ducarme, B., Barthelemy, J., eds., Proceedings of the Workshop: High Precision Gravity Measurements with Application to Geodynamics and Second GGP Workshop, March 24th to 26th, 1999, Munshbach. 97–102 |
Imanishi, Y., Kokubo, K., Tatehata, H., 2006. Effect of Underground Water on Gravity Observation at Matsushiro, Japan. Journal of Geodynamics, 41(1/2/3): 221–226. https://doi.org/10.1016/j.jog.2005.08.031 |
Li, J., Shen, W. B., 2011. Investigation of the Co-Seismic Gravity Field Variations Caused by the 2004 Sumatra-Andaman Earthquake Using Monthly GRACE Data. Journal of Earth Science, 22(2): 280–291. https://doi.org/10.1007/s12583-011-0181-x |
Llubes, M., Florsch, N., Hinderer, J., et al., 2004. Local Hydrology, the Global Geodynamics Project and CHAMP/GRACE Perspective: Some Case Studies. Journal of Geodynamics, 38(3/4/5): 355–374. https://doi.org/10.1016/j.jog.2004.07.015 |
Peng, Z. R., Hu, Z. W., Wang, L. S., et al., 2021. Spatio-Temporal Characteristics of Ice Sheet Melting in Greenland and Contributions to Sea Level Rise from 2003 to 2015. Earth Science, 46(2): 743–758 (in Chinese with English Abstract) |
Van Camp, M., Vauterin, P., 2005. Tsoft: Graphical and Interactive Software for the Analysis of Time Series and Earth Tides. Computers & Geosciences, 31(5): 631–640. https://doi.org/10.1016/j.cageo.2004.11.015 |
Wang, H. S., Xiang, L. W., Jia, L. L., et al., 2012. Load Love Numbers and Green's Functions for Elastic Earth Models PREM, Iasp91, Ak135, and Modified Models with Refined Crustal Structure from Crust 2.0. Computers & Geosciences, 49: 190–199. https://doi.org/10.1016/j.cageo.2012.06.022 |
Wang, L. S., Chen, C., Du, J. S., et al., 2014. Impact of Water Impoundment of Large Reservoirs on Spatial Variation of Coastal Relative Sea Level in China. Earth Science, 39(11): 1607–1616 (in Chinese with English Abstract) |
Wang, L. S., Chen, C., Ma, X, et al., 2016. A Water Storage Loading Model by SRTM-DEM Data and Surface Response Simulation of Gravity and Deformation in the Three Gorges Reservoir of China. Acta Geodaetica et Cartographica Sinica, 45(10): 1148–1156 (in Chinese with English Abstract) |
Zhou, X., Sun, W. K., Li, H., et al., 2014. Gravity Change Observed in a Local Gravity Network and Its Implication to Seasonal Precipitation in Dali County, Yunnan Province, China. Earthquake Science, 27(1): 79–88. https://doi.org/10.1007/s11589-013-0041-0 |
Water storage height (mm) | Non-local (μGal) | Local (μGal) | Total (μGal) |
150 | 0.21 | -5.48 | -5.27 |
200 | 0.28 | -7.30 | -7.02 |
250 | 0.36 | -9.13 | -8.77 |
300 | 0.43 | -10.95 | -10.52 |
350 | 0.50 | -12.78 | -12.28 |
400 | 0.57 | -14.61 | -14.04 |
450 | 0.63 | -16.44 | -15.81 |