| Citation: | Juan Wu, Chang-Qing Ke, Yu Cai, Zheng Duan. Monitoring Multi-Temporal Changes of Lakes on the Tibetan Plateau Using Multi-Source Remote Sensing Data from 1992 to 2019: A Case Study of Lake Zhari Namco. Journal of Earth Science, 2024, 35(5): 1679-1691. doi: 10.1007/s12583-022-1639-8

|
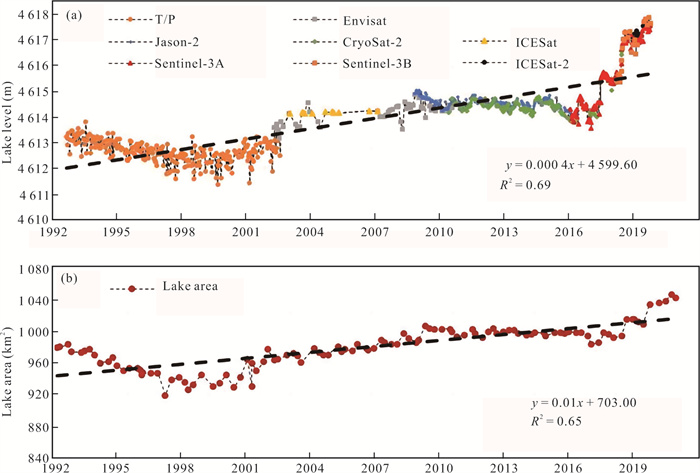
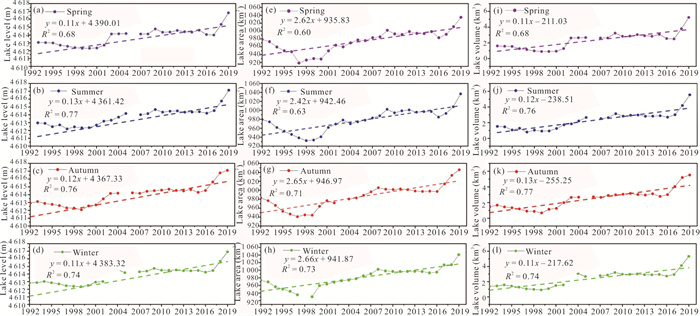
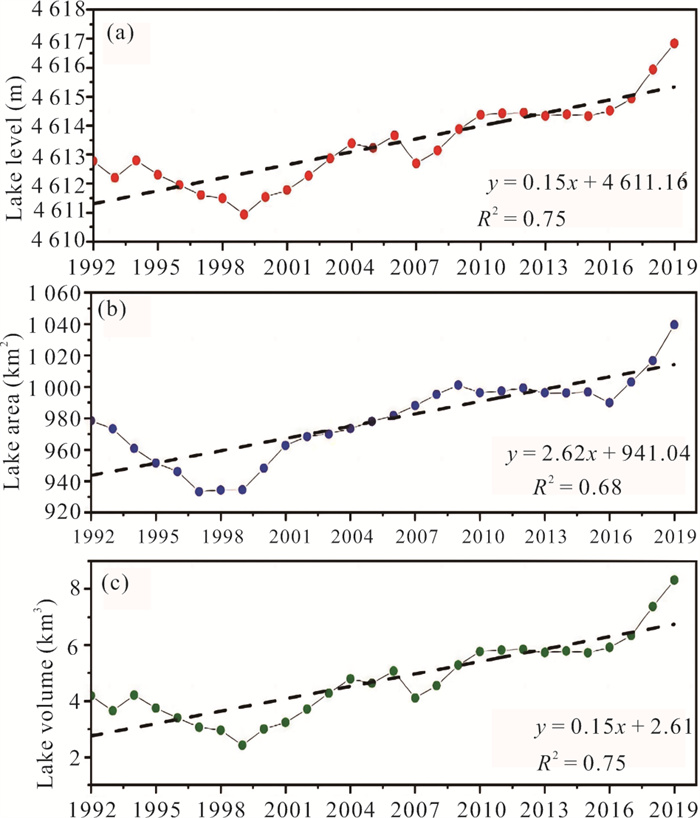
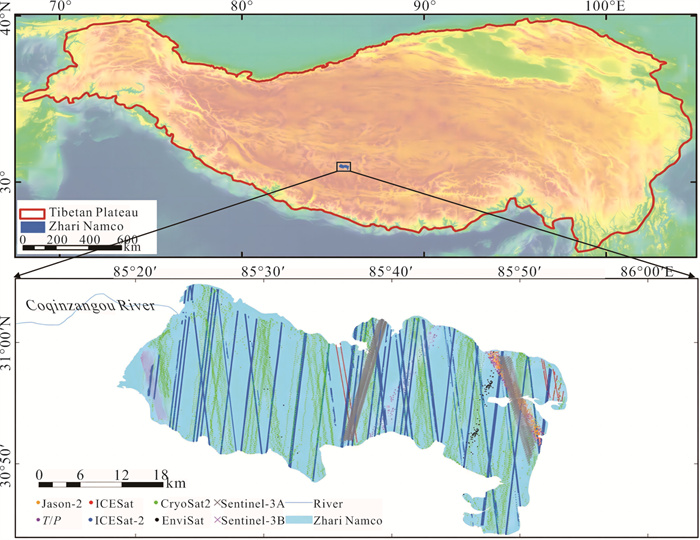
Lake level, area and volume are sensitive indicators of climate change. At present, many studies have focused on the interannual water balance of lakes, but lake level and area can change remarkably with seasons, especially for lakes with seasonal ice cover. Zhari Namco, a seasonal frozen lake, was selected as an example to investigate its seasonal water balance. Multi-source altimetry and Landsat data were used to obtain the seasonal lake level and area from 1992 to 2019, and seasonal lake volume variations were also estimated. The results indicated the average lake level, area and volume in autumn were the largest. The lake level, area, and volume experienced three turning points approximately in 2000, 2010, and 2016, and showed an overall increasing trend from 1992 to 2019, with slopes of 0.15 m/year, 2.17 km2/year, and 0.14 km3/year, respectively. The lake area expanded significantly in autumn, which was related to the abundant precipitation. Delay time of land surface runoff, increased temperature, and evaporation may be the reason for the low lake level and volume in summer. The precipitation was the dominant factor of water balance, which explained 62.09%, 62.43%, and 62.10% of the variations in lake level, area, and volume, respectively.

| Abshire, J. B., Sun, X. L., Riris, H., et al., 2005. Geoscience Laser Altimeter System (GLAS) on the ICESat Mission: On-Orbit Measurement Performance. Geophysical Research Letters, 32(21): L21S02. https://doi.org/10.1029/2005gl024028 |
| Bhang, K. J., Schwartz, F. W., Braun, A., 2007. Verification of the Vertical Error in C-Band SRTM DEM Using ICESat and Landsat-7, Otter Tail County, MN. IEEE Transactions on Geoscience and Remote Sensing, 45(1): 36–44. https://doi.org/10.1109/tgrs.2006.885401 |
| Birkett, C., 2000. Synergistic Remote Sensing of Lake Chad Variability of Basin Inundation. Remote Sensing of Environment, 72(2): 218–236. https://doi.org/10.1016/s0034-4257(99)00105-4 |
| Brun, F., Berthier, E., Wagnon, P., et al., 2017. A Spatially Resolved Estimate of High Mountain Asia Glacier Mass Balances from 2000 to 2016. Nature Geoscience, 10: 668–673. https://doi.org/10.1038/ngeo2999 |
| Cai, Y., Ke, C. Q., Li, X. G., et al., 2019. Variations of Lake Ice Phenology on the Tibetan Plateau from 2001 to 2017 Based on MODIS Data. Journal of Geophysical Research: Atmospheres, 124(2): 825–843. https://doi.org/10.1029/2018jd028993 |
| Cai, Y., Ke, C. Q., Shen, X. Y., 2020. Variations in Water Level, Area and Volume of Hongze Lake, China from 2003 to 2018. Journal of Great Lakes Research, 46(6): 1511–1520. https://doi.org/10.1016/j.jglr.2020.08.024 |
| Capó, M., Pérez, A., Lozano, J. A., 2017. An Efficient Approximation to the K-Means Clustering for Massive Data. Knowledge-Based Systems, 117: 56–69. https://doi.org/10.1016/j.knosys.2016.06.031 |
| Crétaux, J. F., Arsen, A., Calmant, S., et al., 2011. SOLS: A Lake Database to Monitor in the near Real Time Water Level and Storage Variations from Remote Sensing Data. Advances in Space Research, 47(9): 1497–1507. https://doi.org/10.1016/j.asr.2011.01.004 |
| Donlon, C., Berruti, B., Buongiorno, A., et al., 2012. The Global Monitoring for Environment and Security (GMES) Sentinel-3 Mission. Remote Sensing of Environment, 120: 37–57. https://doi.org/10.1016/j.rse.2011.07.024 |
| Du, Y., Zhang, Y. H., Ling, F., et al., 2016. Water Bodies' Mapping from Sentinel-2 Imagery with Modified Normalized Difference Water Index at 10-m Spatial Resolution Produced by Sharpening the SWIR Band. Remote Sensing, 8(4): 354. https://doi.org/10.3390/rs8040354 |
| Duan, Z., Bastiaanssen, W. G. M., 2013. Estimating Water Volume Variations in Lakes and Reservoirs from Four Operational Satellite Altimetry Databases and Satellite Imagery Data. Remote Sensing of Environment, 134: 403–416. https://doi.org/10.1016/j.rse.2013.03.010 |
| ESA (European Space Agency, Mullar Space Science Laboratory), 2012. CryoSat Product Handbook DLFE-3605, 101 |
| Fang, C. Y., Lai, Z. Q., Jing-yuanl, Y., et al., 2011. Study on the Nonuniform Spatial Distribution of Water Level in Poyang Lake Based on ASAR Images and DEM. Procedia Environmental Sciences, 10: 2540–2546. https://doi.org/10.1016/j.proenv.2011.09.395 |
|
Hall, D. K., Riggs, G. A., Salomonson, V. V., 2001. Algorithm Theoretical Basis Document (ATBD) for the MODIS Snow and Sea Ice-Mapping Algorithms. |
| He, Y. Z., Yue, D. P., Da, X., et al., 2016. A Preliminary Study on Impact of Climatic Change and Human Activity on Water Resources: Taking Shaanxi Province as an Example. Acta Agriculturae Jiangxi, 28(12): 87–93 (in Chinese with English Abstract) |
| Jain, S. K., Singh, R. D., Jain, M. K., et al., 2005. Delineation of Flood-Prone Areas Using Remote Sensing Techniques. Water Resources Management, 19(4): 333–347. https://doi.org/10.1007/s11269-005-3281-5 |
| Jiang, L. G., Nielsen, K., Andersen, O. B., et al., 2017. Monitoring Recent Lake Level Variations on the Tibetan Plateau Using CryoSat-2 SARIn Mode Data. Journal of Hydrology, 544: 109–124. https://doi.org/10.1016/j.jhydrol.2016.11.024 |
| Jiang, L. G., Nielsen, K., Andersen, O. B., et al., 2020. A Bigger Picture of how the Tibetan Lakes Have Changed over the Past Decade Revealed by CryoSat-2 Altimetry. Journal of Geophysical Research: Atmospheres, 125(23): e2020jd033161. https://doi.org/10.1029/2020jd033161 |
| Kleinherenbrink, M., Naeije, M., Slobbe, C., et al., 2020. The Performance of CryoSat-2 Fully-Focussed SAR for Inland Water-Level Estimation. Remote Sensing of Environment, 237: 111589. https://doi.org/10.1016/j.rse.2019.111589 |
| Li, B. Q., Zhang, J. Y., Yu, Z. B., et al., 2017. Climate Change Driven Water Budget Dynamics of a Tibetan Inland Lake. Global and Planetary Change, 150: 70–80. https://doi.org/10.1016/j.gloplacha.2017.02.003 |
| Li, X. D., Long, D., Huang, Q., et al., 2019. High-Temporal-Resolution Water Level and Storage Change Data Sets for Lakes on the Tibetan Plateau during 2000-2017 Using Multiple Altimetric Missions and Landsat-Derived Lake Shoreline Positions. Earth System Science Data, 11(4): 1603–1627. https://doi.org/10.5194/essd-11-1603-2019 |
| Long, Y. N., Yan, S. X., Jiang, C. B., et al., 2019. Inversion of Lake Bathymetry through Integrating Multi-Temporal Landsat and ICESat Imagery. Sensors, 19(13): 2896. https://doi.org/10.3390/s19132896 |
| Loveland, T. R., Irons, J. R., 2016. Landsat 8: The Plans, the Reality, and the Legacy. Remote Sensing of Environment, 185: 1–6. https://doi.org/10.1016/j.rse.2016.07.033 |
| Mann, H. B., 1945. Nonparametric Tests Against Trend. Econometrica, 13(3): 245. https://doi.org/10.2307/1907187 |
| Markus, T., Neumann, T., Martino, A., et al., 2017. The Ice, Cloud, and Land Elevation Satellite-2 (ICESat-2): Science Requirements, Concept, and Implementation. Remote Sensing of Environment, 190: 260–273. https://doi.org/10.1016/j.rse.2016.12.029 |
| McFeeters, S. K., 1996. The Use of the Normalized Difference Water Index (NDWI) in the Delineation of Open Water Features. International Journal of Remote Sensing, 17(7): 1425–1432. https://doi.org/10.1080/01431169608948714 |
| McFeeters, S., 2013. Using the Normalized Difference Water Index (NDWI) within a Geographic Information System to Detect Swimming Pools for Mosquito Abatement: A Practical Approach. Remote Sensing, 5(7): 3544–3561. https://doi.org/10.3390/rs5073544 |
| Medina, C. E., Gomez-Enri, J., Alonso, J. J., et al., 2008. Water Level Fluctuations Derived from ENVISAT Radar Altimeter (RA-2) and In-Situ Measurements in a Subtropical Waterbody: Lake Izabal (Guatemala). Remote Sensing of Environment, 112(9): 3604–3617. https://doi.org/10.1016/j.rse.2008.05.001 |
| Medina, C., Gomez-Enri, J., Alonso, J. J., et al., 2010. Water Volume Variations in Lake Izabal (Guatemala) from in situ Measurements and ENVISAT Radar Altimeter (RA-2) and Advanced Synthetic Aperture Radar (ASAR) Data Products. Journal of Hydrology, 382(1/2/3/4): 34–48. https://doi.org/10.1016/j.jhydrol.2009.12.016 |
|
NSIDC, 2012. The Transformation between T/P Ellipsoid and WGS84. |
| Olthof, I., 2017. Mapping Seasonal Inundation Frequency (1985–2016) along the St-John River, New Brunswick, Canada Using the Landsat Archive. Remote Sensing, 9(2): 143. https://doi.org/10.3390/rs9020143 |
| Pan, F. F., Nichols, J., 2013. Remote Sensing of River Stage Using the Cross-Sectional Inundation Area-River Stage Relationship (IARSR) Constructed from Digital Elevation Model Data. Hydrological Processes, 27(25): 3596–3606. https://doi.org/10.1002/hyp.9469 |
| Pekel, J. F., Cottam, A., Gorelick, N., et al., 2016. High-Resolution Mapping of Global Surface Water and Its Long-Term Changes. Nature, 540: 418–422. https://doi.org/10.1038/nature20584 |
| Pradhan, B., Tehrany, M. S., Jebur, M. N., 2016. A New Semiautomated Detection Mapping of Flood Extent from TerraSAR-X Satellite Image Using Rule-Based Classification and Taguchi Optimization Techniques. IEEE Transactions on Geoscience and Remote Sensing, 54(7): 4331–4342. https://doi.org/10.1109/tgrs.2016.2539957 |
| Qiao, B. J., Zhu, L. P., Yang, R. M., 2019. Temporal-Spatial Differences in Lake Water Storage Changes and Their Links to Climate Change Throughout the Tibetan Plateau. Remote Sensing of Environment, 222: 232–243. https://doi.org/10.1016/j.rse.2018.12.037 |
| Rahman, M. A., Lou, Y. S., Sultana, N., 2017. Analysis and Prediction of Rainfall Trends over Bangladesh Using Mann-Kendall, Spearman's Rho Tests and ARIMA Model. Meteorology and Atmospheric Physics, 129(4): 409–424. https://doi.org/10.1007/s00703-016-0479-4 |
| Schutz, B. E., Zwally, H. J., Shuman, C. A., et al., 2005. Overview of the ICESat Mission. Geophysical Research Letters, 32(21): L21S01. https://doi.org/10.1029/2005gl024009 |
| Schwatke, C., Dettmering, D., Bosch, W., et al., 2015. DAHITI–An Innovative Approach for Estimating Water Level Time Series over Inland Waters Using Multi-Mission Satellite Altimetry. Hydrology and Earth System Sciences, 19(10): 4345–4364. https://doi.org/10.5194/hess-19-4345-2015 |
|
Sentinel-3-Team, 2017. Sentinel-3 User Handbook. European Space Agency (ESA). |
| Shu, S., Liu, H. X., Beck, R. A., et al., 2020. Analysis of Sentinel-3 SAR Altimetry Waveform Retracking Algorithms for Deriving Temporally Consistent Water Levels over Ice-Covered Lakes. Remote Sensing of Environment, 239: 111643. https://doi.org/10.1016/j.rse.2020.111643 |
| Smith, L. C., 1997. Satellite Remote Sensing of River Inundation Area, Stage, and Discharge: A Review. Hydrological Processes, 11(10): 1427–1439. https://doi.org/10.1002/(sici)1099-1085(199708)11:101427:aid-hyp473>3.3.co;2-j doi: 10.1002/(sici)1099-1085(199708)11:101427:aid-hyp473>3.3.co;2-j |
| Smith, L. C., Pavelsky, T. M., 2009. Remote Sensing of Volumetric Storage Changes in Lakes. Earth Surface Processes and Landforms, 34(10): 1353–1358. https://doi.org/10.1002/esp.1822 |
| Song, C. Q., Huang, B., Ke, L. H., et al., 2014. Seasonal and Abrupt Changes in the Water Level of Closed Lakes on the Tibetan Plateau and Implications for Climate Impacts. Journal of Hydrology, 514: 131–144. https://doi.org/10.1016/j.jhydrol.2014.04.018 |
|
Song, C. Q., Huang, B., Richards, K., et al., 2014. Accelerated Lake Expansion on the Tibetan Plateau in the 2000s: Induced by Glacial Melting or other Processes? Water Resources Research, 50(4): 3170–3186. |
| Song, C. Q., Ye, Q. H., Cheng, X., 2015. Shifts in Water-Level Variation of Namco in the Central Tibetan Plateau from ICESat and CryoSat-2 Altimetry and Station Observations. Science Bulletin, 60(14): 1287–1297. https://doi.org/10.1007/s11434-015-0826-8 |
| Song, K. S., Liu, G., Wang, Q., et al., 2020. Quantification of Lake Clarity in China Using Landsat OLI Imagery Data. Remote Sensing of Environment, 243: 111800. https://doi.org/10.1016/j.rse.2020.111800 |
| Sridevi, T., Sharma, R., Mehra, P., et al., 2016. Estimating Discharge from the Godavari River Using ENVISAT, Jason-2, and SARAL/AltiKa Radar Altimeters. Remote Sensing Letters, 7(4): 348–357. https://doi.org/10.1080/2150704x.2015.1130876 |
| Tao, S. L., Fang, J. Y., Zhao, X., et al., 2015. Rapid Loss of Lakes on the Mongolian Plateau. Proceedings of the National Academy of Sciences of the United States of America, 112(7): 2281–2286. https://doi.org/10.1073/pnas.1411748112 |
| Tong, X. H., Pan, H. Y., Xie, H., et al., 2016. Estimating Water Volume Variations in Lake Victoria over the Past 22 Years Using Multi-Mission Altimetry and Remotely Sensed Images. Remote Sensing of Environment, 187: 400–413. https://doi.org/10.1016/j.rse.2016.10.012 |
| Wang, X. B., Xie, S. P., Zhang, X. L., et al., 2018. A Robust Multi-Band Water Index (MBWI) for Automated Extraction of Surface Water from Landsat 8 OLI Imagery. International Journal of Applied Earth Observation and Geoinformation, 68: 73–91. https://doi.org/10.1016/j.jag.2018.01.018 |
| Wu, G. P., Liu, Y. B., 2015. Capturing Variations in Inundation with Satellite Remote Sensing in a Morphologically Complex, Large Lake. Journal of Hydrology, 523: 14–23. https://doi.org/10.1016/j.jhydrol.2015.01.048 |
| Xu, F. L., Zhang, G. Q., Yi, S., et al., 2022. Seasonal Trends and Cycles of Lake-Level Variations over the Tibetan Plateau Using Multi-Sensor Altimetry Data. Journal of Hydrology, 604: 127251. https://doi.org/10.1016/j.jhydrol.2021.127251 |
| Yang, K., Wu, H., Qin, J., et al., 2014. Recent Climate Changes over the Tibetan Plateau and Their Impacts on Energy and Water Cycle: A Review. Global and Planetary Change, 112: 79–91. https://doi.org/10.1016/j.gloplacha.2013.12.001 |
| Yang, X. W., Wang, N. L., Chen, A. A., et al., 2020. Changes in Area and Water Volume of the Aral Sea in the Arid Central Asia over the Period of 1960–2018 and Their Causes. CATENA, 191: 104566. https://doi.org/10.1016/j.catena.2020.104566 |
| Yao, T. D., Thompson, L., Yang, W., et al., 2012. Different Glacier Status with Atmospheric Circulations in Tibetan Plateau and Surroundings. Nature Climate Change, 2(9): 663–667. https://doi.org/10.1038/nclimate1580 |
| Yuan, C., Gong, P., Liu, C. X., et al., 2019. Water-Volume Variations of Lake Hulun Estimated from Serial Jason Altimeters and Landsat TM/ETM+ Images from 2002 to 2017. International Journal of Remote Sensing, 40(2): 670–692. https://doi.org/10.1080/01431161.2018.1516316 |
| Zhang, G. Q., Chen, W. F., Xie, H. J., 2019. Tibetan Plateau's Lake Level and Volume Changes from NASA's ICESat/ICESat-2 and Landsat Missions. Geophysical Research Letters, 46(22): 13107–13118. https://doi.org/10.1029/2019gl085032 |
| Zhang, G. Q., Xie, H. J., Kang, S. C., et al., 2011. Monitoring Lake Level Changes on the Tibetan Plateau Using ICESat Altimetry Data (2003–2009). Remote Sensing of Environment, 115(7): 1733–1742. https://doi.org/10.1016/j.rse.2011.03.005 |
| Zhang, G. Q., Yao, T. D., Chen, W. F., et al., 2019. Regional Differences of Lake Evolution across China during 1960s–2015 and Its Natural and Anthropogenic Causes. Remote Sensing of Environment, 221: 386–404. https://doi.org/10.1016/j.rse.2018.11.038 |
| Zhang, G. Q., Yao, T. D., Piao, S. L., et al., 2017a. Extensive and Drastically Different Alpine Lake Changes on Asia's High Plateaus during the Past Four Decades. Geophysical Research Letters, 44(1): 252–260. https://doi.org/10.1002/2016gl072033 |
| Zhang, G. Q., Yao, T. D., Shum, C. K., et al., 2017b. Lake Volume and Groundwater Storage Variations in Tibetan Plateau's Endorheic Basin. Geophysical Research Letters, 44(11): 5550–5560. https://doi.org/10.1002/2017gl073773 |
| Zhang, Y., Zhang, G. Q., Zhu, T. T., 2020a. Seasonal Cycles of Lakes on the Tibetan Plateau Detected by Sentinel-1 SAR Data. Science of the Total Environment, 703: 135563. https://doi.org/10.1016/j.scitotenv.2019.135563 |
| Zhang, G. Q., Yao, T. D., Xie, H. J., et al., 2020b. Response of Tibetan Plateau Lakes to Climate Change: Trends, Patterns, and Mechanisms. Earth-Science Reviews, 208: 103269. https://doi.org/10.1016/j.earscirev.2020.103269 |
| Zhang, X., Wu, Y. H., Zhang, X., 2015. Zhari Namco Water Level Change Detection Using Multi-Satellite Altimetric Data during 1992–2012. Journal of Natural Resources, 30(7): 1153–1162 (in Chinese with English Abstract) |
| Zhao, W., Xiong, D. H., Wen, F. P., et al., 2020. Lake Area Monitoring Based on Land Surface Temperature in the Tibetan Plateau from 2000 to 2018. Environmental Research Letters, 15(8): 084033. https://doi.org/10.1088/1748-9326/ab9b41 |
| Zheng, J. J., Ke, C. Q., Shao, Z. D., et al., 2016. Monitoring Changes in the Water Volume of Hulun Lake by Integrating Satellite Altimetry Data and Landsat Images between 1992 and 2010. Journal of Applied Remote Sensing, 10(1): 016029. https://doi.org/10.1117/1.jrs.10.016029 |
| Zwenzner, H., Voigt, S., 2009. Improved Estimation of Flood Parameters by Combining Space Based SAR Data with very High Resolution Digital Elevation Data. Hydrology and Earth System Sciences, 13(5): 567–576. https://doi.org/10.5194/hess-13-567-2009 |
Figures(6) / Tables(1)
Copyright © 2013-2020 Journal of Earth Science 鄂ICP备15021562号-2
Tel: +86-27-67885075 Fax: +86-27-67885075 E-mail: xbb@cug.edu.cn
Address: Editorial Office of Journal, China University of Geosciences, Yujiashan, Wuhan, Hubei 430074, P. R. China
Supported by:
Beijing Renhe Information Technology Co. Ltd
E-mail:
info@rhhz.net


 DownLoad: