Processing math: 100%
Advanced Search

Indexed by SCI、CA、РЖ、PA、CSA、ZR、etc .

Zhen Ye, Qiang Xu, Qian Liu, Xiujun Dong, Feng Pu. 3D Distinct Element Back Analysis Based on Rock Structure Modelling of SfM Point Clouds: The Case of the 2019 Pinglu Rockfall of Kaili, China. Journal of Earth Science, 2024, 35(5): 1568-1582. doi: 10.1007/s12583-022-1667-4
Citation: Zhen Ye, Qiang Xu, Qian Liu, Xiujun Dong, Feng Pu. 3D Distinct Element Back Analysis Based on Rock Structure Modelling of SfM Point Clouds: The Case of the 2019 Pinglu Rockfall of Kaili, China. Journal of Earth Science, 2024, 35(5): 1568-1582. doi: 10.1007/s12583-022-1667-4

3D Distinct Element Back Analysis Based on Rock Structure Modelling of SfM Point Clouds: The Case of the 2019 Pinglu Rockfall of Kaili, China

doi: 10.1007/s12583-022-1667-4
More Information
  • Corresponding author: Qiang Xu, xq@cdut.edu.cn
  • Received Date: 22 Dec 2021
  • Accepted Date: 07 Apr 2022
  • Issue Publish Date: 30 Oct 2024
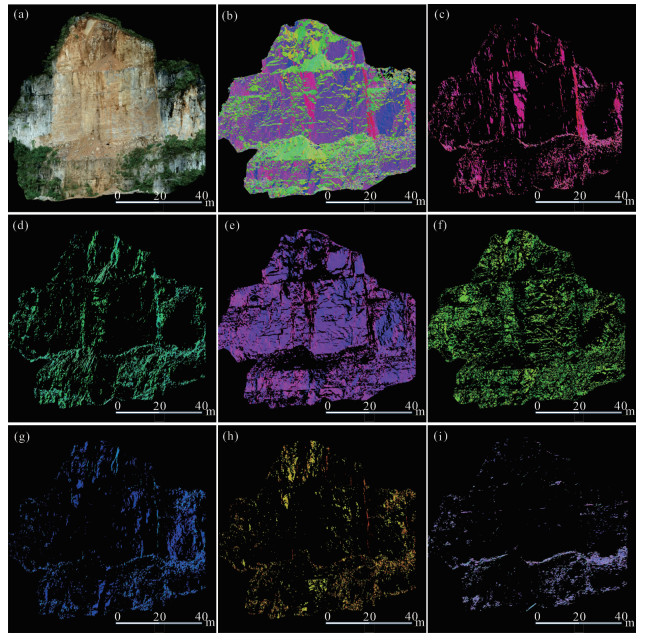
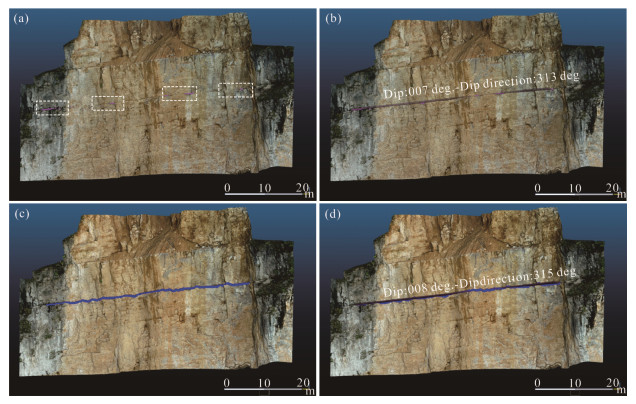
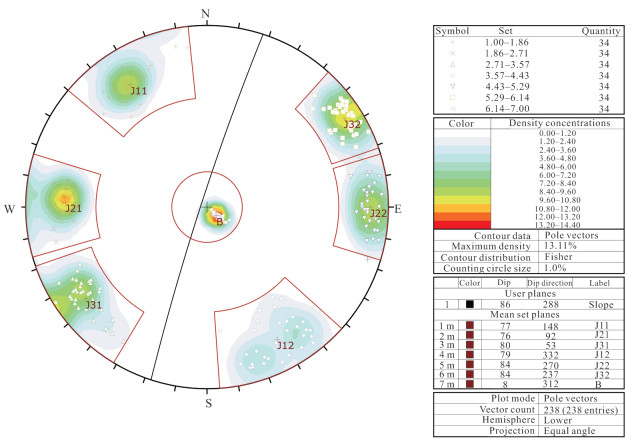
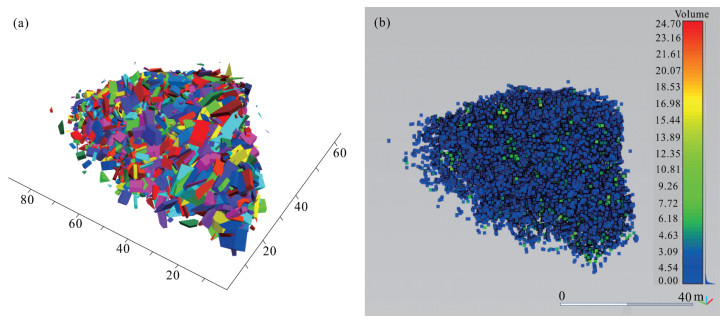
  • This paper introduces the use of point cloud processing for extracting 3D rock structure and the 3DEC-related reconstruction of slope failure, based on a case study of the 2019 Pinglu rockfall. The basic processing procedure involves: (1) computing the point normal for HSV-rendering of point cloud; (2) automatically clustering the discontinuity sets; (3) extracting the set-based point clouds; (4) estimating of set-based mean orientation, spacing, and persistence; (5) identifying the block-forming arrays of discontinuity sets for the assessment of stability. The effectiveness of our rock structure processing has been proved by 3D distinct element back analysis. The results show that SfM modelling and rock structure computing provides enormous cost, time and safety incentives in standard engineering practice.


  • Conflict of Interest
    The authors declare that they have no conflict of interest.
  • Rockfall is one of the most typical types of geological disasters in mountainous areas, and it often poses a greater threat to human safety, houses and roads and other infrastructures (Luo et al., 2022; Emmer, 2018; Priest, 1993). The boundaries of the rock blocks are formed by intersecting discontinuities, which significantly influence on the stability of the rock slope (Stead and Wolter, 2015; Curtaz et al., 2014; Fanti et al., 2013). Generally, the initial deformation of these source areas is not randomly distributed but is comprehensively controlled by regional geological structure and environmental factors (Li et al., 2020; Lato et al., 2009; Sturzenegger et al., 2007). Large-scale tectonic activities, earthquakes, heavy precipitation, discontinuities, weathering, man-made engineering disturbances and other factors may cause rockfall to occur instantaneously (Gigli et al., 2014; Humair et al., 2013; Abellán et al., 2010). Therefore, accurate detection of the discontinuities affecting the rock mass is very important because it determines how the kinematically removable block is formed (Zhang et al., 2021; Verma et al., 2019; Copons and Vilaplana, 2008).

    The rapid development of remote sensing technology and computer performance has greatly promoted the development of the research field of 3D rock structure detection (Liu et al., 2021; Fekete and Diederichs, 2013). In recent years, the use of geomatics techniques such as light detection and ranging (LiDAR) and unmanned aerial vehicle (UAV) digital photogrammetry can quickly capture high-resolution rock outcrops as point clouds (Ma et al., 2022; Danzl et al., 2020; Jaboyedoff et al., 2018). Compared with field mapping and terrestrial photogrammetry or laser scanner surveys, UAV photogrammetry has more advantages for detecting inaccessible and dangerous rock outcrops. This low-cost and user-friendly solution can efficiently acquire high-resolution images of the target area. Using the SfM method, a series of two-dimensional images obtained can be directly used to reconstruct high accuracy point clouds of rock outcrops with colorful textures (Menegoni et al., 2019; Giordan et al., 2015; Nex and Remondino, 2014). Rock structure modeling and joint characteristics can be performed manually or automatically, directly from the point cloud (Song et al., 2021). Several different semiautomatic discontinuity detection algorithms have been proposed, such as the discontinuity set extractor (DSE) (Riquelme et al., 2014) and q-Facet (Dewez et al., 2016). These methods can directly extract discontinuity-related statistical parameters, such as orientation, spacing, and persistence, from the point cloud and then generate a discrete fracture network (DFN) (Lollino et al., 2015; Ferrero et al., 2009).

    As introduced above, the methods of acquiring rock structure by close-range remote sensing have been greatly developed in recent years. However, how to better apply these methods to the practice of geological engineering is a research field to be strengthened. In July 2019, a rockfall with a volume of 18 000 m³ occurred in Pinglu near Kaili, Guizhou. The feature of the rockfall is that the failure is caused by the intersection of unfavorable discontinuity sets. Due to the inability to conduct on-site rock structure measurements on the nearly vertical slope over 60 m high, we used drones to perform image surveys of the failure slope. Then the images are processed as the 3D point clouds of the failure slope using Structure from Motion (SfM) technique. In this paper, we focus on how to apply the processing methods we developed in recent years to directly extract 3D rock structure from the 3D point clouds. Finally, we use the extracted 3D rock structure parameters as the inputs of 3D distinct element back analysis to reconstruct the failure of the slope. The results of this study, especially the proved effectiveness of our procedure for processing SfM rock structure applied to block stability assessment, will facilitate the zonation of rockfall hazard of the Kaili area.

    Karstified terrains are unique to southern China and are distributed in large areas in the three provinces of Yunnan, Guizhou and Guangxi (Yuan et al., 1995). The study area is located near Long-Chang Town in northern Kaili City, Guizhou Province, China (Figure 1a). The area is located at the intersection of the Yunnan-Guizhou Plateau and uplifted during the Middle Jurassic Yanshan Movement (Li et al., 2014). The intermittent uplift of the strata in this area since the Cenozoic has intensified the erosion of the flowing water system, forming this typical hilly depression karst landscape. The resulting landscape is karst hills with an average topography of approximately 300 m (Lu et al., 2013; Zhao et al., 2012). Under such natural conditions, physical weathering and karst processes of rock cliffs are common. Among the many rockfall incidents, the rock outcrops that caused the early instability phenomena are controlled by the existing discontinuities. The main reason for the further evolution of rockfall may be long-term weathering and dissolution along these discontinuities. The Pinglu rockfall in July 2019 is located east of the Pinglu River in Longchang Town near Kaili (Figures 1a, 1b). In this area, the development of the river network is consistent with the spatial distribution of the fracture system (Figure 1b). The bimodal distribution of the rockfall deposits (Figure 1c) and the two separate large rupture surfaces (Figure 1d) indicate two consecutive collapse events. This is the typical failure mode in carbonate rock slopes because of the irregular dissolutions along discontinuities. The dissolution on the left side is obviously strong due to the highly weathered areas of yellow or brownish red color (Figure 1d). The light gray areas, more common on the right part, are the ruptures of rock bridges that are just lightly weathered. On the top of the slope, there are two collapsed dolines with an average depth of approximately 25 m and a diameter of approximately 10 m. This type of karst cavities represents the initial location of karstification, which gathers the surficial water that infiltrates downwards along steeply dipping joints, a process of expanding weathering into the interior of the slope (Sauro, 2016; Gutiérrez et al., 2014). This process, i.e., dissolved weathering concentrated along the almost vertical joints of carbonate rocks, often deepens and widens the block-forming discontinuities. Field evidences show that a persistent open vertical joint on the left margin of the detachment area may be the cause of the entire instability. In this study, we will reconstruct the failure process of the slope through the SfM-based investigation and the 3D distinct element back analysis.

    Figure  1.  (a) Location of study area; (b) topography of the Pinglu rockfall; (c) dimension of the deposit area; (d) doline and rock bridge exposed on the cliff.

    The main strata of the failed slope have the following top-down sequences: (1) the massive limestone of Qixia (P2q) and Maokou (P2m) formations of the Permian, (2) the quartz sandstone and shale of Liangshan (P2l) formations of the Permian, and (3) the dolomitite of Baizuo (C1b) formations of Carboniferous. The 60-m-high slope is sub-vertical. Although it impossible for us to conduct the field-based measurements of the complete fracture network of the slope, which is necessary to investigate how the in-situ 3D rock structure control the slope stability, we have established the relationship between the main discontinuity sets and the boundary planes of the detached large rock blocks in the field. As shown in Figure 2a, the four highly persistent discontinuity sets can be identified based on the field documentations. The first set is the flat-lying beddings. Due to the particularly gentle inclination (5°–15°) of the bedding planes, it is difficult to accurately measure its dip direction using compass in the field. This is one of the reasons why we decided to use close-range remote sensing technique to survey the rock structure parameters. The joint set J11 cuts obliquely into the slope, with the dip direction of 120°–160° and dip of 70°–80°. The joint set J21 is persistent and forms the slope face in nearly north-south strike, dipping to east with a dip of 70°–85°. The joint set J31 is another discontinuity group cutting obliquely into the slope, with dip direction of 40°–60° and dip of 70°–85°. As an example, the kinematically removable block delineated by the intersection of J11 and J21 and the bedding planes is shown in Figure 2b. Although the limited accessibility of the terrain makes it difficult to conduct the directly mapping of other geometrical parameters such as the set-based spacing and persistence, the deployed digital acquisition based on SfM in this study can overcome this difficulty very well.

    Figure  2.  Discontinuity sets in the rockfall source areas. (a) A view of mainly discontinuity sets observed in the field; (b) discontinuities intersect with topography to form kinematically removable blocks.

    Traditional geological surveys were carried out on the investigated slopes and surrounding areas to comprehensively evaluate the geological conditions. Due to the influence of karstification, Kaili limestone has different degrees of weathering characteristics. To accurately obtain the physical and mechanical properties of fresh and weathered limestone, a field Schmidt rebound test and density test were performed. At the same time, representative samples were selected for uniaxial compression and electron microscope scanning experiments.

    UAV digital photogrammetry can be used to obtain high-resolution images of rock outcrops that are inaccessible and potentially dangerous without being restricted by complex terrain. Then, SfM software such as Context Capture was used to reconstruct the image into a 3D real scene model and high-accuracy point cloud. In this study, a small quad-rotor UAV platform DJI Phantom 4 RTK (DJI) that provides real-time, centimeter-level positioning data for improved absolute accuracy of image metadata was selected. The relevant technical parameters of the DJI UAV system are shown in Table 1. Remote control is equipped with a display and utilizes the route planning software DJI GS RTK App (GSR) without additional access to other mobile devices.

    Table  1.  Technical parameters of the DJI Phantom 4 RTK
    Weight (g) Dimension (mm) Max flight time (min) GNSS mode Sensor type Sensors size (mm) Image size (pixels) Focal length (mm) Photo ISO Effective pixels (M)
    1 391 289.5 × 289.5 × 213 30 GPS/BDS/Galileo 1″CMOS FOV 84° 8.8/24 5 472 × 3 648 (3 : 2) 8.8 100–3 200 20
     | Show Table
    DownLoad: CSV

    For near-vertical rock cliffs, a close-range manual flight method (Figure 3a) was used so that the horizontal sensor lens was capturing images. To ensure that the complex geometry of the near vertical range of the target outcrop produces the smallest occlusion area, a series of vertical flight trajectories are executed under manual control. For the deposit area, GSR was used to design the route so that it could automatically fly in the range of 50 m to obtain failed block images from all directions. Finally, a total of 5 118 high-resolution images were obtained, of which 840 were obtained by manual control and 4 278 were obtained by automatic flight. The DJI was equipped with GNSS/IMU and network RTK modules, and all the acquired images were georeferenced in an EPSG: 32648 WGS84/UTM zone 48N (datum: World Geodetic System, 1984) metric coordinate system.

    Figure  3.  The workflow of the UAV photogrammetry survey. (a) Manually controlled flight route planning to capture the complex geometry of vertical outcrops; (b), (c) the low-density 3D point cloud obtained by completing the aero triangulation processing; (d), (e) the true color dense point cloud of rockfall.

    For the reconstruction of the 3D scene from 2D images, the SfM-MVS algorithm as implemented in ContextCapture (v 4.3.1) software was used. ContextCapture is professional software developed by Bentley to process images and create 3D models (Figure 3). It supports images with more than 10 billion pixels taken by ordinary cameras and generates 3D models with high geometric accuracy. The processing steps are summarized below, which were completed on a graphics workstation with a 2.20 GHz CPU and 128 GB RAM.

    (1) All 5 118 images are georegistered by the onboard GPS and network RTK module, and 36 fuzzy images are not used for reconstruction.

    (2) Aerial triangulation fully calibrates all images by automatically identifying the relative position and orientation of each image. Automatic 3D reconstruction, texture mapping, and retexturing of ties and reconstruction constraints were employed to ensure highly accurate models. The final aerial triangulation results show that 5 082 of the 5 118 images were calibrated and that the ground coverage area was 0.94 km2.

    (3) The reconstructed sparse (low-density) 3D point cloud model (Figures 3b, 3c) has an average ground resolution of 8.218 29 mm/pixel and a reprojection error (RMS) of 0.6 pixels. There are a total of 545 092 tie points and a median of 48 325 keypoints per image. A dense point cloud with point sampling of approximately 0.008 2 m was generated. The direction and magnitude of the camera position uncertainty calculated by aerial triangulation are shown in Table 2. Using a series of two-dimensional dense images, a 3D point cloud model (Figures 3d, 3e) was developed through the ContextCapture program (i.e., tolerance of 0.5 pixels in the input images). The final 3D point cloud model is exported as an LAS file, and each point is georeferenced in the set coordinate system (X = east, Y = north, positive Z = up). All points have red, green and blue (RGB) color values.

    Table  2.  Quality report of aero triangulation
    Photo position uncertainties Tie point position uncertainties Tie point resolution Reprojection errors per tie point
    X (m) Y (m) Z (m) (m) (m/pixel) (pixels)
    Mean 0.002 29 0.002 14 0.002 21 0.022 11 0.007 88 0.54
    Minimum 0.000 10 0.000 07 0.000 10 0.000 56 0.000 59 0.00
    Maximum 0.424 96 0.326 36 0.543 71 3.710 88 0.210 02 1.82
     | Show Table
    DownLoad: CSV
    Table  3.  Input parameters for the Hough normals computation
    Neighborhood size Number of planes Accumulator steps Number of rotaations Tolerance angle (°) Neighborhood size for density estimation
    10 1 000 15 5 90 5
     | Show Table
    DownLoad: CSV

    The spatial relationship of discontinuities plays a decisive role in the geometry and stability of the separation blocks on the rock slope (Goodman and Bray, 1976). The high-resolution point cloud reconstructed by SfM can be used for accurate remote semiautomatic geomechanical measurements. To identify the discontinuities in the point cloud, the normal of each point is calculated, and the normals are converted into colorful rock structures. CloudCompare provides a series of plugins for computing the normal to point clusters and digitizing geological structures. Obtain the normal component of each point by using the Hough normals computation in CloudCompare (Boulch and Marlet, 2016, 2012). The reason for using the Hough algorithm to calculate the point normal is described in (Dong et al., 2020). After that, the normal vector can be directly converted into the relative orientation of each point, such as the dip direction and dip.

    Commercial point cloud processing software COLTOP-3D provides 3D rock structures with quick identification solutions and friendly visualization effects (Jaboyedoff et al., 2009, 2007; Metzger et al., 2009). This automated method greatly improves the efficiency of identifying 3D rock structures from discrete point cloud data sets. According to the above principles, our HSV color wheel is built through open source Python programming (Liu and Kaufmann, 2015). The hue (H), which is linked here to the dip direction of the normal of a discontinuity, and saturation (S), which is linked here to the dip angle of the normal, define how white a color is (Figure 4). According to this concept, in the HSV color wheel, each pole representing the orientation of a discontinuous normal is assigned a unique HSV color. Both the dip direction and dip angle have a resolution of 1° as poles in equal-angle and low-hemisphere projections. The dip directions from 0° to 360° were simulated by normalizing the whole color types (H values from 0 to 1) to a circle containing 360 degrees of rotation. The saturation (S) of a unique color simulates the discontinuity dip angle, with 0 (white, i.e., a color without any saturation) for a horizontal plane and 1 (a fully saturated color) for a vertical plane. The lightness value (V) is fixed at V = 0.75 so that the HSV wheel has uniform brightness.

    Figure  4.  (a) HSV color scheme with pole orientation; (b) HSV color wheel for fracture normal.

    After the rendering process was completed, the R software package "spherical k-means" was used to perform clustering calculations on the orientation of the joint sets. This package can automatically divide the entire point cloud into multiple subcategories, which is the goal of using the normal orientation clustering set (Liu and Kieffer, 2021; Assali et al., 2014). Then, iterative calculations are used to fit the prototype, during which the partitions converge to a stable solution. Spherical k-means clustering involves maximizing the similarity criterion (see Eq. (1)) between a prototype vector and its associated data.

    Similarity criterion:nbCncos(xb,pn)
    (1)

    where n is the number of clusters to be used in the partition and pn is the prototype of cluster n. xb is the bth vector within cluster n, and Cn is the nth cluster of the partition, cos (x, p) is the cosine similarity between the two vectors. As there is no need for a surface reconstruction step (meshing with 3D triangular facets), this approach can be considered automated processing via direct segmentation. After the clustering calculation is completed, the points assigned to the same set will have completely similar HSV colors. The new scalar value concerning the set membership of each point is added to the result file, meaning that for data management, all data are included in a single R file.

    The main goal of the simulation is to back-analyze the deformation process and failure mechanism of the falling rock. Many authors have applied 3DEC5.2 (Itasca Consulting Group Inc., 2017) software to simulate landslides because it allows the representation of the complete slope geometry and the construction of discrete fracture networks (Ge et al., 2019; Vanneschi et al., 2019; Kim et al., 2015). The discontinuity parameters obtained from the UAV point cloud are used as input for the modeling of the discrete fracture network in the rockfall source areas (Brideau and Stead, 2012; Brideau et al., 2012, 2011). The relevant parameters specified in the model are obtained from field and laboratory tests.

    With the goal of increasing the understanding of the characteristics of the investigated rock masses, relevant tests were carried out in the field and laboratory. Through density tests and uniaxial compression tests of representative rock samples, the dry unit weight (ρ) and unconfined compressive strength (σc) of unweathered and weathered Kaili limestone were obtained. The unweathered sample was retrieved from the inside of the failed block (Figure 5a). The surfaces of the weathered sample are yellow or brownish-red, indicating that a large part of the calcite has been dissolved and removed (Figure 5b). The brownish-red colored surfaces demonstrate the water circulation from the sinkholes on the surface passing through the open joint system. By analyzing the pore structure of the electron microscopy images of the two types of samples at the same magnification, it can be found that the morphology of the rock surface tends to transform into a more complex structure as calcite dissolves (Figures 5c, 5d).

    Figure  5.  In (a), (b) collected fresh and weathered limestone samples; (c), (d) SEM images of fresh and weathered Kaili limestones.

    The dry unit weight of unweathered limestone ranges from 2.60–2.73 g/cm, with an average of approximately 2.66 g/cm, and the weathered limestone ranges from 2.23–2.67 g/cm, with an average of 2.51 g/cm. Since the unweathered samples were retrieved from the interior of the failed blocks, the corresponding dry unit weight is more concentrated than that of the weathered limestone. Weathered limestone can be judged by its surface color, and its density has a large distribution range. In addition, a series of uniaxial compression tests were performed on two types of limestone. The unconfined compressive strength results illustrate the weakening effect of the weathering process on the Kaili limestone. The σc of fresh limestone ranges from 60–87 MPa, with an average of approximately 74 MPa, while that of weathered limestone ranges from 23–49 MPa, with an average of approximately 33 MPa.

    The Schmidt hammer (L type) impact test is carried out in the field by repeatedly impacting a large number of failed blocks on fresh and weathered surfaces (Figures 6a, 6c). According to the normalization method proposed by Basu and Aydin (Basu and Aydin, 2004), the measured rebound index value is processed. For the unweathered surface, the rebound index value of the Schmidt hammer test showed a Gaussian distribution in the range of R = 33–66, with an average of 51 (Figure 6b). For the weathered surface, the rebound index value of the Schmidt hammer test was relatively low in the range of R = 23–65, with an average value of approximately 45 (Figure 6d). The mechanical parameters of intact rock can be calculated according to the empirical equations available in the literature (Buyuksagis and Goktan, 2007; Aydin and Basu, 2005; Fener et al., 2005). Therefore, the approximate distribution range of Kaili limestone unconfined compressive strength and Young's modulus (E) is estimated by using various empirical equations and different reference values of the rebound index. For fresh intact limestone, the uniaxial compressive strength is in the range of 54–97 MPa, while for weathered limestone, it is in the range of 36–75 MPa. The uniaxial compressive strength range calculated according to the empirical formula is generally consistent with the results of the direct uniaxial compression test. The Young's modulus values corresponding to fresh and weathered limestone vary in the ranges of 20–47 and 14–27 GPa, respectively. Both field test and laboratory test results show that weathering greatly reduces the original mechanical properties of Kaili limestone.

    Figure  6.  Schmidt Hammer test on fresh (a) and weathered (c) failed blocks in field investigations; the histogram of the rebound index of fresh (b) and weathered (d) block surfaces.

    The true color cloud of the rockfall source areas includes 40, 984, 575 points (Figure 7a). The UAV manually shoots the cliff at close range, which can capture the detailed information of the rock structure and reduce the occlusion. Based on different HSV colors, the surface relief of the cliff can be observed, and in situ rock structure extraction is completed (Figure 7b). The extracted point clouds of Figures 7c7i are the location-dependent points that are on individual discontinuity surfaces. Red indicates set J11 (Figure 7c), light green indicates set J12 (Figure 7d), purple indicates set J21 (Figure 7e), dark green indicates set J22 (Figure 7f), blue indicates fifth set J31 (Figure 7g), and dark yellow indicates set J32 (Figure 7h). The last set, light purple, indicates bedding planes with low dip angles. These seven joint sets are finally directly extracted from the HSV-colored point cloud (all from Figure 7b). The loose soil deposits produced in the collapse are not shown as a set. Notably, combined with the field survey, it can be found that among the seven sets of discontinuities that have been filtered, the three sets of J11, J21, and J31 are the original discontinuities of the slope. The sets of J12, J22, and J32 were not found in the field investigation, but together with the original discontinuities constituted a complete discontinuity system due to the existence of undulations.

    Figure  7.  (a) Original dense point cloud with true color; (b) dense point cloud rendered by HSV; (c)–(i) each joint set directly extracted from HSV-colored points.

    According to the processing of the previous step, it is effective to measure the orientation of each discontinuity set. To reduce sampling deviation, approximately 30 small areas were randomly selected for each set (Figures 7c7h) and measured using the open source software CloudCompare. Both manual and semiautomatic methods embedded in CloudCompare software were used to trace the bedding planes and measure the orientation directly on the point cloud (Thiele et al., 2017). It is important to note that the bedding planes with low dip angles in the form of traces usually have a much lower point density than the joints exposed in the form of a plane. The number of point clouds extracted as bedding planes is very limited, as shown in Figure 7i. Taking a bedding plane with high persistence as an example, the extracted light purple points have a lower point density, as shown in the white dashed box in Figure 8a. For this flat-lying bedding exposed in the form of traces, the points of multiple areas are fitted to the discontinuity plane using the least-squares method to obtain the orientation on the sampling domain of the average set. The bedding plane mainly dips out of the cliff with a mean orientation of 7°/314° (Figure 8b). Another method is to use the tracking polyline with a point picking tool to measure the discontinuity traces when there is generally a much lower point density. As shown in Figure 8c, the color similarity algorithm in the trace polyline tool is used to efficiently select the bedding trace on the rock outcrop (solid blue line). The bedding plane was fitted by the trace tool with a dip of 8° and dip direction of 315° (Figure 8d).

    Figure  8.  Orientation measurement of bedding planes with low point density. (a) HSV-color based extraction of bedding; (b) using least-squares fitting a plane; (c) using the trace tool to measure bedding plane; (d) fitting a plane based on RGB similarity.

    To reduce sampling bias due to slope orientation, a total of 238 discontinuities were measured and then plotted in a stereographic projection (Figure 9). The cliff has a mean slope orientation of 86°/288°. The J11 set is marked in red with a mean orientation of 77°/148°. The J21 set, marked in purple, is widely distributed approximately parallel to the rock slope and has a mean orientation of 76°/92°. The J31 set is marked in blue and mainly has a conjugate relationship with J11, with a mean orientation of 80°/53°. These three extracted joint sets combined with field photos and 3D digital models are divided into original discontinuities. Compared with J11, J21 and J31, the corresponding J12, J22, and J32 have approximately the same dip angle but a 180° difference in the dip direction. This accurately reflects the geometric complexity of a discontinuity in this rock slope. The above sets of dominant discontinuities and bedding planes together form a discrete fracture network in the rockfall source areas.

    Figure  9.  Set-based poles, counters and mean attitude in equal angle stereographic projection (Dips 7.0).

    The kinematic analysis is the simplest and most efficient technique for evaluating potential failure modes of rock slopes. By analyzing the angular relationship between the slope surface and the discontinuities, regardless of the forces that cause the failure mode (Raghuvanshi, 2019). Kinematics analysis is carried out based on the orientations measured from the set-based point cloud, and the potential failure model is analyzed from the perspective of probability (Figure 10). The potential failure model of rock slopes may be the result of the interaction of multiple types rather than a single type. This conforming effect is not just a simple plane failure, toppling or wedge failure. When the friction angle is assumed to be 30° for analysis, the combination of sets (J12, J22 and J32) dipping out of the cliff is more likely to have plane sliding and wedge sliding modes, while the sets (J11, J21 and J31) dipping into the cliff provides favorable conditions for toppling. Based on kinematic analysis, it can be seen that the 38.24% critical probability of the plane sliding mechanism is mainly related to the set J22. The critical percentage of the wedge sliding mechanism is relatively high, but it does not represent the typical failure mode of slopes. This is mainly because the sets of joints involved are formed by destruction rather than original discontinuities. It can be confirmed that the widely distributed original discontinuities, such as the intersection of J11 and J21 or J11 and J31 with the bedding, provide a large number of blocks that may direct toppling. Moreover, flexural toppling failure in hard rocks such as Kaili limestone is inconsistent with the actual situation. Comprehensive field observations show that the risk of plane failure is minimal, and direct toppling failure is the main failure mode. Wedge sliding may be accompanied by toppling or free falling of the block. Table 4 shows the possible failure modes of the kinematic analysis and the sets of joints involved.

    Figure  10.  Kinematic analysis reveals potential failure modes.
    Table  4.  Results of the kinematic analyses
    Failure mode Involved set (s) Critical percentage (%)
    Planar sliding J22 38.24
    J22 vs. J11 5.02
    J22 vs. J12 93.08
    Wedge sliding J22 vs. J31 98.18
    J22 vs. J32 55.02
    J12 vs. J31 32.53
    J12 vs. J32 99.22
    J21 vs. J11 73.7 (D.T.) & 26.3 (O.T.)
    J21 vs. J12 74.31 (O.T.)
    Direct toppling J21 vs. J31 49.74 (D.T.) & 49.05 (O.T.)
    J21 vs. J32 51.47 (O.T.)
    J11 vs. J31 89.27 (D.T.) & 10.73 (O.T.)
    O.T. means oblique toppling; D.T. direct toppling.
     | Show Table
    DownLoad: CSV

    By selecting the set-based point cloud corresponding to each joint set that has been extracted, only the discontinuity (J11, J21 and J31) and bedding are measured for spacing. Figure 7 clearly shows that no set has a continuous persistence including the bedding planes. This leads to the determination of the set-based spacing using Hudson and Priest's impersistence model (Hudson and Priest, 1983). For each set of discontinuities that have been extracted from the rockfall source area, the thickness plugin in Cloud Compare can be used to directly estimate the normal spacing between the same group of discontinuities. Measuring the one-point thickness will measure the plane-perpendicular distance between the selected plane and each successively chosen point. Measuring the two-point thickness measures the plane-perpendicular distance between pairs of successively chosen points. Figure 11a shows an example of measuring the normal spacing of the J11 set. Subsequently, two adjacent discontinuities were manually selected, and the normal spacing of the J11 set was automatically obtained (Figure 11b). This manual measurement process is also applied to the rest of the original joint sets in the collapse area. In addition, processing and measuring using the two-point thickness method introduced here is far faster in practice, as a reference plane has to be selected only once in any series of measurements.

    Figure  11.  (a) Estimating the normal spacing of the J11 set; (b) histogram of joint set spacing (fitted log-normal distribution).

    To better understand the deformation and failure of Pinglu rockfall, it is assumed that the failure blocks are all rigid blocks without considering their more complex deformation and fragmentation characteristics. The complex direct toppling mechanism can be analyzed by constructing a simplified conceptual model of the slope (Brideau and Stead, 2010). Therefore, a simplified slope geometry is also used in the simulation. Generate a three-dimensional block model based on the statistical parameters of the main joint sets obtained in Table 5 (Figure 12). The Mohr-Coulomb strength criterion was adopted in this study. The density of the weathered limestone block is specified as 2 510 kg/m3 based on the density test. The normal stiffness and shear stiffness of the joint are obtained according to the formula reported by Barton and Choubey (Barton and Choubey, 1977). The spacing of each discontinuous set uses the results obtained from manual measurement of the thickness tool in the set-based point cloud. The rock bridges on the failure surfaces indicate that the main discontinuity sets are not completely persistent. However, our digital measurements of the set-based persistence have shown that the degree of persistence of each set is above 50%. Using 3DEC, Kim et al. (2007) have studied how the degree of persistence affects the block size. Their results show that when the joint persistence factor is greater than 0.5, the equivalent block volume delineated by discontinuous joint sets is roughly the same as the one determined by continuous joint sets. In our 3DEC back analysis, we have set the degree of persistence to 0.5 to characterize the non-persistence (Hencher, 2014; Kim et al., 2007). The rock and discontinuity properties specified in the 3D different element model are shown in Table 6.

    Table  5.  Statistical parameters of the orientation and spacing of the joint sets
    Joint set Mean dip (°) Stdv. (°) Mean dip direction (°) Stdv. (°) Mean spacing (m) Stdv. (m)
    J11 77 3.8 148 8.1 1 0.93
    J21 76 3.0 92 5.2 0.5 0.40
    J31 80 3.7 53 8.0 1 0.76
    Bedding 8 2.9 312 6.0 1.2 0.57
     | Show Table
    DownLoad: CSV
    Figure  12.  Generation of three-dimensional blocky model.
    Table  6.  Mechanical properties used in the 3DEC model
    Material property Density (kg/m3) Constitutive model Discontinuity properties Friction angle (°) Cohesion (MPa) Tensile strength (MPa) Shear stiffness (GPa/m) Normal stiffness (GPa/m)
    2 510 Rigid blocks 30 0 0 1 5
     | Show Table
    DownLoad: CSV

    After reaching the equilibrium state, a further simulation was performed. The results of the numerical calculation provide a further understanding of the influence of the spatial combination of discontinuities on the failure mechanism of the slope. The three-dimensional numerical simulation shows that the process is divided into two stages: the left side deforms first and then the right side, which does not happen at the same time. The displacement changes of unstable blocks with different calculation cycles are shown in Figure 13. The numerical results show that after the first 3 000 cycles, the left side of the rock outcrop has a gradually increasing displacement from bottom to top (Figure 13a). The largest displacements are similar to the locations of the doline found in the field investigation. As the circulation progressed, the lower part of the left cliff first collapsed under the influence of gravity (Figure 13b). Obviously, after the failure of the key block at the bottom caused unstable propagation, the space can be used for other blocks to move. The block in the middle area of the slope gradually deforms and further makes the top block appear free fall (Figure 13c). As a large number of blocks fell off the cliff on the left, then the rock on the right gradually deformed under free space conditions (Figure 13d). During the 36 000–39 000 steps, the deformation and failure modes of the remaining blocks on the slope were mainly toppling (Figure 13e). Consequently, the block completely failed and deposited on the toe of the slope (Figure 13f). The results of the numerical model back-analyzed the entire process from deformation to failure in the rockfall source area, enhancing our understanding of the failure mechanism. The rock mass on the left side of the slope first failed, and then the right side also entered the stage of deformation, which seems to be consistent with the situation in the on-site deposit area. To a certain extent, the failure sequence of the Pinglu rockfall is reconstructed, which is composed of two consecutive destruction events.

    Figure  13.  Failure simulation sequences of the blocky slope.

    The deposit area of the final simulation result shows a fan-shaped distribution (Figure 14a). The conceptual model assumes that the ground is flat but the real terrain is complex with an overall dip of approximately 35°. According to the simulation results, the centroid position and volume of each block are extracted (Figure 14b). It can be observed that the larger failed blocks are mostly distributed on the edge and surface of the fan-shaped accumulation, which is basically consistent with the evidence from the field investigation. The average width of the simulated deposit area is approximately 80 m, which is basically the same as the real width. Because the simplified model does not involve the slope angle, the simulated average length is approximately 55 m, which is slightly smaller than the actual situation.

    Figure  14.  (a) Morphology of the deposit area in the numerical simulation; (b) rock blocks centroid position and volume.

    The three-dimensional numerical simulation analysis carried out in this study better elucidates the direct toppling mechanism of the discontinuity control of the Pinglu rockfall. Due to the inability to carry out related traditional surveys on vertically unstable rock cliffs, the contribution of UAV photogrammetry is very important in rock structure mapping. For rock outcrops with complex geometries, a higher level of control may be required to complete specific manual flight routes. A series of high-definition images obtained in this way are used to reconstruct a high-resolution point cloud model through SfM to detect the 3D rock mass structure.

    As shown in Figure 7, it is difficult to identify the geometric characteristics of this linear structure on high slopes in the field investigation. A detailed UAV survey of a rock outcrop was performed to obtain accurate geometrical data for characterization of both the rockfall source areas and discontinuity orientations for use in subsequent analyses. The HSV technique was used to render the model and then directly assemble the set-based point clouds to a DFN. Traditional engineering geological field surveys allowed us to estimate the geomechanical properties of the rock mass and possible main failure mechanisms. To further understand the weakening effect of weathering on the mechanical properties of Kaili limestone through indoor and outdoor experiments, as a rockfall in this study area is a comprehensive 3D problem controlled by four discontinuity sets (bedding plane and three joint sets forming block edges). Based on digital photos and the results of the simulations, the Pinglu rockfall included two consecutive large-scale rockfalls. Since the simulations performed assume that the block is rigid and will not form new cracks through the intact rock, it is impossible to completely reproduce the failure mechanism. The slope simulated in this case study is basically dry, but the adverse effects of water pressure or dissolution on the potential failure mechanism should also be considered in future modeling.

    Remotely surveyed datasets, such as high-resolution point clouds obtained by UAV-SfM, have great potential for investigating inaccessible and dangerous rockfall source areas. The scaled and oriented point cloud was generated by processing the collected images combined with the SfM and directly extracting the 3D rock structure. The results show that the technology allows users to accurately and intuitively detect rock structures in unstable regions. The workflow proposed an effective and low-cost method for the (ⅰ) detection of discontinuities in rockfall source areas by UAV photogrammetry, (ⅱ) direct extraction of the point cloud of the joint sets from the HSV point and measurement of the three-dimensional rock structure parameters, and (ⅲ) back analysis of the deformation and failure processes of rockfall through 3D distinct element simulations. The practicality of this method is confirmed by the investigation and analysis of Pinglu rockfall, an event that occurs on high carbonate slopes. Based on the above research results, the method will be applied to other rock outcrops in the Kaili area to assess the stability.

    ACKNOWLEDGMENTS: The research was supported by the National Innovation Research Group Science Fund (No. 41521002) and the National Key Research and Development Program of China (No. 2018YFC1505202). The authors would also like to acknowledge the anonymous reviewers for their help in improving the paper. Their detailed comments and questions were a valuable help in improving the contents and arrangement of this paper. The final publication is available at Springer via https://doi.org/10.1007/s12583-022-1667-4.
  • Abellán, A., Calvet, J., Vilaplana, J. M., et al., 2010. Detection and Spatial Prediction of Rockfalls by Means of Terrestrial Laser Scanner Monitoring. Geomorphology, 119(3/4): 162–171. https://doi.org/10.1016/j.geomorph.2010.03.016
    Assali, P., Grussenmeyer, P., Villemin, T., et al., 2014. Surveying and Modeling of Rock Discontinuities by Terrestrial Laser Scanning and Photogrammetry: Semi-Automatic Approaches for Linear Outcrop Inspection. Journal of Structural Geology, 66: 102–114. https://doi.org/10.1016/j.jsg.2014.05.014
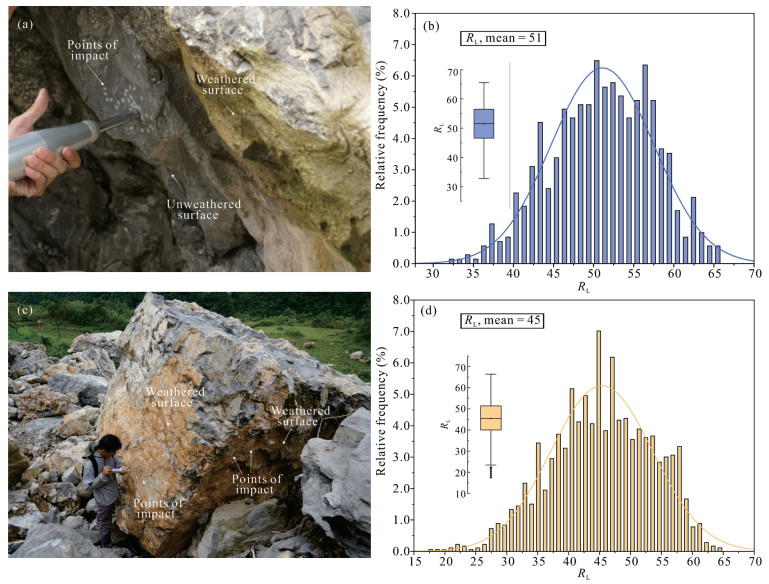
    Aydin, A., Basu, A., 2005. The Schmidt Hammer in Rock Material Characterization. Engineering Geology, 81(1): 1–14. https://doi.org/10.1016/j.enggeo.2005.06.006
    Barton, N., Choubey, V., 1977. The Shear Strength of Rock Joints in Theory and Practice. Rock Mechanics, 10(1): 1–54. https://doi.org/10.1007/bf01261801
    Basu, A., Aydin, A., 2004. A Method for Normalization of Schmidt Hammer Rebound Values. International Journal of Rock Mechanics and Mining Sciences, 41(7): 1211–1214. https://doi.org/10.1016/j.ijrmms.2004.05.001
    Boulch, A., Marlet, R., 2012. Fast and Robust Normal Estimation for Point Clouds with Sharp Features. Computer Graphics Forum, 31(5): 1765–1774. https://doi.org/10.1111/j.1467-8659.2012.03181.x
    Boulch, A., Marlet, R., 2016. Deep Learning for Robust Normal Estimation in Unstructured Point Clouds. Proceedings of the Symposium on Geometry Processing. June 20, 2016, Berlin. https://doi.org/10.5555/3061451.3061487
    Brideau, M. A., Pedrazzini, A., Stead, D., et al., 2011. Three-Dimensional Slope Stability Analysis of South Peak, Crowsnest Pass, Alberta, Canada. Landslides, 8(2): 139–158. https://doi.org/10.1007/s10346-010-0242-8
    Brideau, M. A., Stead, D., 2010. Controls on Block Toppling Using a Three-Dimensional Distinct Element Approach. Rock Mechanics and Rock Engineering, 43(3): 241–260. https://doi.org/10.1007/s00603-009-0052-2
    Brideau, M. A., Stead, D., 2012. Evaluating Kinematic Controls on Planar Translational Slope Failure Mechanisms Using Three-Dimensional Distinct Element Modelling. Geotechnical and Geological Engineering, 30(4): 991–1011. https://doi.org/10.1007/s10706-012-9522-5
    Brideau, M. A., Sturzenegger, M., Stead, D., et al., 2012. Stability Analysis of the 2007 Chehalis Lake Landslide Based on Long-Range Terrestrial Photogrammetry and Airborne LiDAR Data. Landslides, 9(1): 75–91. https://doi.org/10.1007/s10346-011-0286-4
    Buyuksagis, I. S., Goktan, R. M., 2007. The Effect of Schmidt Hammer Type on Uniaxial Compressive Strength Prediction of Rock. International Journal of Rock Mechanics and Mining Sciences, 44(2): 299–307. https://doi.org/10.3969/j.issn.1003-8825.2010.03.070
    Copons, R., Vilaplana, J. M., 2008. Rockfall Susceptibility Zoning at a Large Scale: From Geomorphological Inventory to Preliminary Land Use Planning. Engineering Geology, 102(3): 142–151. https://doi.org/10.1016/j.enggeo.2008.03.020
    Curtaz, M., Ferrero, A. M., Roncella, R., et al., 2014. Terrestrial Photogrammetry and Numerical Modelling for the Stability Analysis of Rock Slopes in High Mountain Areas: Aiguilles Marbrées Case. Rock Mechanics and Rock Engineering, 47(2): 605–620. https://doi.org/10.1007/s00603-013-0446-z
    Danzl, P., Gamper, T., Liu, Q., et al., 2020. Photogrammetric Reconstruction of Rock Outcrops Using Open Source Software. ISRM International Symposium-EUROCK 2020, June 14, 2020, Trondheim
    Dewez, T. J. B., Girardeau-Montaut, D., Allanic, C., et al., 2016. Facets: A Cloudcompare Plugin to Extract Geological Planes from Unstructured 3D Point Clouds. ISPRS-International Archives of the Photogrammetry. Remote Sensing and Spatial Information Sciences, XLI-B5: 799–804. https://doi.org/10.5194/isprsarchives-xli-b5-799-2016
    Dong, X. J., Xu, Q., Huang, R. Q., et al., 2020. Reconstruction of Surficial Rock Blocks by Means of Rock Structure Modelling of 3D TLS Point Clouds: The 2013 Long-Chang Rockfall. Rock Mechanics and Rock Engineering, 53(2): 671–689. https://doi.org/10.1007/s00603-019-01935-0
    Emmer, A., 2018. Geographies and Scientometrics of Research on Natural Hazards. Geosciences, 8(10): 382. https://doi.org/10.3390/geosciences8100382
    Fanti, R., Gigli, G., Lombardi, L., et al., 2013. Terrestrial Laser Scanning for Rockfall Stability Analysis in the Cultural Heritage Site of Pitigliano (Italy). Landslides, 10(4): 409–420. https://doi.org/10.1007/s10346-012-0329-5
    Fekete, S., Diederichs, M., 2013. Integration of Three-Dimensional Laser Scanning with Discontinuum Modelling for Stability Analysis of Tunnels in Blocky Rockmasses. International Journal of Rock Mechanics and Mining Sciences, 57: 11–23. https://doi.org/10.1016/j.ijrmms.2012.08.003
    Fener, M., Kahraman, S., Bilgil, A., et al., 2005. A Comparative Evaluation of Indirect Methods to Estimate the Compressive Strength of Rocks. Rock Mechanics and Rock Engineering, 38(4): 329–343. https://doi.org/10.1007/s00603-005-0061-8
    Ferrero, A. M., Forlani, G., Roncella, R., et al., 2009. Advanced Geostructural Survey Methods Applied to Rock Mass Characterization. Rock Mechanics and Rock Engineering, 42(4): 631–665. https://doi.org/10.1007/s00603-008-0010-4
    Ge, Y. F., Tang, H. M., Ez Eldin, M. A. M., et al., 2019. Deposit Characteristics of the Jiweishan Rapid Long-Runout Landslide Based on Field Investigation and Numerical Modeling. Bulletin of Engineering Geology and the Environment, 78(6): 4383–4396. https://doi.org/10.1007/s10064-018-1422-3
    Gigli, G., Morelli, S., Fornera, S., et al., 2014. Terrestrial Laser Scanner and Geomechanical Surveys for the Rapid Evaluation of Rock Fall Susceptibility Scenarios. Landslides, 11(1): 1–14. https://doi.org/10.1007/s10346-012-0374-0
    Giordan, D., Manconi, A., Tannant, D. D., et al., 2015. UAV: Low-Cost Remote Sensing for High-Resolution Investigation of Landslides 2015 IEEE International Geoscience and Remote Sensing Symposium (IGARSS). July 26–31, 2015. Milan. https://doi.org/10.1109/igarss.2015.7327042
    Goodman, R. E., Bray, J. W., 1976. Toppling of Rock Slopes. Proceedings of the Specialty Conference on Rock Engineering for Foundations and Slopes ASCE/Voulder, August 15–18, Colorado
    Gutiérrez, F., Parise, M., de Waele, J., et al., 2014. A Review on Natural and Human-Induced Geohazards and Impacts in Karst. Earth-Science Reviews, 138: 61–88. https://doi.org/10.1016/j.earscirev.2014.08.002
    Hencher, S. R., 2014. Characterizing Discontinuities in Naturally Fractured Outcrop Analogues and Rock Core: The Need to Consider Fracture Development over Geological Time. Geological Society, London, Special Publications, 374(1): 113–123. https://doi.org/10.1144/sp374.15
    Hudson, J. A., Priest, S. D., 1983. Discontinuity Frequency in Rock Masses. International Journal of Rock Mechanics and Mining Sciences, 20(2): 73–89. https://doi.org/10.1016/0148-9062(83)90329-7
    Humair, F., Pedrazzini, A., Epard, J. L., et al., 2013. Structural Characterization of Turtle Mountain Anticline (Alberta, Canada) and Impact on Rock Slope Failure. Tectonophysics, 605: 133–148. https://doi.org/10.1016/j.tecto.2013.04.029
    Jaboyedoff, M., Abellán, A., Carrea, D., et al., 2018. Mapping and Monitoring of Landslides Using LIDAR. Natural Hazards. Boca Raton, Taylor & Francis, Florida
    Jaboyedoff, M., Couture, R., Locat, P., 2009. Structural Analysis of Turtle Mountain (Alberta) Using Digital Elevation Model: Toward a Progressive Failure. Geomorphology, 103(1): 5–16. https://doi.org/10.1016/j.geomorph.2008.04.012
    Jaboyedoff, M., Metzger, R., Oppikofer, T., et al., 2007 New Insight Techniques to Analyze Rock-Slope Relief Using DEM and 3D-Imaging Cloud Points: COLTOP-3D Software. Proceedings of the 1st Canada-US Rock Mechanics Symposium-Rock Mechanics Meeting Society's Challenges and Demands, 1: 61–68. https://doi.org/10.1201/noe0415444019-c8
    Kim, B. H., Cai, M., Kaiser, P. K., et al., 2007. Estimation of Block Sizes for Rock Masses with Non-Persistent Joints. Rock Mechanics and Rock Engineering, 40(2): 169–192. https://doi.org/10.1007/s00603-006-0093-8
    Kim, D. H., Gratchev, I., Balasubramaniam, A., 2015. Back Analysis of a Natural Jointed Rock Slope Based on the Photogrammetry Method. Landslides, 12(1): 147–154. https://doi.org/10.1007/s10346-014-0528-3
    Lato, M., Diederichs, M. S., Hutchinson, D. J., 2009. Optimization of LiDAR Scanning and Processing for Automated Structural Evaluation of Discontinuities in Rockmasses. International Journal of Rock Mechanics and Mining Sciences, 46(1): 194–199. https://doi.org/10.1016/j.ijrmms.2008.04.007
    Li, H. B., Qi, S. C., Yang, X. G., et al., 2020. Geological Survey and Unstable Rock Block Movement Monitoring of a Post-Earthquake High Rock Slope Using Terrestrial Laser Scanning. Rock Mechanics and Rock Engineering, 53(10): 4523–4537. https://doi.org/10.1007/s00603-020-02178-0
    Li, Z. H., Dong, S. W., Qu, H. J., 2014. Timing of the Initiation of the Jurassic Yanshan Movement on the North China Craton: Evidence from Sedimentary Cycles, Heavy Minerals, Geochemistry, and Zircon U-Pb Geochronology. International Geology Review, 56(3): 288–312. https://doi.org/10.1080/00206814.2013.855013
    Liu, Q., Kaufmann, V., 2015. Integrated Assessment of Cliff Rockfall Hazards by Means of Rock Structure Modelling Applied to TLS Data: New Developments. ISRM Regional Symposium, EUROCK 2015, October 7, Salzburg
    Liu, Q., Kieffer, D. S., 2021. Deriving Three-Dimensional Rock Structure from LiDAR Point Clouds for Evaluating Scour of the Ricobayo Dam Spillway. 55th US Rock Mechanics/Geomechanics Symposium, June 19–25, 2021. Virtuell
    Liu, Q., Wronski, L., Danzl, P., 2021. Processing Outcrop Point Clouds to 3D Rock Structure Using Open Source Software. IOP Conference Series: Earth and Environmental Science, 833(1): 012054. https://doi.org/10.1088/1755-1315/833/1/012054
    Lollino, G., Giordan, D., Thuro, K., et al. 2015. Engineering Geology for Society and Territory-Volume 6. Applied Geology for Major Engineering Projects. Springer Cham, Switzerland. https://doi.org/10.1007/978-3-319-09060-3
    Lu, Y. R., Liu, Q., Zhang, F. E., 2013. Environmental Characteristics of Karst in China and Their Effect on Engineering. Carbonates and Evaporites, 28(1): 251–258. https://doi.org/10.1007/s13146-013-0158-1
    Luo, G., Cheng, Q. G., Shen, W. G., et al., 2022. Research Status and Development Trend of the High-Altitude Extremely-Energetic Rockfalls. Earth Science, 47(3): 913–934 (in Chinese with English Abstract)
    Ma, X. D., Zhou, J., Zhang, L. Q., et al., 2022. Dynamic Response Laws of Flexible Rockfall Barriers Based on Movement Characteristics of Rockfall. Earth Science, 47(12): 4559–4573 (in Chinese with English Abstract)
    Menegoni, N., Giordan, D., Perotti, C., et al., 2019. Detection and Geometric Characterization of Rock Mass Discontinuities Using a 3D High-Resolution Digital Outcrop Model Generated from RPAS Imagery–Ormea Rock Slope, Italy. Engineering Geology, 252: 145–163. https://doi.org/10.1016/j.enggeo.2019.02.028
    Metzger, R., Jaboyedoff, M., Oppikofer, T., et al., 2009, Coltop3D: A New Software for Structural Analysis with High Resolution 3D Point Clouds and DEM. Frontiers innovation, 278–281
    Nex, F., Remondino, F., 2014. UAV for 3D Mapping Applications: A Review. Applied Geomatics, 6(1): 1–15. https://doi.org/10.1007/s12518-013-0120-x
    Priest, S. D., 1993. Discontinuity Analysis for Rock Engineering. Chapman & Hall, London
    Raghuvanshi, T. K., 2019. Plane Failure in Rock Slopes―A Review on Stability Analysis Techniques. Journal of King Saud University– Science, 31: 101–109. https://doi.org/10.1016/j.jksus.2017.06.004
    Riquelme, A. J., Abellán, A., Tomás, R., et al., 2014. A New Approach for Semi-Automatic Rock Mass Joints Recognition from 3D Point Clouds. Computers and Geosciences, 68: 38–52. https://doi.org/10.1016/j.cageo.2014.03.014
    Sauro, U., 2016. Dolines and Sinkholes: Aspects of Evolution and Problems of Classification. Acta Carsologica, 32: 41–52. https://doi.org/10.3986/ac.v32i2.335
    Song, L., Jiang, Q., Zhong, Z., et al., 2021 Technical Path of Model Reconstruction and Shear Wear Analysis for Natural Joint Based on 3D Scanning Technology. Measurement, 188: 110584. https://doi.org/10.1016/j.measurement.2021.110584
    Stead, D., Wolter, A., 2015. A Critical Review of Rock Slope Failure Mechanisms: The Importance of Structural Geology. Journal of Structural Geology, 74: 1–23. https://doi.org/10.1016/j.jsg.2015.02.002
    Sturzenegger, M., Sartori, M., Jaboyedoff, M., et al., 2007. Regional Deterministic Characterization of Fracture Networks and Its Application to GIS-Based Rock Fall Risk Assessment. Engineering Geology, 94(3): 201–214. https://doi.org/10.1016/j.enggeo.2007.08.002
    Thiele, S. T., Lachlan, G., Anindita, S., et al., 2017. Rapid, Semi-Automatic Fracture and Contact Mapping for Point Clouds, Images and Geophysical Data. Solid Earth, 8(6): 1241–1253. https://doi.org/10.5194/se-8-1241-2017
    Vanneschi, C., Eyre, M., Venn, A., et al., 2019. Investigation and Modeling of Direct Toppling Using a Three-Dimensional Distinct Element Approach with Incorporation of Point Cloud Geometry. Landslides, 16(8): 1453–1465. https://doi.org/10.1007/s10346-019-01192-w
    Verma, A. K., Sardana, S., Sharma, P., et al., 2019. Investigation of Rockfall-Prone Road Cut Slope near Lengpui Airport, Mizoram, India. Journal of Rock Mechanics and Geotechnical Engineering, 11(1): 146–158. https://doi.org/10.1016/j.jrmge.2018.07.007
    Yuan, D. X., Li, B., Liu, Z. H., 1995. Karst in China. Episodes, 18(1/2): 62–65. https://doi.org/10.18814/epiiugs/1995/v18i1.2/013
    Zhang, J. Y., Li, H. B., Yang, X. G., et al., 2021. Quantitative Assessment of Rockfall Hazard in Post-Landslide High Rock Slope through Terrestrial Laser Scanning. Bulletin of Engineering Geology and the Environment, 80(10): 7315–7331. https://doi.org/10.1007/s10064-021-02426-9
    Zhao, H. J., Ma, F. S., Guo, J., 2012. Regularity and Formation Mechanism of Large-Scale Abrupt Karst Collapse in Southern China in the First Half of 2010. Natural Hazards, 60(3): 1037–1054. https://doi.org/10.1007/s11069-011-9888-3
  • Relative Articles

    [1]Jiaming Qi, Xiaoping Xia, Liang Qiu, Bin Liu, Junjun Chen. Geology and U-Pb Geochronology of the Qiling Uranium Deposit in the Southern Changjiang Uranium Orefield, South China[J]. Journal of Earth Science. doi: 10.1007/s12583-025-0221-6
    [2]Yan Zhang, Kai Meng, Xuanmei Fan, Guoqing Chen, Xiangsheng Zheng, Shaojun Li, Tianbin Li, Peng Zeng, Min Xi. Advancements in Laboratory Studies of Layered Rock Masses for Deep Engineering: Insights and Future Perspectives[J]. Journal of Earth Science. doi: 10.1007/s12583-025-2032-1
    [3]Tao Wen, Yankun Wang, Tang Huiming. Quantitative Evaluation of Rock Brittle Property Based on Energy Evolution and Its Application in Three Gorges Reservoir Area[J]. Journal of Earth Science, 2024, 35(6): 2013-2029. doi: 10.1007/s12583-022-1636-y
    [4]Chenlu Wang, Luobin Zheng, Liangqing Wang, Linfeng Zhu, Shanbai Wu, Shan Deng. Effects of the Tensile and Shear Properties of Bolts on the Shear Properties of Bolted Rock Joints[J]. Journal of Earth Science, 2024, 35(5): 1626-1639. doi: 10.1007/s12583-022-1749-3
    [5]Peng Guan, Cuifa Shao, Yuyong Jiao, Guohua Zhang, Junpeng Zou, Fei Tan. 3-D Tunnel Seismic Advance Prediction Method with Wide Illumination and High-Precision[J]. Journal of Earth Science, 2024, 35(3): 970-979. doi: 10.1007/s12583-021-1503-2
    [6]Jia Wang, Wen Zhang, Donghui Chen, Han Yin, Junqi Chen. Multi-scale structural geological model and quantification of stability evaluation for a high-steep fractured rock slope[J]. Journal of Earth Science. doi: 10.1007/s12583-023-1953-9
    [7]Yu Huang, Hao Shi, Bei Zhang. Crown-Like Baffle System against Rock Avalanches: Energy Dissipation Mechanism and Numerical Verification[J]. Journal of Earth Science, 2023, 34(2): 304-315. doi: 10.1007/s12583-021-1571-3
    [8]Wenjie Du, Qian Sheng, Xiaodong Fu, Jian Chen, Jingyu Kang, Xin Pang, Daochun Wan, Wei Yuan. Application of unmanned aerial vehicle remote sensing on dangerous rock mass identification and deformation analysis: case study of a high-steep slope in an open pit mine[J]. Journal of Earth Science. doi: 10.1007/s12583-023-1813-7
    [9]Sanming Lu, Xueyi Lan, Lili Zhao, Zanzan Zhang, Xiaoyong Yang, Zhuang Zhao, Dong Guo, Xiaochun Xu, Yongsheng Wang, Jianshe Li, Huasheng Qi. A 3D Investigation of Geological Structure and Its Relationship to Mineralization in the Nanling-Xuancheng Ore District, Middle-Lower Yangtze River Metallogenic Belt, China[J]. Journal of Earth Science, 2022, 33(3): 664-680. doi: 10.1007/s12583-021-1577-x
    [10]Weishe Zhang, Yuyong Jiao, Guohua Zhang, Xi Zhang, Guangzhao Ou, Zhiping Lin. Analysis of the Mechanism of Water Inrush Geohazards in Deep-Buried Tunnels under the Complex Geological Environment of Karst Cave-Fractured Zone[J]. Journal of Earth Science, 2022, 33(5): 1204-1218. doi: 10.1007/s12583-022-1619-z
    [11]Dian-Guang Liu, Yun Yang, Cheng-Jun Mao, Jian-Feng Wu, Ji-Chun Wu. A Comparative Study on Hydrodynamics and Hydrochemistry Coupled Simulations of Drainage Pipe Crystallization Blockage in Karst Tunnels[J]. Journal of Earth Science, 2022, 33(5): 1179-1189. doi: 10.1007/s12583-022-1720-3
    [12]Min Zhai, Xinggong Kong, Yuanhai Zhang, Philip Rowsell, Zhijun Zhao, Baojian Huang, Jing Zhang. Late Miocene elevated horizontal karst caves and landform evolution as a response to tectonic uplift along with regional integration of fluvial drainage in Southwestern China[J]. Journal of Earth Science. doi: 10.1007/s12583-022-1656-7
    [13]Márton Veress. Karst Types and Their Karstification[J]. Journal of Earth Science, 2020, 31(3): 621-634. doi: 10.1007/s12583-020-1306-x
    [14]Hong Liu, Xiucheng Tan, Ling Li, Xiong Ding, Jian Cao, Guang Yang, Teng Ma. Eogenetic Karst in Interbedded Carbonates and Evaporites and Its Impact on Hydrocarbon Reservoir: A New Case from Middle Triassic Leikoupo Formation in Sichuan Basin, Southwest China[J]. Journal of Earth Science, 2019, 30(5): 908-923. doi: 10.1007/s12583-019-0888-7
    [15]Babak Samani. Tectonic Setting of the Barm Firuz Lake, Zagros Mountains, Iran: Inferred from Structural and Karstic Evidence[J]. Journal of Earth Science, 2014, 25(5): 932-938. doi: 10.1007/s12583-014-0474-y
    [16]Kaichang Di, Zongyu Yue, Zhaoqin Liu, Shuliang Wang. Automated Rock Detection and Shape Analysis from Mars Rover Imagery and 3D Point Cloud Data[J]. Journal of Earth Science, 2013, 24(1): 125-135. doi: 10.1007/s12583-013-0316-3
    [17]Huiming Tang, Yunfeng Ge, Liangqing Wang, Yi Yuan, Lei Huang, Miaojun Sun. Study on Estimation Method of Rock Mass Discontinuity Shear Strength Based on ThreeDimensional Laser Scanning and Image Technique[J]. Journal of Earth Science, 2012, 23(6): 908-913. doi: 10.1007/s12583-012-0301-2
    [18]Junqi Liu, Xuebin Huang, Chonglong Wu, Wenming Cheng, Wei Xiang, He Xia. From the Area to the Point-Study on the Key Technology of 3D Geological Hazard Modeling in Three Gorges Reservoir Area[J]. Journal of Earth Science, 2012, 23(2): 199-206. doi: 10.1007/s12583-012-0246-5
    [19]Ling-qing YAO, Mao PAN, Qiu-ming CHENG. 3D Property Modeling of Void Ratio by Cokriging[J]. Journal of Earth Science, 2008, 19(4): 410-415.
    [20]Shishu Xiong, Liting Huang, Jinfeng Chen, Jingsu Su. Multi-dimensional Seismic Response Analysis of Base-Isolated Frame Structure with 3D Isolator[J]. Journal of Earth Science, 2005, 16(1): 66-71.
  • Cited by

    Periodical cited type(3)

    1. Yinpeng Liu, Chuang Song, Zhenhong Li, et al. Numerical investigation of large-slope planar failure considering entrainment effects: New insights into the 2009 JWS event. Engineering Geology, 2025, 346: 107901. doi:10.1016/j.enggeo.2024.107901
    2. Xiaohan Zhao, Wen Zhang, Junqi Chen, et al. Automatic identification of concealed dangerous rock blocks on high-steep slopes considering finite-sized discontinuity intersections. Journal of Rock Mechanics and Geotechnical Engineering, 2025. doi:10.1016/j.jrmge.2025.01.027
    3. Maolin Wu, Gang Luo, Xiewen Hu, et al. Dynamic fragmentation analysis of potential rockfall hazards at Zixia hydropower dam, Qinghai-Tibet Plateau. Journal of Rock Mechanics and Geotechnical Engineering, 2025. doi:10.1016/j.jrmge.2024.12.005

    Other cited types(0)

  • Created with Highcharts 5.0.7Amount of accessChart context menuAbstract Views, HTML Views, PDF Downloads StatisticsAbstract ViewsHTML ViewsPDF Downloads2024-052024-062024-072024-082024-092024-102024-112024-122025-012025-022025-032025-040255075100
    Created with Highcharts 5.0.7Chart context menuAccess Class DistributionFULLTEXT: 39.5 %FULLTEXT: 39.5 %META: 39.7 %META: 39.7 %PDF: 20.8 %PDF: 20.8 %FULLTEXTMETAPDF
    Created with Highcharts 5.0.7Chart context menuAccess Area Distribution其他: 2.0 %其他: 2.0 %Austria: 4.1 %Austria: 4.1 %China: 51.4 %China: 51.4 %India: 0.5 %India: 0.5 %Norway: 0.5 %Norway: 0.5 %Reserved: 7.1 %Reserved: 7.1 %Russian Federation: 2.6 %Russian Federation: 2.6 %Spain: 0.7 %Spain: 0.7 %Tunisia: 0.3 %Tunisia: 0.3 %Turkey: 0.4 %Turkey: 0.4 %United States: 29.6 %United States: 29.6 %海得拉巴: 0.3 %海得拉巴: 0.3 %罗奥尔凯埃: 0.5 %罗奥尔凯埃: 0.5 %其他AustriaChinaIndiaNorwayReservedRussian FederationSpainTunisiaTurkeyUnited States海得拉巴罗奥尔凯埃

Catalog

    通讯作者: 陈斌, bchen63@163.com
    • 1. 

      沈阳化工大学材料科学与工程学院 沈阳 110142

    1. 本站搜索
    2. 百度学术搜索
    3. 万方数据库搜索
    4. CNKI搜索

    Figures(14)  / Tables(6)

    Article Metrics

    Article views(301) PDF downloads(158) Cited by(3)
    Proportional views
    Related

    /

    DownLoad:  Full-Size Img  PowerPoint
    Return
    Return