
Citation: | Peng Xia, Fang Hao, Jinqiang Tian, Yong Fu, Yuliang Mou, Chuan Guo, Zhen Yang, Ke Wang. Organic Matter Occurrence and Its Effects on Pore Structure and Methane Adsorption Capacity: A Case Study of the Niutitang Black Shale in Guizhou, China. Journal of Earth Science, 2025, 36(2): 597-610. doi: 10.1007/s12583-022-1688-z |
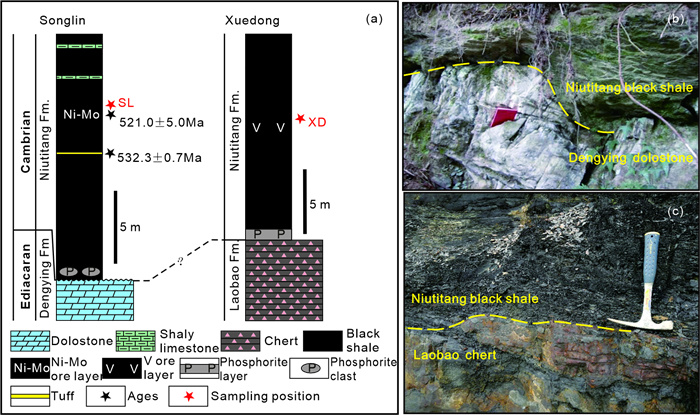
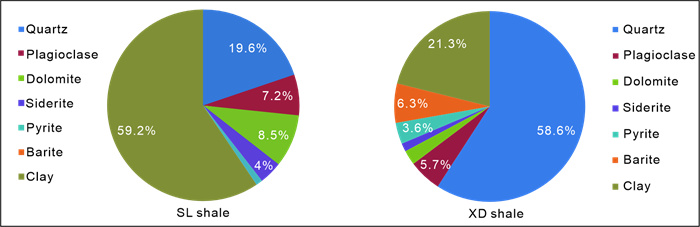
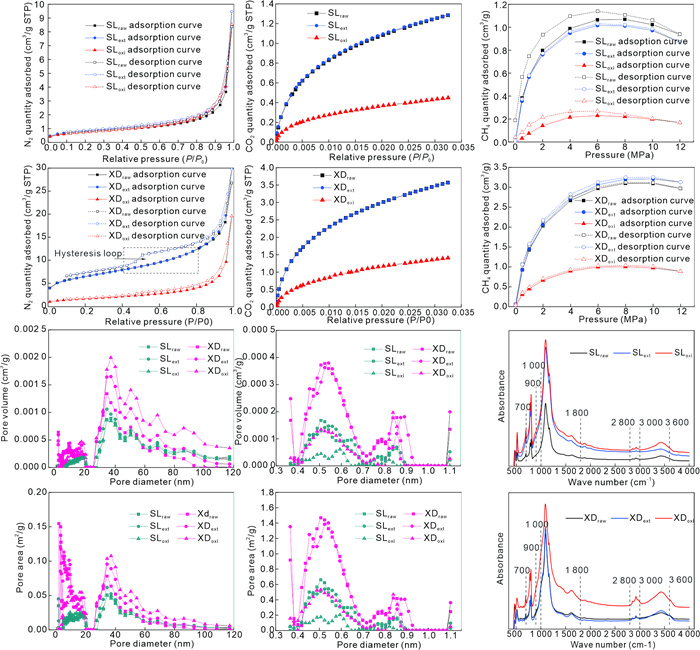
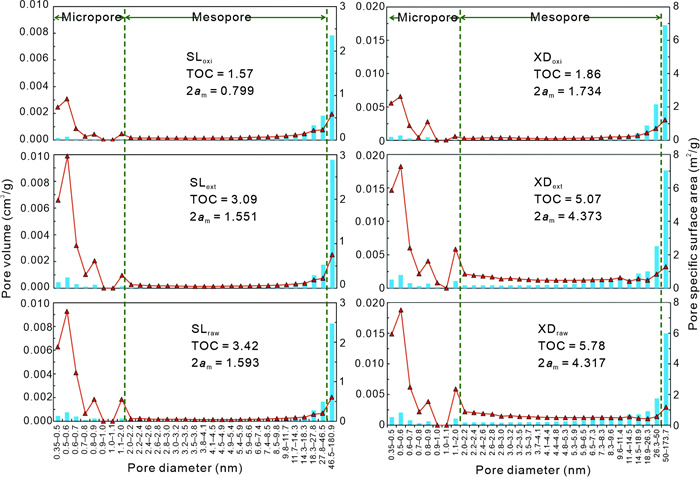
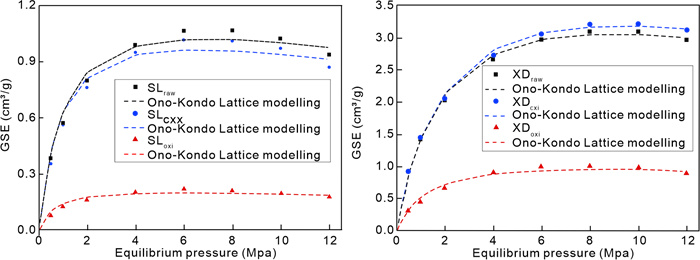
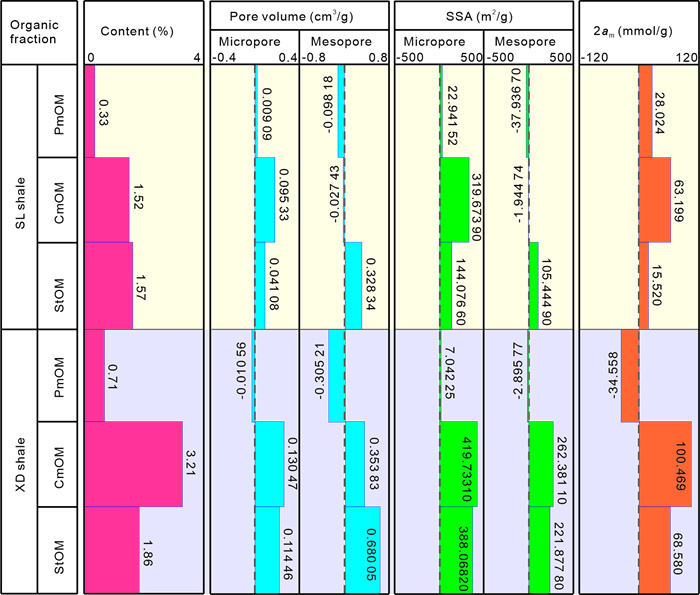
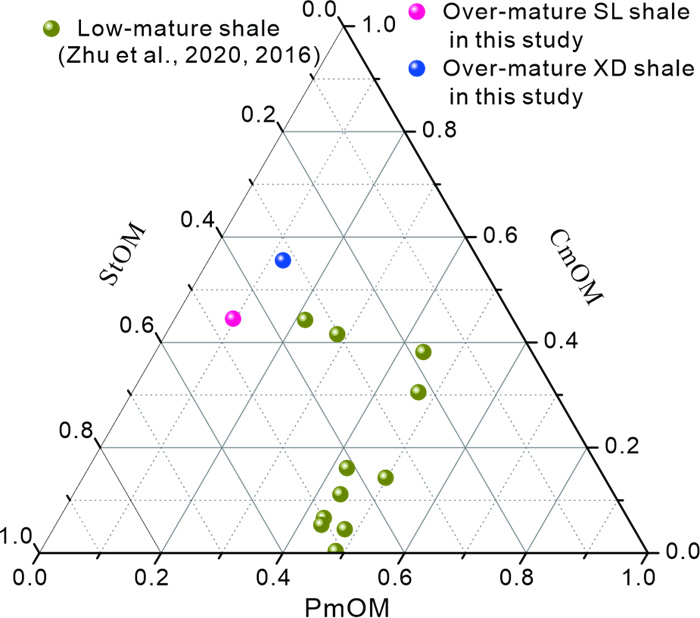
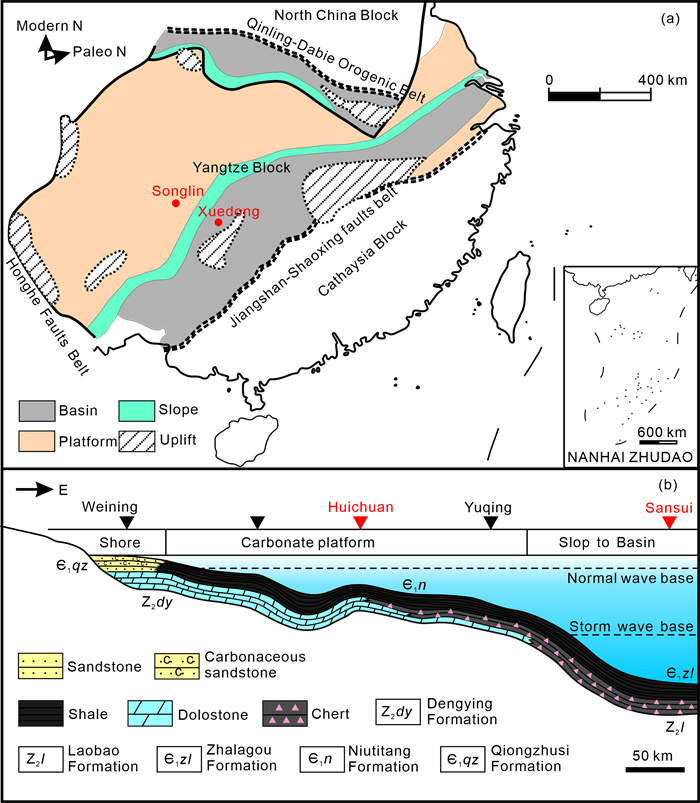
The black shale samples from the Niutitang Formation in the Yangtze Block were sequentially treated using organic solvent extraction and wet chemical oxidation. The organic matter (OM) in the shales includes physically mobile OM (PmOM), chemically mobile OM (CmOM), and stable OM (StOM). The CmOM has the strongest CH4 adsorption capacity because it has the largest volume of micropores and mesopores. In contrast, the PmOM has a very negative effect on the CH4 adsorption because it is poreless. The XD shale is a siliceous shale, in which the quartz particles wrap partly OM, preventing extraction and oxidation. The SL shale is an argillaceous shale, in which most of the OM is combined with clay minerals to form organo-clay composites. In both the SL and XD shales, the OM that is extractable via organic solvents is distributed among the mineral particles and is interconnected. The conceptual model of marine black shale in different environments needs to be perfected in the future because quantitative and qualitative methods should be combined to clarify the relationship between the known OM types (e.g., pyrobitumen, solid bitumen, and solid kerogen) and the OM types identified in this study.
As an unconventional natural gas reservoir, shale has an ultrafine pore structure (pore size of generally < 100 nm) and an extremely low porosity (< 6%) and permeability (< 0.001 × 10⁻³ μm2) compared with conventional sandstone reservoirs (Li et al., 2022; Feng et al., 2020; Zhang et al., 2020a; Hu et al., 2018; Li et al., 2017; Clarkson et al., 2012; Nelson, 2009). The ultrafine pore structure of shale is not only determined by its fine grain size, but also greatly affected by the organic matter (OM) in shale. Previous studies have demonstrated that the OM makes the largest contribution to the porosity (> 60%) of shale reservoirs, especially in organic-rich shale reservoirs, while the contributions of the clay minerals and brittle minerals are usually small (Dong et al., 2021; Xia et al., 2021; He et al., 2020; Zhang et al., 2020b; Ji et al., 2019; Yang et al., 2016; Cao et al., 2015; Milliken et al., 2013; Slatt and O'Brien, 2011).
The OM pores, which are generated from volume loss during maturation, are primarily controlled by the content, type, and maturity of the OM. The total organic carbon (TOC) content usually determines the OM porosity (Sun et al., 2022; Song et al., 2020; Yang et al., 2016; Milliken et al., 2013). As the thermal maturity increases, the amounts of micropores (< 2 nm) and mesopores (2–50 nm) in the OM significantly increase while the amount of macropores (> 50 nm) decrease (Wu et al., 2020; Zhang et al., 2020b; Zhao et al., 2018). OM pores with diameters of greater than 100 nm are not frequently observed in high to over-mature black shales (Wang et al., 2013), and more than 80% of the pores are micropores and mesopores (Hong et al., 2020; Hu et al., 2020).
In addition to thermal maturity, the development of OM pores in shale is also influenced by the OM types. Usually, OM pores are well developed in Type Ⅱ kerogen, while they are undeveloped in Type Ⅲ kerogen (Loucks et al., 2012). Recent studies have shown that migrated bitumen is much more porous than primary kerogen (Hong et al., 2020; Wang et al., 2020). Using scanning electron microscopy (SEM), Zhang et al. (2020b) qualitatively observed that OM pores with circular or irregular shapes are well developed in bitumen; are less developed in spherical OM; and are extremely rare in graptolites. However, the differences in the quantitative distributions of the nanoscale pores in the various OM types in high to over-mature black shale are uncertain.
The marine black shale in the Early Cambrian Niutitang Formation in the Yangtze Block is one of the most significant shale reservoirs in China (Zou et al., 2021, 2010). This black shale is a high to over-mature, organic-rich black shale, especially in Guizhou Province where its average vitrinite reflectance (Ro) is 2.69%, and average TOC content is 5.20% (Zhu et al., 2019). It should be noted that the sedimentary environment of this black shale changes from an inner shelf, through a slope, to a deep basin from the northwest to southeast in the Yangtze Block (Figure 1, Chen et al., 2009). In the inner shelf region, the black shale is enriched in clay minerals mainly belonging to argillaceous shale, and it unconformably overlies the dolomite of the Edicaran Dengying Formation (Figure 2) (Yang et al., 2022; Ning et al., 2021; Han et al., 2020; Lehmann et al., 2016; Dai et al., 2013). However, the black shale in formed the deep basin environment contains a large amount of quartz mainly belonging to siliceous shale, and it conformably overlies the Edicaran Laobao Formation, which is a heterotopic deposit of the Dengying dolomite (Fu et al., 2021, 2016; Shi et al., 2021; Wang et al., 2016; Zhou et al., 2015). The differences in and relationships of the OM occurrences and pore structures of the inner shelf and deep basin black shales are significant for shale gas exploration and development, but these differences are unclear.
In this study, the pore characteristics, methane adsorption capacity, and organic compositions of the untreated and sequentially treated shale samples from the Niutitang Formation, Guizhou Province, were quantitatively evaluated. A conceptual model of the OM pore structure of the over-mature, organic-rich marine black shales in the different environments was created.
An argillaceous black shale sample was obtained from the Songlin Section, northern Guizhou Province, and a siliceous black shale sample was collected from the Xuedong Section, southeastern Guizhou Province (Figures 1, 2). The minerals compositions of the two samples are shown in Figure 3, and they are typical pure organic-rich argillaceous shale and siliceous shale from the Niutitang Formation in Guizhou Province (Ning et al., 2021; Zhu et al., 2019). The two shale samples were ground to 100% passing mesh #100 and were sequentially treated via organic solvent extraction and wet chemical oxidation to remove the different organic fractions. (1) During the organic solvent extraction, each ground sample was wrapped in filter paper and refluxed using an organic solvent (a mixture of dichloromethane and methanol with a volume proportion of 9: (1) in a soxhlet extraction apparatus to remove the extractable fractions. The organic solvent extraction lasted for more than 72 h until the refluent distilled solvent was colorless, and then, each sample was filtered and dried (in an oven at 60 ℃). (2) After the organic solvent extraction, the dried samples were split to conduct wet chemical oxidation, and each sample was placed in a flask and immersed in a 6 wt.% sodium hypochlorite (NaClO) solution, with a solid-to-solution volume ratio of 1 : 50 and a pH value of 8. The mixed slurry was allowed to settle for 24 h, and the supernatant was discarded. Approximately seven repetitive treatments were needed to complete the OM oxidation. After the last treatment, the slurry was washed using deionized water to remove the redundant halide ions. Then, after the wet chemical oxidation, the samples were dried in an oven at 60 ℃. The untreated argillaceous shale and siliceous shale samples labeled SLraw and XDraw, respectively; after organic solvent extraction they were labeled SLext and XDext, respectively; and after the wet chemical oxidation they were labeled SLoxi and XDoxi, respectively. The untreated samples, extracted samples, and oxidized samples were subsequently analyzed to determine their TOC contents, low-pressure N2 and CO2 adsorption values, CH4 isothermal adsorption/desorption values, and FTIR spectra.
The TOC contents were measured using a CS230HC carbon-sulfur analyzer. The low-pressure N2 and CO2 adsorption measurements were conducted using an ASAP 2460 automatic specific surface area and pore size apparatus. The N2 adsorption can characterize the 1.7 to 300 nm pores well (Chen et al., 2017), mainly including mesopores and macropores; while CO2 adsorption is an effective method of micropore characterization (Okolo et al., 2015).
The six samples (about 5.00 g each) were degassed under vacuum at 90 ℃ for 48 h, and then, the N2 and CO2 adsorption analyses were conducted at 0 ℃ in an ice bath and at -195.85 ℃ in liquid nitrogen, respectively. The equilibrium intervals of the N2 and CO2 adsorption were set as 5 and 10 s, respectively. Based on the results of the adsorption experiments, the Brunauer-Emmett-Teller (BET) theory (Wang et al., 2015; Brunauer et al., 1938) was used to calculate the total specific surface area. The micropore volume and micropore specific surface area were calculated using the density function theory (DFT) (Han et al., 2016; Klimakowa et al., 2012), and the meso-macropore volume and meso-macropore specific surface area were calculated using the Barrett-Joyner-Halenda (BJH) theory (Joyner et al., 1951).
The CH4 isothermal adsorption/desorption measurements were conducted using an IS-300 isothermal adsorption and desorption apparatus, and the experimental temperature and pressure range were set as 50 ℃ and 0–12 MPa, respectively. To further discuss the adsorption capacity of CH4 on untreated and sequentially treated shale samples, the Ono-Konda lattice model was used in this study. This model has been widely used to describe the Gibbsian surface excess (GSE) adsorption isotherms obtained under supercritical and high-pressure conditions (Aranovich and Donohue, 1999), and obtains good application in evaluating CH4 adsorption capacity of shale (Fu et al., 2021; Huo et al., 2017). The simplified Ono-Konda lattice model is as following equation (Zhang et al., 2011)
ρbGSE=ρbρmc2am[1−exp(εA/kT)](ρmc−ρb)+ρmcexp(εA−kT)2am[1−exp(εA/kT)], |
where am is the monolayer adsorption capacity; εA is the interaction energy between adsorbate molecules and adsorbent molecules, J/mol; k is Boltzmann's constant, 1.38 × 10⁻²³ J/mol/K; T is the operating temperature, K; ρb is the density of adsorbate in bulk phase, mol/m3; ρmc is the density of adsorbate at the maximum adsorption capacity, mol/m3, and is always assigned as the density of fluid at the boiling point and the atmospheric pressure. Based on this model, the experimental adsorption amounts of CH4 were calculated using the methods in Fu et al. (2021) and Sircar (1999).
In addition, the relationship between GSE and Nabs is expressed as follow
Nabs=GSE1–ρbρa |
where Nabs is the absolute adsorption amount; ρa is the density of the adsorbed phase, mol/m3. Because the adsorbed phase is usually regarded as a pseudo-liquid state, the liquid density of CH4 (421 kg/m3) at the boiling point under the atmospheric pressure is designated as ρa of CH4 (Wang et al., 2016; Harpalani et al., 2006; Clarkson et al., 1997).
The TOC contents of the untreated shale samples were 3.42% (SLraw) and 5.78% (XDraw) (Table 1), indicating that both are organic-rich shale (Jarvie et al., 2007). The extracted shale samples, SLext and XDext, had TOC contents of 3.09% and 5.07%, respectively. The TOC contents of the wet chemical oxidized shale samples, SL3 and XD3, are 1.57% and 1.86%, respectively.
Sample | TOC (%) | R2 | 2am (mmol/g) | Pore volume (cm3/g) | Specific surface area (m2/g) | |||
Micropore | Mesopore | Micropore | Mesopore | |||||
SLraw | 3.42 | 1.718 1 | 1.593 | 0.002 12 | 0.004 41 | 7.196 75 | 1.500 73 | |
SLext | 3.09 | 1.746 9 | 1.551 | 0.002 09 | 0.004 74 | 7.121 05 | 1.625 93 | |
SLoxi | 1.57 | 8.380 7 | 0.799 | 0.000 65 | 0.005 16 | 2.262 00 | 1.655 49 | |
XDraw | 5.78 | 2.010 4 | 4.317 | 0.006 24 | 0.021 84 | 20.741 50 | 12.528 80 | |
XDext | 5.07 | 2.031 5 | 4.373 | 0.006 32 | 0.024 01 | 20.691 50 | 12.549 36 | |
XDoxi | 1.86 | 2.768 5 | 1.734 | 0.002 13 | 0.012 65 | 7.218 07 | 4.126 93 | |
R2 is multiple correlation coefficient; 2am is maximum adsorption amount. |
The FTIR spectra were peak fitted and attributed using the Origin 7.5 software, and the spectra can be divided into four ranges: 700–900 cm-1 (aromatic structure range), 1 000–1 800 cm-1 (oxygen-containing functional groups range), 2 800–3 000 cm-1 (fatty functional groups range), and 3 000–3 600 cm-1 (hydroxy functional group range) (Hao et al., 2020).
For the aromatic structure, the organic solvent extraction decreased the proportion of the tetra-substituted benzene ring, while it increased the proportions of the penta-substituted benzene ring. The penta-substituted benzene ring increased after the wet chemical oxidation (Figure 4). Interestingly, the proportions of the symmetrical-RCH3 and the R3CH in the fatty functional group and the cyclic association and self-association in the hydroxyl functional group decreased in the SL shale after the organic solvent extraction, but they increased in the XD shale after the same treatment.
The isothermal N2 adsorption curves of the untreated and sequentially treated shale samples are shown in Figures 5a, 5d. The adsorption curves of SLraw, SLext, and SLoxi do not contain distinct inflection points in the low relative pressure section, and they increase sharply in the high relative pressure section (Type Ⅲ curve according to the International Union of Pure and Applied Chemistry, IUPAC), implying the presence of a large amount of mesopores and macropores. In addition, these three adsorption curves approximately overlap (Figure 5a), indicating that the sequential treatments had a small effect on the mesopore and macropore (Figures 5g, 5j).
Compared with the SLraw shale, the XDraw shale is more sensitive at low relative pressures, and it contains a hysteresis loop (Type Ⅳ curve), implying that the fine pores are more well-developed in the XDraw shale than in the SLraw shale. The isothermal adsorption curve of extracted shale sample XDext approximately overlaps with that of untreatd shale sample XDraw. However, the isothermal adsorption curve of the oxidized shale sample (XDoxi) moved far away from that of the untreated shale, and the hysteresis loop turned narrower (Figure 5d).
Figures 5b and 5e show the isothermal CO2 adsorption curves of the untreated and sequentially treated shale samples, which show the following. (1) The XDraw shale had a higher CO2 adsorption capacity than the SLraw shale. (2) The organic solvent extraction had little effect on the CO2 adsorption capacity in both samples, but the wet chemical oxidation had a significant effect on it.
The contributions of the different pore sizes to the pore volume and pore specific surface area are shown in Figures 5h and 5k, respectively. All untreated and sequentially treated shale samples exhibit two peaks. One major peak is located in the 0.4–0.7 nm interval, and the other ranges from 0.8 to 0.95 nm. In addition, both extracted shale samples (SLext and XDext) have pore size distributions that are very similar to those of their untreated samples, but they have significant differences in micropore size distributions in contrast to oxidized shale samples. For the SL shale sample, its pore volume and specific surface area decreased throughout the entire size range after the wet chemical oxidation. In contrast, the pore volume and specific surface area of the XD shale sample significantly decreased in the 0.4–0.7 nm interval but remained nearly unchanged in the 0.8–0.95 nm interval.
The evolution of the pore structure determined via N2 and CO2 adsorption are shown in Figure 6 and Table 1. In summary, the organic solvent extraction had little effect on both the micropore and mesopore structures of the shale. The micropore + mesopore volume and specific surface area of the SL shale changed from 0.006 54 cm3/g and 8.697 49 m2/g, respectively, to 0.006 83 cm3/g (rate of change of 4.50%) and 8.746 97 m2/g (rate of change of 0.57%) after the extraction. For the XD shale, they changed from 0.028 08 cm3/g and 33.270 30 m2/g, respectively, to 0.030 32 cm3/g (rate of change of 7.98%) and 33.240 86 m2/g (rate of change of -0.09%) after extraction. In contrast, the wet chemical oxidation had a much more significant effect on the micropores and mesopores in the shale. The micropore + mesopore volume and specific surface area of the SL shale decreased from 0.006 83 cm3/g and 8.746 97 m2/g, respectively, to 0.005 80 cm3/g (rate of change of -15.11%) and 3.917 49 m2/g (rate of change of -55.21%) after oxidation. For the XD shale, they decreased from 0.030 32 cm3/g and 33.240 86 m2/g, respectively, to 0.014 78 cm3/g (rate of change of -51.27%) and 11.345 000 m2/g (rate of change of -65.87%) after extraction.
The methane adsorption/desorption isotherms of the SL (including SLraw, SLext, and SLoxi) and XD (including XDraw, XDext, and XDoxi) shales are presented in Figures 5c and 5f, respectively. The excess CH4 adsorption capacity reaches the maximum value at 6–8 MPa for the SL shale samples and at 8–10 MPa for the XD shale samples. As shown in Figure 7, the Ono-Konda lattice model fitting curves well agree with the experimental data of CH4 adsorption on the samples. Moreover, the multiple correlation coefficients (R2) listed in Table 1 of all samples are above 0.992 0, indicating that the Ono-Kondo model is able to describe the adsorption equilibrium of CH4 on the samples in this study. Based on this model, the maximum adsorption amount (2am) was calculated and then documented in Table 1. The XDraw shale (2am = 4.255 mmol/g) has a higher CH4 adsorption capacity than the SLraw shale (2am = 1.297 mmol/g). After the organic solvent extraction, the CH4 adsorption capacity of SLext (2am = 1.204 mmol/g) was slightly lower, while it was slightly higher for XDext (2am = 4.501 mmol/g), indicating that organic solvent extraction has a small effect on the CH4 adsorption capacity of shale. In contrast, the CH4 adsorption capacities of both SLoxi (2am = 0.244 mmol/g) and XDoxi (2am = 1.276 mmol/g) were significantly lower after the wet chemical oxidation, implying that wet chemical oxidation has a significant effect on the CH4 adsorption capacity of these samples.
The TOC contents of the shales were notably decreased by the organic solvent extraction and wet chemical oxidation (Table 1). These treatments have different OM removal functions. Organic solvent extraction involves physical processes and does not change the organic molecular structure; while wet chemical oxidation involves chemical processes, including the destruction of organic molecules and the rupture of the methine (-CH), methylene (-CH2), and methyl (-CH3) functional groups(Zhu et al., 2020; Zhao et al., 2018; Cai et al., 2007; Mikutta et al., 2005).
In this study, organic solvent extraction and wet chemical oxidation were sequentially conducted due to the difference in their physicochemical processes. As a result, the organic fractions were progressively mobilized and removed by the sequential treatments. Operationally, the removed organic fractions were defined according to Zhu et al. (2016), in which the organic solvent extracted OM is referred to as physically mobile OM (PmOM), and the removed and residual OM after wet chemical oxidation are referred to as chemically mobile OM (CmOM) and stable OM (StOM), respectively (Figure 8). The contents of PmOM and CmOM were calculated from TOC differences between the untreated shale and extracted shale samples (PmOM = TOCraw–TOCext) and between the extracted shale and oxidized shale samples (CmOM = TOCext–TOCoxi), respectively. The TOC contents of the untreated shales and sequentially treated shales (StOM) were measured using a carbon-sulfur analyzer (Table 1). It should be noted that both the SL and XD shales contain only a small proportion of PmOM (Figure 9); and the low-maturity shales reported in previous studies (Zhu et al., 2020, 2016) contain much higher proportions of PmOM than the over-mature SL and XD shales. This difference is most likely the effect of OM maturity. During thermal evolution, OM is partially decomposed and migrated, and this OM is most likely PmOM (Zhu et al., 2016).
These three organic fractions (PmOM, CmOM, and StOM) varied not only in their contents but also in their attributes as was revealed by the changes in the FTIR spectra (Figures 5i, 5l). Even though FTIR analysis is a semi-quantitative method for evaluating organic compositions, by which the relative contents of the organic components in each spectrum range (i.e., the aromatic structure range, oxygen-containing functional groups range, fatty functional groups range, and hydroxy functional group range) can be revealed, it can also indicate the evolution trend of OM during sequential treatments. To characterize this evolution trend, the changes in the organic components of the SL and XD shales after each treatment were calculated and are presented in Figure 4. The proportions of di-substituted and penta-substituted benzene rings decreased, while the proportions of tri-substituted and tetra-substituted benzene rings increased. These results indicated that cyclization of the fat chain, dehydroaromatization of cycloalkanes, and decarboxylation of benzene rings may occur. The increased asymmetrical and symmetrical methyl contents and the decreased asymmetrical and symmetrical methylene contents indicate a break in the aliphatic chain. In addition, the proportion of the cyclic association and self-association in the hydroxyl functional group decreased in the SL shale after the organic solvent extraction, but they increased in the XD shale after the same treatment, indicating that two shales underwent different OM changes during the sequential treatments (Zhu et al., 2020).
OM contributes significantly to the pore structure and CH4 adsorption capacity of shale. In particular, the nanopores, which are major storage spaces for hydrocarbon gases, are mainly distributed within the OM (Zhang et al., 2020b; Ji et al., 2019; Liu et al., 2017; Xiong et al., 2017). It is noteworthy that pore characteristics of each organic fraction are unmeasurable because sequential treatments will destroy the structure of OM. Thus, the differences between untreated and solvent extracted shales, and between solvent extracted and chemical oxidized shales were used to discuss the pore characteristics of organic fractions, because the sequential treatments separate OM into three organic fractions (Zhu et al., 2020, 2016, and Section 3.1 in this study). The differences are shown in Figure 8. To exclude interference from the organic fractions' contents, the pore volume, specific surface area, and 2am of each organic fraction were amended using following equation
Ra = (R0/TC)·100,
where Ra is the amended value of the pore structure or adsorption capacity parameter and indicated the value of these parameters in the pure organic fractions; R0 is the pore structure or adsorption capacity parameter of each organic fraction, including the micropore volume (cm3/g) and specific surface area (m2/g), mesopore volume (cm3/g) and specific surface area (m2/g), and 2am (mmol/g) in this study; and TC is the content of each organic fraction (%).
The amend results are presented in Figure 8. The PmOM, CmOM, and StOM have different effects on both the pore structure and CH4 adsorption capacity. The micropores are mainly distributed within the CmOM and StOM, and they have much higher CH4 adsorption capacities than PmOM. It should be noted that the CmOM has totally different characteristics of mesopore between the SL and XD shales. In the XD shale, the CmOM is an important repository of mesopore, and the mesopore volume and specific surface area of the XD shales were significantly decreased after wet chemical oxidation (Figure 9). However, this oxidation slightly increased the mesopore volume and specific surface area of the SL shale. This phenomenon may occur because a large amount of the CmOM distributed in the mesopores. Previous studies of the Early Cambrian Niutitang black shale lithofacies have shown that the shales in the inner shelf are rich in clay minerals and are mainly argillaceous shale (Ning et al., 2021; Liu et al., 2017; Yang et al., 2016), while the shales in the deep basin are enriched in quartz and are mainly siliceous shales (Xia et al., 2020; Zhou, 2017; Fu et al., 2016). In this study, the SL shale is an argillaceous shale, in which a large amount of the OM is combines with clay minerals forming organo-clay composites (Figure 10d). Compared with quartz, clay minerals are more likely to be oxidized during the wet chemical oxidation stage (Zhu et al., 2020, 2016) implying that the OM combined with clay minerals is likely oxidized to restore some mesopores. In both the SL and XD shales, StOM has higher mesopores than PmOM and CmOM. In addition, as the TOC content decreased during the sequential treatments, the adsorption capacities of both the SL and XD shales sharply decreased, indicating that the OM is the main medium for hydrocarbon gas adsorption (Milliken et al., 2013). In both the SL and XD shales, the CmOM has the highest CH4 adsorption capacity because it has the largest micropore and mesopore volume. In contrast, the PmOM has a very negative effect on the CH4 adsorption because it is poreless (Figures 8 and 10).
The attributes of organic fractions in Figure 4 indicate that cyclization of the decarboxylation of benzene rings and break in the aliphatic chain may occur during sequential treatments. These changes in molecular structure have significant effects on pore structure of OM, i.e., generating nano pores (Wang et al., 2019; Miao et al., 2017). Thus, the large amount of micropore and mesopore and high CH4 adsorption capacity in CmOM maybe are the results of the changed attributes of organic fractions.
Pores develop differently in the various OM types and even in different parts of a single type (Löhr et al., 2015; Loucks et al., 2012). Recent studies have found that OM pores are mainly developed in pyrobitumen, while only a few were found in kerogen in shale reservoirs (Wang et al., 2020; Zhang et al., 2020b). In this study, the OM structure of the sequentially treated organic-rich black shales also indicates that different OM fractions have distinct pore characteristics (Figure 8).
OM types and their distributions in shale reservoirs are controlled by the paleoenvironment (Zhang et al., 2020c). The SL and XD shales were selected to construct an OM pore structure conceptual model (Figure 10) according to the evolution of the OM pore during the sequential treatments.
In this model, the OM is classified as PmOM, CmOM, and StOM. Among them, the PmOM is poreless and the others are porous. In contrast to the StOM, which is rich in mesopores, the CmOM has a much higher proportion of micropores. The deep basin XD shale is a siliceous shale, in which quartz particles wrap part of the OM (Figures 10e, 10f, 11), preventing extraction and oxidation (Li et al., 2020). This part of OM is also developed in the inner shelf SL shale, but its content is much lower than that in the XD shale. The SL shale is an argillaceous shale, in which most of the OM is combined with clay minerals (Figures 10d, 11) to form organo-clay composites (Cai et al., 2007). This OM is oxidizable but unextractable during the sequential treatments because the wet chemical oxidation destroys the organo-clay composites (Cai et al., 2020; Zhao et al., 2018). In both the SL and XD shales, the OM that is extractable by organic solvents is distributed among the minerals particles and is interconnected. This conceptual model of marine black shales formed in different environments needs to be perfected in the future because quantitative and qualitative methods should be combined to clarify the relationship between the known OM types (e.g., pyrobitumen, solid bitumen, and solid kerogen) and the OM types identified in this study.
The Early Cambrian Niutitang marine inner shelf SL shale and the deep basin XD shale in the Yangtze Block were sequentially treated via organic solvent extraction and wet chemical oxidation, and a conceptual organic matter-pore structure model was built.
The OM was classified into three types based on the results of the sequential treatments, and they are physically mobile OM (PmOM), chemically mobile OM (CmOM), and stable OM (StOM). The PmOM is poreless, and distributed among the mineral particles. The CmOM is rich in micropores, and in contrast, the StOM has a much higher proportion of mesopores. In particular, the CmOM has the highest CH4 adsorption capacity because it has the largest volume of micropores and mesopores. The PmOM has a very negative effect on the CH4 adsorption because it is poreless.
The XD shale is a siliceous shale, in which quartz particles wrap part of the OM, preventing extraction and oxidation. The SL shale is an argillaceous shale, in which most of the OM is combined with clay minerals forming organo-clay composites. In both shales, the OM that extractable using organic solvent distributes is located among the minerals particles and is interconnected.
Finally, the conceptual model of marine black shales formed in different environments needs to be perfected in the future because quantitative and qualitative methods should be combined to clarify the relationship between the known OM types and the types identified in this study.
ACKNOWLEDGMENTS: This work was financially supported by the National Natural Science Fund of China (Nos. 42002166, 41690134, 42162016) and the Guizhou Provincial Fund Project (Nos. [2020]1Y161, ZK[2021]199, ZK[2022]106). In addition, Peng Xia is very grateful to Xiaojun Zhu at Tongji University and Wei Li at the Northeast Petroleum University for their help with the experimental design. We thank LetPub (www.letpub.com) for its linguistic assistance during the preparation of this manuscript. The final publication is available at Springer via https://doi.org/10.1007/s12583-022-1688-z.Aranovich, G. L., Donohue, M. D., 1999. Phase Loops in Density-Functional-Theory Calculations of Adsorption in Nanoscale Pores. Physical Review E, 60(5): 5552–5560. https://doi.org/10.1103/physreve.60.5552 |
Brunauer, S., Emmett, P. H., Teller, E., 1938. Adsorption of Gases in Multimolecular Layers. Journal of the American Chemical Society, 60(2): 309–319. https://doi.org/10.1021/ja01269a023 |
Cai, J. G., Bao, Y. J., Yang, S. Y., et al., 2007. Research on Preservation and Enrichment Mechanisms of Organic Matter in Muddy Sediment and Mudstone. Science China Earth Sciences, 50(5): 765–775. https://doi.org/10.1007/s11430-007-0005-0 |
Cai, J. G., Zhu, X. J., Zhang, J. Q., et al., 2020. Heterogeneities of Organic Matter and Its Occurrence Forms in Mudrocks: Evidence from Comparisons of Palynofacies. Marine and Petroleum Geology, 111: 21–32. https://doi.org/10.1016/j.marpetgeo.2019.08.004 |
Cao, T. T., Song, Z. G., Wang, S. B., et al., 2015. A Comparative Study of the Specific Surface Area and Pore Structure of Different Shales and Their Kerogens. Science China Earth Sciences, 58(4): 510–522. https://doi.org/10.1007/s11430-014-5021-2 |
Chen, D. Z., Wang, J. G., Qing, H. R., et al., 2009. Hydrothermal Venting Activities in the Early Cambrian, South China: Petrological, Geochronological and Stable Isotopic Constraints. Chemical Geology, 258(3/4): 168–181. https://doi.org/10.1016/j.chemgeo.2008.10.016 |
Chen, L., Jiang, Z. X., Liu, K. Y., et al., 2017. Pore Structure Characterization for Organic-Rich Lower Silurian Shale in the Upper Yangtze Platform, South China: A Possible Mechanism for Pore Development. Journal of Natural Gas Science and Engineering, 46: 1–15. https://doi.org/10.1016/j.jngse.2017.07.009 |
Clarkson, C. R., Bustin, R. M., Levy, J. H., 1997. Application of the Mono/Multilayer and Adsorption Potential Theories to Coal Methane Adsorption Isotherms at Elevated Temperature and Pressure. Carbon, 35(12): 1689–1705. https://doi.org/10.1016/S0008-6223(97)00124-3 |
Clarkson, C. R., Freeman, M., He, L., et al., 2012. Characterization of Tight Gas Reservoir Pore Structure Using USANS/SANS and Gas Adsorption Analysis. Fuel, 95: 371–385. https://doi.org/10.1016/j.fuel.2011.12.010 |
Dai, C., Zheng, Q., Chen, J., et al., 2013. Metallogenic Geological Background of Xuefeng Caledonian Tectonic Cycle in Guizhou. Geoscience Front, 20(6): 219–225 (in Chinese with English Abstract) |
Dong, T., He, Q., He, S., et al., 2021. Quartz Types, Origins and Organic Matter-Hosted Pore Systems in the Lower Cambrian Niutitang Formation, Middle Yangtze Platform, China. Marine and Petroleum Geology, 123: 104739. https://doi.org/10.1016/j.marpetgeo.2020.104739 |
Feng, Z. Q., Hao, F., Zhou, S. W., et al., 2020. Pore Characteristics and Methane Adsorption Capacity of Different Lithofacies of the Wufeng Formation-Longmaxi Formation Shales, Southern Sichuan Basin. Energy & Fuels, 34(7): 8046–8062. https://doi.org/10.1021/acs.energyfuels.0c00782 |
Fu, X. X., Zhao, C. P., Lun, Z. M., et al., 2021. Influences of Controlled Microwave Field Radiation on Pore Structure, Surface Chemistry and Adsorption Capability of Gas-Bearing Shales. Marine and Petroleum Geology, 130: 105134. https://doi.org/10.1016/j.marpetgeo.2021.105134 |
Fu, Y., Dong, L., Li, C., et al., 2016. New Re-Os Isotopic Constrains on the Formation of the Metalliferous Deposits of the Lower Cambrian Niutitang Formation. Journal of Earth Science, 27(2): 271–281. https://doi.org/10.1007/s12583-016-0606-7 |
Fu, Y., Zhou, W., Wang, H., et al., 2021. Sedimentary Environment and Geochemical Response of Lower Cambrian Black Rock Series in Northern Guizhou. Acta Geologica Sinica, 95(2): 536–548 (in Chinese with English Abstract) |
Guo, C., Fu, Y., Xia, P., et al., 2025. Tectonic Setting, Paleoenvironment and REE Source of the Lower Cambrian Phosphorites, Yangtze Block (South China). Palaeogeography, Palaeoclimatology, Palaeoecology, 665: 112821 |
Han, H., Cao, Y., Chen, S. J., et al., 2016. Influence of Particle Size on Gas-Adsorption Experiments of Shales: An Example from a Longmaxi Shale Sample from the Sichuan Basin, China. Fuel, 186: 750–757. https://doi.org/10.1016/j.fuel.2016.09.018 |
Han, T., Fan, H. F., Wen, H. J., et al., 2020. Petrography and Sulfur Isotopic Compositions of SEDEX Ores in the Early Cambrian Nanhua Basin, South China. Precambrian Research, 345: 105757. https://doi.org/10.1016/j.precamres.2020.105757 |
Hao, P., Meng, Y., Zeng, F., et al., 2020. Quantitative Study of Chemical Structures of Different Rank Coals Based on Infrared Spectroscopy. Spectroscopy and Spectral Analysis, 40(3): 787–792 (in Chinese with English Abstract) |
Harpalani, S., Prusty, B. K., Dutta, P., 2006. Methane/CO2 Sorption Modeling for Coalbed Methane Production and CO2 Sequestration. Energy & Fuels, 20(4): 1591–1599. https://doi.org/10.1021/ef050434l |
He, C. C., He, S., Zhang, T. W., et al., 2020. Structural Characteristics and Porosity Estimation of Organic Matter-Hosted Pores in Gas Shales of Jiaoshiba Block, Sichuan Basin, China. Energy Science & Engineering, 8(12): 4178–4195. https://doi.org/10.1002/ese3.796 |
Hong, J., Tang, X., Zhang, C., et al., 2020. Pore Development Characteristics and Controlling Factors of Organic Matter in Shale of Longmaxi Formation in Middle Yangtze Area: A Case Study of Well Yongye 3 in Yongshun Area, Hunan Province. Petroleum and Natural Gas Geology, 41(5): 1060–1072 (in Chinese with English Abstract) |
Hu, G., Pang, Q., Jiao, K., et al., 2020. Development of Organic Pores in the Longmaxi Formation Overmature Shales: Combined Effects of Thermal Maturity and Organic Matter Composition. Marine and Petroleum Geology, 116: 104314. https://doi.org/10.1016/j.marpetgeo.2020.104314 |
Hu, T., Pang, X. Q., Jiang, S., et al., 2018. Oil Content Evaluation of Lacustrine Organic-Rich Shale with Strong Heterogeneity: A Case Study of the Middle Permian Lucaogou Formation in Jimusaer Sag, Junggar Basin, NW China. Fuel, 221: 196–205. https://doi.org/10.1016/j.fuel.2018.02.082 |
Huo, P. L., Zhang, D. F., Yang, Z., et al., 2017. CO2 Geological Sequestration: Displacement Behavior of Shale Gas Methane by Carbon Dioxide Injection. International Journal of Greenhouse Gas Control, 66: 48–59. https://doi.org/10.1016/j.ijggc.2017.09.001 |
Jarvie, D. M., Hill, R. J., Ruble, T. E., et al., 2007. Unconventional Shale-Gas Systems: The Mississippian Barnett Shale of North-Central Texas as One Model for Thermogenic Shale-Gas Assessment. AAPG Bulletin, 91(4): 475–499. https://doi.org/10.1306/12190606068 |
Ji, W. M., Hao, F., Schulz, H. M., et al., 2019. The Architecture of Organic Matter and Its Pores in Highly Mature Gas Shales of the Lower Silurian Longmaxi Formation in the Upper Yangtze Platform, South China. AAPG Bulletin, 103(12): 2909–2942. https://doi.org/10.1306/04101917386 |
Joyner, L. G., Barrett, E. P., Skold, R., 1951. The Determination of Pore Volume and Area Distributions in Porous Substances. II. Comparison between Nitrogen Isotherm and Mercury Porosimeter Methods. Journal of the American Chemical Society, 73(7): 3155–3158. https://doi.org/10.1021/ja01151a046 |
Klimakow, M., Klobes, P., Rademann, K., et al., 2012. Characterization of Mechanochemically Synthesized MOFs. Microporous and Mesoporous Materials, 154: 113–118. https://doi.org/10.1016/j.micromeso.2011.11.039 |
Lehmann, B., Frei, R., Xu, L. G., et al., 2016. Early Cambrian Black Shale-Hosted Mo-Ni and V Mineralization on the Rifted Margin of the Yangtze Platform, China: Reconnaissance Chromium Isotope Data and a Refined Metallogenic Model. Economic Geology, 111(1): 89–103. https://doi.org/10.2113/econgeo.111.1.89 |
Li, M. H., Li, M. L., Huang, H. P., et al., 2022. Differences of Pore Features in Marine Shales between Lower Cambrian and Lower Silurian Formations of Upper Yangtze Area, South China. Energies, 15(3): 820. https://doi.org/10.3390/en15030820 |
Li, W. H., Wang, W. M., Lu, S. F., et al., 2017. Quantitative Characterization on Shale-Hosted Oil Reservoir: A Case Study of Argillaceous Dolomite Reservoir in the Jianghan Basin. Fuel, 206: 690–700. https://doi.org/10.1016/j.fuel.2017.06.056 |
Li, X., Cai, J. G., Liu, H. M., et al., 2020. Characterization of Shale Pore Structure by Successive Pretreatments and Its Significance. Fuel, 269: 117412. https://doi.org/10.1016/j.fuel.2020.117412 |
Liu, K. Q., Ostadhassan, M., Zhou, J., et al., 2017. Nanoscale Pore Structure Characterization of the Bakken Shale in the USA. Fuel, 209: 567–578. https://doi.org/10.1016/j.fuel.2017.08.034 |
Löhr, S. C., Baruch, E. T., Hall, P. A., et al., 2015. Is Organic Pore Development in Gas Shales Influenced by the Primary Porosity and Structure of Thermally Immature Organic Matter? Organic Geochemistry, 87: 119–132. |
Loucks, R. G., Reed, R. M., Ruppel, S. C., et al., 2012. Spectrum of Pore Types and Networks in Mudrocks and a Descriptive Classification for Matrix-Related Mudrock Pores. AAPG Bulletin, 96(6): 1071–1098 (in Chinese with English Abstract) doi: 10.1306/08171111061 |
Miao, Y. N., Li, X. F., Wang, X. Z., et al., 2017. Review on Hydrocarbon Generation, Pores Formation and Its Methane Adsorption Mechanism in Shale Kerogen. Scientia Sinica Physica, Mechanica & Astronomica, 47(11): 114604. |
Mikutta, R., Kleber, M., Jahn, R., 2005. Poorly Crystalline Minerals Protect Organic Carbon in Clay Subfractions from Acid Subsoil Horizons. Geoderma, 128(1/2): 106–115. https://doi.org/10.1016/j.geoderma.2004.12.018 |
Milliken, K. L., Rudnicki, M., Awwiller, D. N., et al., 2013. Organic Matter-Hosted Pore System, Marcellus Formation (Devonian), Pennsylvania. AAPG Bulletin, 97(2): 177–200. https://doi.org/10.1306/07231212048 |
Nelson, P. H., 2009. Pore-Throat Sizes in Sandstones, Tight Sandstones, and Shales. AAPG Bulletin, 93(3): 329–340. https://doi.org/10.1306/10240808059 |
Ning, S., Xia, P., Hao, F., et al., 2021. Shale Facies and Its Relationship with Sedimentary Environment and Organic Matter of Niutitang Black Shale, Guizhou Province. Natural Gas Geoscience, 32(9): 1297–1307 (in Chinese with English Abstract) |
Okolo, G. N., Everson, R. C., Neomagus, H. W. J. P., et al., 2015. Comparing the Porosity and Surface Areas of Coal as Measured by Gas Adsorption, Mercury Intrusion and SAXS Techniques. Fuel, 141: 293–304. https://doi.org/10.1016/j.fuel.2014.10.046 |
Shi, C. H., Cao, J., Han, S. C., et al., 2021. A Review of Polymetallic Mineralization in Lower Cambrian Black Shales in South China: Combined Effects of Seawater, Hydrothermal Fluids, and Biological Activity. Palaeogeography, Palaeoclimatology, Palaeoecology, 561: 110073. |
Sircar, S., 1999. Gibbsian Surface Excess for Gas AdsorptionRevisited. Industrial & Engineering Chemistry Research, 38(10): 3670–3682. https://doi.org/10.1021/ie9900871 |
Slatt, R. M., O'Brien, N. R., 2011. Pore Types in the Barnett and Woodford Gas Shales: Contribution to Understanding Gas Storage and Migration Pathways in Fine-Grained Rocks. AAPG Bulletin, 95(12): 2017–2030. https://doi.org/10.1306/03301110145 |
Song, Y., Gao, F., Tang, X., et al., 2020. Influencing Factors of Pore Structure Differences between Marine and Terrestrial Shale Reservoirs. Acta Petrolei Sinica, 41(12): 1501–1512 (in Chinese with English Abstract) doi: 10.7623/syxb202012005 |
Sun, L. N., Fu, D. L., Wu, Y. D., et al., 2022. The Current Study and Development of Organic Matter Pores in Organic-Rich Shale. Arabian Journal of Geosciences, 15: 62. https://doi.org/10.1007/s12517-021-09384-2 |
Wang, B., Wang, C., Wang, X., et al., 2019. Characteristics of Aromatic Compounds in High-Over Matured Marine Shale and Its Significance to Shale Gas. Earth Science, 44(11): 3705–3716 (in Chinese with English Abstract) |
Wang, F. Y., Guan, J., Feng, W. P., et al., 2013. Evolution of Overmature Marine Shale Porosity and Implication to the Free Gas Volume. Petroleum Exploration and Development Online, 40(6): 819–824. https://doi.org/10.1016/s1876-3804(13)60111-1 |
Wang, P. F., Zhang, C., Li, X., et al., 2020. Organic Matter Pores Structure and Evolution in Shales Based on the He Ion Microscopy (HIM): A Case Study from the Triassic Yanchang, Lower Silurian Longmaxi and Lower Cambrian Niutitang Shales in China. Journal of Natural Gas Science and Engineering, 84: 103682. https://doi.org/10.1016/j.jngse.2020.103682 |
Wang, Q. Q., Li, W., Zhang, D. F., et al., 2016. Influence of High-Pressure CO2 Exposure on Adsorption Kinetics of Methane and CO2 on Coals. Journal of Natural Gas Science and Engineering, 34: 811–822. https://doi.org/10.1016/j.jngse.2016.07.042 |
Wang, R. Y., Gu, Y., Ding, W. L., et al., 2016. Characteristics and Dominant Controlling Factors of Organic-Rich Marine Shales with High Thermal Maturity: A Case Study of the Lower Cambrian Niutitang Formation in the Cen'gong Block, Southern China. Journal of Natural Gas Science and Engineering, 33: 81–96. https://doi.org/10.1016/j.jngse.2016.05.009 |
Wang, T. C., Bury, W., Gómez-Gualdrón, D. A., et al., 2015. Ultrahigh Surface Area Zirconium MOFs and Insights into the Applicability of the BET Theory. Journal of the American Chemical Society, 137(10): 3585–3591. https://doi.org/10.1021/ja512973b |
Wu, Z. R., He, S., Han, Y. J., et al., 2020. Effect of Organic Matter Type and Maturity on Organic Matter Pore Formation of Transitional Facies Shales: A Case Study on Upper Permian Longtan and Dalong Shales in Middle Yangtze Region, China. Journal of Earth Science, 31(2): 368–384. https://doi.org/10.1007/s12583-019-1237-6 |
Xia, P., Hao, F., Yang, C., et al., 2024. Mechanism of Organo-Nickel Co-Enrichment in Marine Black Shale. Advances in Geo-Energy Research, 13(1): 10–21. https://doi.org/10.46690/ager.2024.07.03 |
Xia, P., Fu, Y., Yang, Z., et al., 2020. Relationship between Sedimentary Environment and Organic Matter Enrichment of Black Shale in Niutitang Formation, Zhenyuan, Northern Guizhou. Acta Geologica Sinica, 94(3): 947–956 (in Chinese with English Abstract) doi: 10.3969/j.issn.0001-5717.2020.03.019 |
Xia, P., Li, H. N., Fu, Y., et al., 2021. Effect of Lithofacies on Pore Structure of the Cambrian Organic-Rich Shale in Northern Guizhou, China. Geological Journal, 56(2): 1130–1142. https://doi.org/10.1002/gj.3991 |
Xiong, J., Liu, X. J., Liang, L. X., et al., 2017. Adsorption of Methane in Organic-Rich Shale Nanopores: An Experimental and Molecular Simulation Study. Fuel, 200: 299–315. https://doi.org/10.1016/j.fuel.2017.03.083 |
Xu, L., Lehmann, B., Mao, J., et al., 2011. Re-Os Age of Polymetallic Ni-Mo-PGE-Au Mineralization in Early Cambrian Black Shales of South China: A Reassessment. Economic Geology, 106(3): 511–522. https://doi.org/10.2113/econgeo.106.3.511 |
Yang, F., Ning, Z. F., Wang, Q., et al., 2016. Pore Structure Characteristics of Lower Silurian Shales in the Southern Sichuan Basin, China: Insights to Pore Development and Gas Storage Mechanism. International Journal of Coal Geology, 156: 12–24. https://doi.org/10.1016/j.coal.2015.12.015 |
Yang, Z., Wu, P., Fu, Y., et al., 2022. Coupling of the Redox History and Enrichment of Ni-Mo in Black Shale during the Early Cambrian: Constraints from S-Fe Isotopes and Trace Elements of Pyrite, South China. Ore Geology Reviews, 143: 104749. https://doi.org/10.1016/j.oregeorev.2022.104749 |
Zhang, D. F., Cui, Y. J., Liu, B., et al., 2011. Supercritical Pure Methane and CO2 Adsorption on Various Rank Coals of China: Experiments and Modeling. Energy & Fuels, 25(4): 1891–1899. https://doi.org/10.1021/ef101149d |
Zhang, L. C., Xiao, D. S., Lu, S. F., et al., 2020. Pore Development of the Lower Longmaxi Shale in the Southeastern Sichuan Basin and Its Adjacent Areas: Insights from Lithofacies Identification and Organic Matter. Marine and Petroleum Geology, 122: 104662. https://doi.org/10.1016/j.marpetgeo.2020.104662 |
Zhang, S. S., Liang, C., Xian, W. W., 2020. Spatial and Temporal Distributions of Terrestrial and Marine Organic Matter in the Surface Sediments of the Yangtze River Estuary. Continental Shelf Research, 203: 104158. https://doi.org/10.1016/j.csr.2020.104158 |
Zhang, W. T., Hu, W. X., Borjigin, T., et al., 2020. Pore Characteristics of Different Organic Matter in Black Shale: A Case Study of the Wufeng-Longmaxi Formation in the Southeast Sichuan Basin, China. Marine and Petroleum Geology, 111: 33–43. https://doi.org/10.1016/j.marpetgeo.2019.08.010 |
Zhao, Y., Cai, J., Lei, T., et al., 2018. Quantitative Characterization of Organic Matter with Different Occurrence States in Argillaceous Source Rocks: A Case Study of Shahejie Formation in Dongying Sag. Petroleum Geology of Xinjiang, 39(4): 416–423 (in Chinese with English Abstract) |
Zhou, W., 2017. Sedimentary Environment and Geochemical Characteristics of the Lower Cambrian Black Rock Series in Northern Guizhou. Guizhou University, Guiyang (in Chinese with English Abstract) |
Zhou, X. Q., Chen, D. Z., Dong, S. F., et al., 2015. Diagenetic Barite Deposits in the Yurtus Formation in Tarim Basin, NW China: Implications for Barium and Sulfur Cycling in the Earliest Cambrian. Precambrian Research, 263: 79–87. https://doi.org/10.1016/j.precamres.2015.03.006 |
Zhu, L., Zhang, D., Zhang, J., et al., 2019. Geological Theory and Practice of Shale Gas in Paleozoic Passive Continental Margin, Eastern of Upper Yangtze. Science Press, Beijing (in Chinese with English Abstract) |
Zhu, X. J., Cai, J. G., Wang, Y. S., et al., 2020. Evolution of Organic-Mineral Interactions and Implications for Organic Carbon Occurrence and Transformation in Shale. GSA Bulletin, 132(3/4): 784–792. https://doi.org/10.1130/b35223.1 |
Zou, C. N., Dong, D. Z., Wang, S. J., et al., 2010. Geological Characteristics and Resource Potential of Shale Gas in China. Petroleum Exploration and Development, 37(6): 641–653. https://doi.org/10.1016/s1876-3804(11)60001-3 |
Zou, C., Zhao, Q., Cong, L., et al., 2021. Development Progress, Potential and Prospect of Shale Gas in China. Natural Gas Industry, 41(1): 1–14 (in Chinese with English Abstract) |
Sample | TOC (%) | R2 | 2am (mmol/g) | Pore volume (cm3/g) | Specific surface area (m2/g) | |||
Micropore | Mesopore | Micropore | Mesopore | |||||
SLraw | 3.42 | 1.718 1 | 1.593 | 0.002 12 | 0.004 41 | 7.196 75 | 1.500 73 | |
SLext | 3.09 | 1.746 9 | 1.551 | 0.002 09 | 0.004 74 | 7.121 05 | 1.625 93 | |
SLoxi | 1.57 | 8.380 7 | 0.799 | 0.000 65 | 0.005 16 | 2.262 00 | 1.655 49 | |
XDraw | 5.78 | 2.010 4 | 4.317 | 0.006 24 | 0.021 84 | 20.741 50 | 12.528 80 | |
XDext | 5.07 | 2.031 5 | 4.373 | 0.006 32 | 0.024 01 | 20.691 50 | 12.549 36 | |
XDoxi | 1.86 | 2.768 5 | 1.734 | 0.002 13 | 0.012 65 | 7.218 07 | 4.126 93 | |
R2 is multiple correlation coefficient; 2am is maximum adsorption amount. |