Loading [MathJax]/jax/output/SVG/jax.js
Advanced Search

Indexed by SCI、CA、РЖ、PA、CSA、ZR、etc .

Chuya Wang, Yuande Yang, Fei Li, Junhao Wang, Leiyu Li, Huiting Yu. Water Changes and Sources of Siling Co Using Landsat and GRACE Data since 1972. Journal of Earth Science, 2024, 35(2): 687-699. doi: 10.1007/s12583-022-1761-7
Citation: Chuya Wang, Yuande Yang, Fei Li, Junhao Wang, Leiyu Li, Huiting Yu. Water Changes and Sources of Siling Co Using Landsat and GRACE Data since 1972. Journal of Earth Science, 2024, 35(2): 687-699. doi: 10.1007/s12583-022-1761-7

Water Changes and Sources of Siling Co Using Landsat and GRACE Data since 1972

doi: 10.1007/s12583-022-1761-7
More Information
  • Corresponding author: Yuande Yang, yuandeyang@whu.edu.cn; Fei Li, fli@whu.edu.cn
  • Received Date: 20 Jun 2022
  • Accepted Date: 30 Sep 2022
  • Available Online: 11 Apr 2024
  • Issue Publish Date: 30 Apr 2024
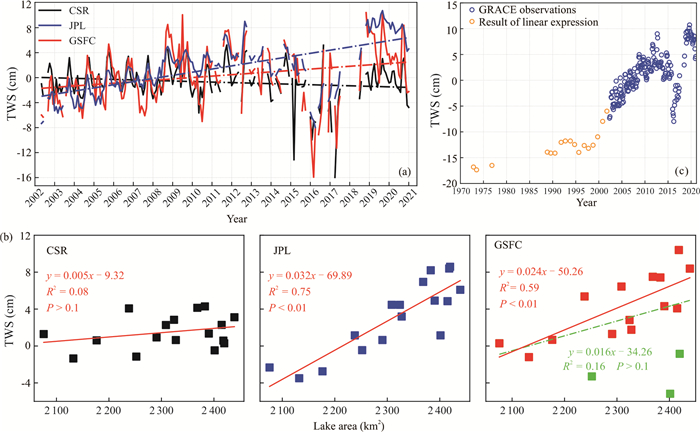
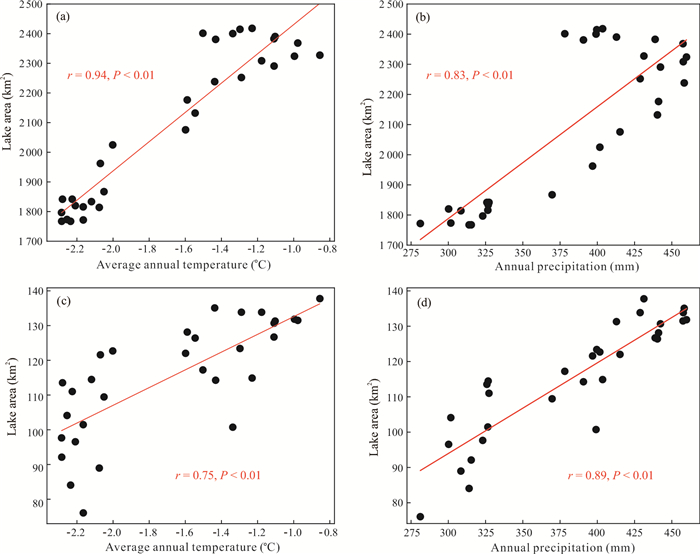
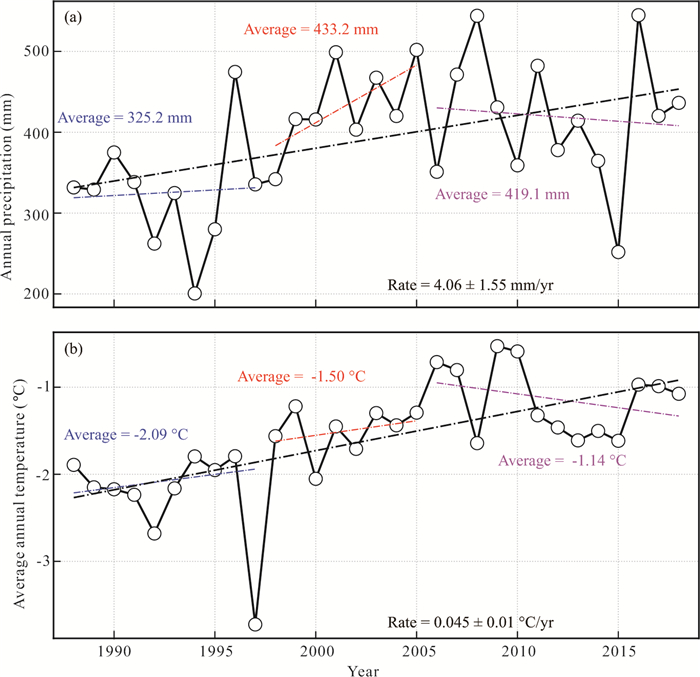
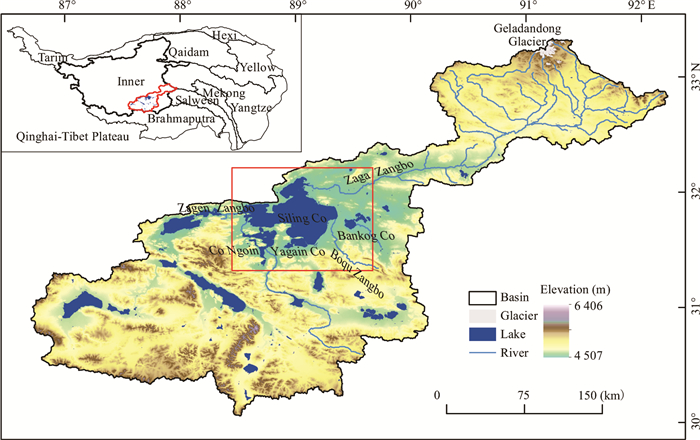
  • The inland lakes on the Tibetan Plateau (TP) are undergoing significant changes due to their sensitivity to climate. The largest lake in Tibet, Siling Co, has expanded most dramatically during recent decades. Using Landsat, GRACE and meteorological data, the expansion of Siling Co was detailed in four stages and the process was further explained. The results show that the lake area increased from 1 647.30 km2 in 1972 to 2 438.99 km2 in 2020. It experienced a slow growth at a rate 6.03 km2/yr from 1972 to 1988, while fluctuating at 1.44 km2/yr during 1989–1997, then accelerated at 60.28 km2/yr between 1998 and 2005, and expanded slowly again at 11.40 km2/yr since 2006. The continued expansion led to its merger with nearby Yagain Co in 2003. Terrestrial water storage (TWS) increase was also observed from GRACE (0.65 cm/yr), with about 0.75 coefficient of determination between the TWS and lake area during 2002–2020. The long-term expansion of Siling Co is related to the increasing trends of temperature and precipitation, but their contributions vary with time span. Specifically, the accelerated stage between 1998 and 2005 can be explained by the increased temperature and precipitation accompanied by a drop in evaporation, while the slow expansion since 2006 was due to the decrease in precipitation and temperature and the rise in evaporation. There is no obvious mass loss of glaciers revealed by GRACE during 2002–2020, which may be related to the negative trend of the temperature. Furthermore, the precipitation may still make a major contribution in this phase, as its average is about 93.9 mm higher than that in 1988–1997.


  • Electronic Supplementary Materials: Supplementary materials (Figures S1–S5) are available in the online version of this article at https://doi.org/10.1007/s12583-022-1761-7.
    Conflict of Interest
    The authors declare that they have no conflict of interest.
  • As the third pole of the earth, the Qinghai-Tibetan Plateau (QTP) is the largest and highest plateau in the world and plays an important role in the climate system through the interaction of the lithosphere, hydrosphere, atmosphere, biosphere and cryosphere (Wang and Wei, 2022; Qin et al., 2018). The glacial permafrost and snowfall precipitation within the Tibetan Plateau provide the input for Asian rivers and gives rise to the highest and largest group of lakes on earth. These inland lakes are sensitive to climate change, and analysis of their evolution is important for understanding the links between the hydrological and climatic environments of the plateau (Zhao et al., 2021; Liu et al., 2009). However, the harsh conditions of remote and high-altitude lakes on the TP pose further challenges. The in-situ investigations and observations are only available for a few large lakes, and are limited in spatial coverage and temporal continuity (Lei et al., 2014; Zhang B et al., 2011). For longer and more extensive monitoring of these lakes, satellite remote sensing has proved to be a practical method (Liu et al., 2021; Gong, 2012). Using Landsat imagery data, Zhang et al. (2019) conducted a detailed study of changes in the number and area of TP lakes over the last 40 years. It was found that there were 1 424 lakes larger than 1 km2 by 2018, with a total area of up to 5.0 × 10⁴ ± 791.4 km2. Among the growing lakes, the Siling Co lake has expanded the most, becoming the largest lake in Tibet (Zhang et al., 2013).

    The expansion of the Siling Co and its climate change has been discussed in numerous studies (Dejiyangzong et al., 2018; Yang Z et al., 2015; Du et al., 2014; Meng et al., 2012; Zhang Y et al., 2011b; Duo et al., 2010; Yang R H et al., 2003), but the mechanism of its expansion remains controversial. The change in water storage of lake is bound to be a response to climate change, as QTP is warming by more than three times that of the global average (IPCC, 2014), and the climate warming influenced the regional precipitation (Wang et al., 2008), and the melting of glaciers and permafrost (Kang et al., 2010). Meng et al. (2012) quantified the lake area of Siling Co between 1976 and 2009 using Landsat and discussed the causes of the expansion in conjunction with a digital elevation model (DEM), concluding that glacial melt caused by rising temperatures was the main reason for the dramatic rise in the lake area while precipitation was a secondary one. Dejiyangzong et al. (2018) obtained a similar conclusion by extending the time series to 2016 and analysing the change in glacier area of the basin. However, using DEM and InSAR data, Liu et al. (2019) showed that glacial ablation contributed only 5.52% to the lake level rise, and Lei et al. (2013) attributed the overall expansion of the lake to a significant increase in precipitation and runoff by water balance modeling. In fact, there are distinct stages in the expansion of the Siling Co (Fang et al., 2016; Meng et al., 2012). The change in the lake area could be the result of a combination of factors such as precipitation, glacial meltwater and evaporation (Zhou et al., 2015; Zhang Y et al., 2011b), and the contribution of these factors may be different in different stages. Therefore, analysing the relationship between the changes of Siling Co area and meteorological elements in stages is important to understand the mechanisms of its expansion.

    The main source of water for Siling Co is also under discussion, with most believing it to be precipitation or glacial meltwater. Obviously, it is difficult to accurately quantify the contribution of glacial meltwater to the growth of Siling Co. in the absence of hydrological observations. However, the increase of meltwater implies a transfer of glacial mass to lake, which may require investigation of mass changes on larger spatial scales. GRACE (Gravity Recovery and Climate Experiment) is a new effective way to monitor water storage change since 2002, and it became a standard tool for mass change over large regions, usually with a spatial resolution about 300 km and a time resolution about 1 month. Unlike geometric signals such as water area extracted from optical images, GRACE observations provide an integrated signal of water storage, including snow, surface water, soil moisture and groundwater. Hence, the GRACE gravity satellite can obtain precise information about the Earth's gravity field and its temporal variations that reflect Earth's mass transport, especially involving hydrological signals, providing a new means of explaining many natural physical phenomena such as glacial melting (Song et al., 2015; Gardner et al., 2013) and changes in terrestrial water storage (Zou et al., 2019; Jiao et al., 2015; Song et al., 2013). In addition, GRACE measurements have the advantage of uniform distribution and well-defined stochastic properties, as well as almost global coverage (Jacob et al., 2012). Mascon (Mass concentration) is a new generation of GRACE observational data product and has been widely used in a range of applications, such as ice sheet and hydrological process. Compared to spherical harmonic solutions, mascon has a higher spatial resolution (Spatial sampling of both latitude and longitude less than 1/2 degree, approximate 56 km at the equator), facilitating the estimate of mass changes in basin-scale (Loomis et al., 2019; Save et al., 2016; Watkins et al., 2015).

    GRACE is often combined with optical images to study long-term hydrological characteristics of lake basins (Buma et al., 2018; Singh et al., 2012). On the one hand, changes in lake area can be verified by comparing TWS changes from GRACE (Buma et al., 2018), and on the other hand, the spatial differences in the GRACE signal may also suggest sources of replenishment of lake water (Wang et al., 2016), which is beneficial for estimating and analysing the water balance on a regional scale by combining other data sources. Awange et al. (2008) used GRACE to study the fall in water level of Lake Victoria and concluded that the major contributor is the discharge from the expanded dam since rainfall remained stable. Using GRACE, changes in water storage on the TP and the role of precipitation and glacial meltwater in lake water budgets have been widely discussed (Zou et al., 2019; Wang et al., 2016; Song et al., 2015, 2013). However, most of these studies were conducted on large spatial scales, and changes of individual lake basins in TP were rarely discussed. Zhou et al. (2016) and Wang et al. (2018) demonstrated the potential of GRACE to monitor mass changes in large lakes, such as the Poyang Lake and Qinghai Lake. As the largest lake in Tibet, Siling Co has an area of more than 2 000 km2 after 2002, with the maximum length and width over 80 and 66 km respectively, exceeding the resolution of GRACE. Therefore, GRACE may provide a new perspective on the spatial water change process in Siling Co Basin.

    The objective of this study is to form a comprehensive understanding of the phased expansion process of Siling Co and investigate the water storage variation and sources from GRACE. The long-term area changes of Siling Co from 1972 to 2020 with four stages were first quantified using Landsat data. Then, the water storage time series was derived from GRACE and GRACE-FO data between 2002 and 2020. After the combination analysis from the lake area and TWS, the TWS time series before 2002 was derived. Finally, the phased expansion of Siling Co was explained using meteorological data and the water source was also discussed according to the spatial analysis with GRACE.

    Located in the Nagqu Prefecture of Tibet and at the northern foothills of Kailas Range, Siling Co (31°19′N–32°8′N, 88°25′E–89°40′E) Basin belongs to the Inner Basin of the TP (Figure 1). As the second-largest saline lake in China, the surface elevation and the area of Siling Co in April 2009 were about 4 543.79 m and 2 178.37 km2, respectively, with a mean annual average temperature of about 0–2 ℃ and average annual precipitation of 150–350 mm (Sun et al., 2020; Zhang et al., 2013). Summer (from May to September) is the main precipitation season in the Siling Co Basin, and from the end of December to Mid-April of the following year, the lake is ice-covered. The topography of Siling Co is lower than that of the surrounding areas, which makes it a centre where water converges. Its recharge rivers include Zaga Zangbo in the north from Geladandong Glacier, Boqu Zangbo in the east from Jiagang Glacier and Zagen Zangbo in the west from Baburi Glacier, of which the Zaga Zangbo is the longest about 409 km (Duo et al., 2010). Geladandong Glacier is located in the upper northeastern part of Siling Co Basin, and its meltwater is considered to be one of the important sources of water for Siling Co (Dejiyangzong et al., 2018; Meng et al., 2012; Zhang Y et al., 2011). Two adjacent smaller lakes Bankog Co and Ngoin Co are less than 10 km away from the Siling Co, but are not fed by the glaciers (Duo et al., 2010). Co Ngoin is on the southwest side of Siling Co, while Bankog Co on the east side. The lumped three lakes have similar climate conditions, and their dynamics are often discussed together in comparison (Dejiyangzong et al., 2018; Meng et al., 2012).

    Figure  1.  The location and topography of Siling Co Basin. The red box represents the extent of the Siling Co study area.

    Optical images are often used to monitor the changes in water surface areas (Huang et al., 2018). Of which, Landsat has been most widely used in such studies since the 1970s because of the long archive, free of charge and medium resolution. The Landsat series data were proposed and implemented by NASA (National Aeronautics and Space Administration) to survey terrestrial and oceanic resources, monitor and assist in the management of the natural environment, and take images and produce thematic maps. To study the lake area change since the 1970s, several Landsat type images from 1972 to 2020 were used, including MSS (Multispectral Scanner), TM (Thematic Mapper), ETM+ (Enhanced Thematic Mapper Plus) and OLI_TIRS (Operational Land Imager and Thermal Infrared Sensor). The spatial resolution differs with series. Besides the 60 m resolution of MSS, the other three were about 30 m.

    Seasonal differences in lake area could appear due to the time-lagged precipitation. In this regard, the Landsat images from September to November were preferred because the lake area is relatively stable during these months of each year (Zhang et al., 2017). As an optical sensor, Landsat is subject to the cloud, the images with less than 5% of cloud cover were selected to reduce the effect of cloud, which also leaves the images of some years not within the optimal month window. All selected images for this study are listed in Table 1.

    Table  1.  Details of selected Landsat images
    Year Date Sensor type Path/row
    1972 10-02 Landsat 1 MSS 150/38
    1973 06-11 Landsat 1 MSS 150/38
    1976 10-08 Landsat 2 MSS 150/38
    1988 10-14 Landsat 5 TM 139/38
    1989 07-29 Landsat 5 TM 139/38
    1990 06-30 Landsat 5 TM 139/38
    1991 10-07 Landsat 5 TM 139/38
    1992 09-23 Landsat 5 TM 139/38
    1993 10-28 Landsat 5 TM 139/38
    1994 09-29 Landsat 5 TM 139/38
    1995 08-15 Landsat 5 TM 139/38
    1996 10-20 Landsat 5 TM 139/38
    1997 09-05 Landsat 5 TM 139/38
    1998 09-08 Landsat 5 TM 139/38
    1999 09-19 Landsat 7 ETM+ 139/38
    2000 10-07 Landsat 7 ETM+ 139/38
    2001 09-24 Landsat 7 ETM+ 139/38
    2002 10-29 Landsat 7 ETM+ 139/38
    2003 11-25 Landsat 5 TM 139/38
    2004 10-10 Landsat 5 TM 139/38
    2005 09-27 Landsat 5 TM 139/38
    2006 06-10 Landsat 5 TM 139/38
    2007 10-03 Landsat 5 TM 139/38
    2008 10-05 Landsat 5 TM 139/38
    2009 08-05 Landsat 5 TM 139/38
    2010 08-08 Landsat 5 TM 139/38
    2011 08-27 Landsat 5 TM 139/38
    2012 09-06 Landsat 7 ETM+ 139/38
    2013 07-31 Landsat 8 OLI_TIRS 139/38
    2014 10-06 Landsat 8 OLI_TIRS 139/38
    2015 09-07 Landsat 8 OLI_TIRS 139/38
    2016 09-09 Landsat 8 OLI_TIRS 139/38
    2017 09-28 Landsat 8 OLI_TIRS 139/38
    2018 10-01 Landsat 8 OLI_TIRS 139/38
    2019 06-30 Landsat 8 OLI_TIRS 139/38
    2020 10-06 Landsat 8 OLI_TIRS 139/38
     | Show Table
    DownLoad: CSV

    One of the key steps for lake area study is to extract the water body. There exist several methods, such as the single-band threshold, multi-band relationship and the water index. The single-band threshold method requires iterations in extracting water bodies based on the wave characteristics presented in the images, but with a high rate of missing water body information. Although overcoming the problem of missing water information extraction, the multi-band relationship method usually misjudges paddy fields and shadows as water bodies. Of the water index method, different stragedies have been put forward, such as Normalized Difference Water Index (NDWI) (McFeeters, 1996), Modified Normalized Difference Water Index (MNDWI) (Han, 2005), Normalized Difference Moisture Index (NDMI) (Jin and Sader, 2005) and Water Ratio Index (WRI) (Rokni et al., 2014). Of which, the NDWI appears to be more robust in detecting the lake extent under various water conditions (Qiao et al., 2019). It has been widely and successfully applied to extract the water body and lake area monitor (Li et al., 2013; Ji et al., 2009; McFeeters, 1996). Hence, the NDWI is directly used for the Siling Co monitor in this study, calculated from

    NDWI=(ρGreenρNIR)/(ρGreen+ρNIR) (1)

    where $ {\rho }_{\mathrm{G}\mathrm{r}\mathrm{e}\mathrm{e}\mathrm{n}} $ and $ {\rho }_{\mathrm{N}\mathrm{I}\mathrm{R}} $ are the reflectance at the green and near-infrared (NIR) wavelength, i.e., bands 2 (green) and 4 (NIR) of Landsat TM/ETM+ or bands 3 (green) and 5 (NIR) of Landsat OLI_TIRS, respectively. Due to the stronger absorption of radiation in the NIR spectrum, water has a low reflectance in this spectral region and any land surface has higher reflection than water in the band (Feng et al., 2012). In contrast, water has much higher reflectance in the green band than that in the NIR band. As a result, the NDWI enhances the spectral characteristics of water and suppresses background noise. The value of NDWI ranges from -1 to 1, and zero is used as the threshold. Water is judged to be positive (McFeeters, 1996). However, this threshold is not always proper for lakes. For example, 0.2–0.3 is found more suitable for Sikkim lakes, and 0.2–0.54 for small supraglacial lakes in Gangotri (Mitkari et al., 2017; Raj et al., 2013). After repeated visual interpretation and verification, 0.25–0.3 is selected in this paper, and an example is shown in Figure S1. With this threshold, lake water bodies and land covers were classified, then the extracted lake surface was visually interpreted and the misclassified objects were manually modified. Finally, the lake area was obtained by calculating the sum of the areas of all pixels in the lake water body.

    Several types of products are provided by GRACE mission, such as R1 and R2. Of which, R2 products need a further filter, often with a typical 300–400 km spatial resolution and 1-month time resolution. R1 data were produced by the mascon method designed to give the user a product without any post-treatment process, overcoming additional errors in R2 product. Moreover, GRACE Mascon products have a higher spatial resolution and are widely used for mass change study of the Earth system.

    The GRACE Mascon products were produced by three official organizations, namely Center for Space Research (CSR, http://www2.csr.utexas.edu/grace) at the University of Texas at Austin, the Jet Propulsion Laboratory (JPL, https://doi.org/10.5067/TEMSC-3MJ62) and NASA Goddard Space Flight Center (GSFC, https://earth.gsfc.nasa.gov/geo/data/grace-mascons), with different parameters and data processing strategies (Loomis et al., 2019; Save et al., 2016; Watkins et al., 2015). Their spatial resolution varies, where CSR is 0.25° by 0.25°, JPL and GSFC 0.5° by 0.5°. The equivalent water heights are provided by the products and used in this paper.

    Several studies have used meteorological station observations to analyse the climate change of Siling Co (Dejiyangzong et al., 2018; Yi and Zhang, 2015; Meng et al., 2012). However, there are few stations available, with only two distant stations Shenza and Bange about 80 km apart Selin Co. Hence the reanalysis and modelling data are commonly used instead (Zhou et al., 2015; Maussion et al., 2014). The China Meteorological Forcing Dataset (CMFD) is a near-surface meteorological reanalysis dataset developed by the Institute of Tibetan Plateau Research, Chinese Academy of Sciences, and has been widely used in hydrological and climate studies of TP (Ma et al., 2019, 2016; Lei et al., 2017). Xue et al. (2013) used this dataset to simulate the water and energy cycle in Naqu River watershed adjacent to Siling Co Basin with good results, while Zhou et al. (2015) further evaluated the accuracy of the data and explored the water storage of Siling Co from a hydrological modeling.

    CMFD is based on the internationally available reanalysis, GLDAS (Global Land Data Assimilation System), radiation and precipitation data, and further integrated with meteorological observations from the China Meteorological Administration, with a spatial resolution of 0.1° by 0.1° (He et al., 2020). Seven near-surface meteorological elements are provided in CMFD (Yang and He, 2019), including 2-m air temperature, surface pressure, specific humidity, 10 m wind speed, downward shortwave radiation, downward longwave radiation and precipitation rate. In this study, the precipitation and temperature data from CMFD were used. Compared with the observations from Shenza station, the CMFD grid data showed a high agreement (Wang et al., 2020), further confirming the rationality of the dataset for application in the Siling Co Basin.

    Using Landsat data, the lake boundaries for Siling Co and its two nearby lakes were derived and the lake areas were calculated, and the results are shown in Figure 2. Figure 2a shows the detailed area time series of Siling Co with and without Yagain Co since 1972, and also that of Yagain Co. The Tibetan Plateau (1970s–2021) lake data (V3.0) released by Tibetan Plateau Data Center (http://data.tpdc.ac.cn/) is used for comparison (Zhang, 2022). Compared with the only 14 data from Zhang (2022), the time series in this study is more complete. There is only one noticeable difference that in 2000, with the published lake area being about the same as the area we obtained for 1999. This may be caused by differences in the images used to extract the lake area, as the published area data do not mention a specific date and the imagery used may be from before the precipitation season, e.g., January 2000. Nevertheless, the estimates are still in high agreement (R2 > 0.99) with the published lake areas (Figure S2), suggesting that the results of this study are credible.

    Figure  2.  (a) Annual changes in the area of Siling Co and Siling Co with Yagain Co from 1972 to 2020, with the inset showing the area changes of Yagain Co. The dashed boxes represent four periods of lake change, 1972–1988, 1989–1997, 1998–2005 and 2006–2020. Vertical grey line indicates the time when Siling Co and Yagain Co began to connect. (b) Annual changes in the area of Bankog Co and Co Ngoin from 1988 to 2020. The dashed line shows the trend of Bankog Co with P-value < 0.05. (c) Changes in lake boundary of Siling Co from 1972 to 2020, Bankog Co and Co Ngoin from 1988 to 2020.

    Clearly, Siling Co has experienced a significant expansion during the past 48 years, with an increase from 1 647.30 km2 in 1972 to 2 438.99 km2 in 2020, corresponding to a proportional growth rate of about 48%. Moreover, the area of Siling Co experienced four stages observed, corresponding to 1972–1988, 1989–1997, 1998–2005 and 2006–2020. From the Figure 2, the area of Yagain Co increases quickly in 2003, which is due to the water level increase flow from Siling Co. As the two lakes merged in 2003, the area of single Siling Co and two lakes together was calculated, respectively. For the first stage 1972–1988, the lake experienced a slight expansion, with an increase rate of area 6.03 ± 0.86 km2/yr for single Siling Co and 6.42 ± 0.95 km2/yr for two lakes together. In the process, Siling Co increased by 86.29 km2 and Yagain Co by 5.23 km2. For the second stage 1989–1997, the lake area showed no significant trend and fluctuated slightly at a rate about 1.44 ± 4.16 and 1.87 ± 4.26 km2/yr without and with Yagain Co. The area increment of Siling Co was 25.97 km2 compared to 3.38 km2 for Yagain Co. However, an obvious acceleration is observed in the third stage 1998–2005, at a rate about 52.70 ± 3.49 km2/yr and 60.28 ± 2.32 km2/yr, respectively. Hence, the rate of the third stage is about ten times that of the first stage, and the lake area significantly increased by 466.08 km2, changing from the single Siling Co to a new Siling Co connected to Yagain Co. Subsequently, the growth of the new Siling Co stabilized with an increase rate 11.40 ± 1.24 km2/yr between 2006 and 2020 (i.e., the fourth stage), which is still at a rate about twice that of the first stage.

    The area time series of Bankog Co and the Co Ngoin were also calculated and shown in Figure 2b. There exist differences in the area changes between the two lakes. The overall positive rate is estimated as 0.91 ± 0.25 km2/yr between 1988 and 2020 for the Bankog Co, with the area increased from 104.11 to 120.02 km2. However, it experienced a decrease between 1993 and 1995, followed by a steady rise until 2010, and declined again then. During 1995–2005, it rapidly increased by 59.02 km2, which was the fastest period of expansion consistent with Siling Co. Different from Bankog Co, Co Ngoin fluctuated between 1988 and 2020 with no obvious trend. Compared with its original size in 1988 (280.92 km2), the area increment was only 1.81 km2 in 2020.

    The boundary changes of the three lakes are shown in Figure 2c. It is clear that Siling Co has expanded in almost every direction in 40 years, with the greatest extension of lake boundary between 1998 and 2006, which is consistent with the lake area increase. The most obvious expansion was observed in the north located near 89°E and 31.7°N, and it was initially along the Zaga Zangbo River toward north before 1998, then extending toward north and east till 2006, and continuously east. The other parts were relatively stable from 1972 to 1998, but began to expand thereafter. In the East, the expansion was observed along the coast, especially in the southeast part. In the west, the lake enlarged mainly along the southwest coast. Meanwhile, Yagain Co expanded to the south. In 2003, the two lakes merged. After the merge of the two lakes, a rapid expansion is observed along the south of Yagain Co, and a new lake formed in the southwest. Overall, the north side of the lake extended about 23.71 km by 2020, followed by 5.91 and 5.08 km on the west and east side respectively, while the south side extended 3.91 km.

    However, the boundaries of the nearby Bankog Co and the Co Ngoin kept roughly stable since 1988. The largest expansion of Bankog Co was observed in 2006, mainly in the east. After 2006, there was no further expansion. Co Ngoin is very stable lasting 30 years, but it is noteworthy that a connecting channel appeared in the central west in 2020, where the lake enclosed the central uplands forming a closed loop.

    Using the CSR, JPL and GSFC products of GRACE, the TWS time series of Siling Co region between April 2002 and December 2020 was obtained, as shown in Figure 3a. Both JPL and GSFC show an overall increasing trend in TWS, estimated as 0.50 ± 0.04 and 0.23 ± 0.06 cm/yr respectively, while CSR shows a slight negative trend of -0.08 ± 0.04 cm/yr. However, all three demonstrate a state of the steady increase until 2015, and then an extreme low TWS between 2015 and 2016, followed by a rapid rebound. There is also a clear seasonal pattern in TWS for all three, which coincides with precipitation processes (Lei et al., 2017). Among which, GSFC has the largest amplitude, and JPL the smallest. To analyse the possible signals in GRACE influencing the TWS changes, the soil moisture data from the GLDAS/Noah land surface model is used. Due to the warm climate and the relatively shallow topography, snow is not common in the study region and therefore the snow component in the water storage is not considered. While the TWS results from JPL and GSFC show an increasing trend in Siling Co region, the soil moisture shows a slightly decreasing trend (Figure S3). This suggests that the changes in TWS are not caused by the soil moisture, but more likely by surface water and groundwater. Combined with the fact that the Siling Co is expanding, the TWS does be related to the changes in the lake area.

    Figure  3.  (a) Comparison of monthly terrestrial water storage changes in the Siling Co region from CSR, JPL and GSFC. Dashed lines show the trends with P-value < 0.05. (b) Scatterplot of the Siling Co area and the corresponding year-month terrestrial water storage from CSR, JPL and GSFC, the green dots and dashed line represent the outliers of GSFC and the correlation before the outliers are removed, respectively (no corresponding GRACE data available for years 2016 and 2017). (c) Variation of terrestrial water storage in Siling Co region from 1972 to 2020. The blue scatters represent GRACE observations from JPL, and the orange scatters represent the result of linear expression. R2 is coefficient of determination from 0 to 1, being used to quantify the strength of the relationship between lake area change and the TWS. P-value represents significance and is used to judge whether R2 is statistically significant, with a general standard of 0.05 or 0.01. If the P-value is less than the standard value, R2 is significant.

    The correlation between Siling Co area and the TWS from CSR, JPL and GSFC was further investigated, and the results are shown in Figure 3b. The correlation coefficients are all positive for the three. Nevertheless, there is no significant linear relationship between the lake area and the TWS of CSR (R2 = 0.08). From Figures 2b and 3a, the trends from JPL and GSFC are more consistent with the changes of lake area in the fourth stage, particularly as Siling Co shrank during 2015–2016 corresponding to the extreme low TWS. Moreover, the lake area then expanded during 2017–2020 beyond its pre-shrinkage size, which is also consistent with the TWS of JPL and GSFC rebounding and surpassing previous levels over this period. In contrast, CSR had a limited rebound. However, outliers are observed in the TWS of GSFC. After eliminating the outliers, the correlation of GSFC increases to 0.59. JPL performs the best among the three, with a larger R2 of 0.75. As the spatial resolution of JPL is relatively lower than that of GSFC shown in Section 4.4, the GSFC was also used for further spatial analysis.

    A simple relationship is derived with linear regression, using TWS from JPL and area time series between April 2002 and December 2020. Assuming the relationship is constant since 1972, the TWS time series before 2002 could be derived from the area time series, as shown in Figure 3c. It is clear that the temporal resolution of GRACE TWS is much better than that of area derived. From Figure 3c, TWS also experiences three stages, similar to that of lake area. Using the time series, the TWS increase rate of Siling Co region is estimated as 0.65 ± 0.04 cm/yr from 1972 to 2020.

    Siling Co is an endorheic lake, and the area change is mainly driven by direct precipitation, river recharge, melting permafrost and evaporation, in which river recharge includes glacial-meltwater runoff and precipitation runoff. Due to data limitations, and the fact that both glaciers and permafrost are temperature sensitive, the roles of precipitation and temperature in the lake expansion during 1988–2018 (the common year period for Landsat data and meteorological data in this study, basically corresponds to the second to fourth stages of Siling Co expansion) were primarily considered.

    As precipitation is one of the direct water supplies, its contribution to the variations of the lake was first examined by analysing the relationships between the interannual change of lake area and the contemporaneous precipitation during 1988–2018 (Figure 4). Actually, the precipitation is divided into two components: lake surface precipitation and land surface precipitation, in which land surface precipitation is influenced by the topography of the basin and sinks into the runoff, becoming a part of the river recharge of the lake. The lake-wide precipitation was obtained by averaging all grid cells within the lake mask, and similarly, the basin-wide precipitation was obtained by averaging all grid cells within the basin mask. From Figure 4a, the R2 of the linear regression for the area interannual change and lake-wide precipitation is 0.23, implying that 23% of the variation in Siling Co change area comes from the variation of the lake-wide precipitation. Moreover, it increases to 34% for the basin-wide precipitation (Figure 4b), illustrating the additional contribution from the land surface precipitation.

    Figure  4.  The relationships between the interannual change of Siling Co area and (a) the annual lake-wide precipitation, (b) the annual basin-wide precipitation during 1988–2018.

    Correlation analysis was also implemented between the lake area and the 5-year moving average annual temperature and precipitation to discuss the long-term impact of these factors (Figures 5a, 5b). The results found that the change in Siling Co area was significantly correlated with the change in both average annual temperature and annual precipitation, and the correlation coefficients are 0.94 and 0.83, respectively. This suggests that the expansion of Siling Co was influenced by the positive trends of temperature and precipitation during 1988–2018, while the effect of temperature was relatively greater. The neighbouring Bankog Co, which also experiences obvious changes in area, was used for comparison (Figures 5c, 5d). In contrast, the Bankog Co is relatively more influenced by precipitation, with a correlation coefficient 0.89 compared to 0.75 of the temperature. This may be related to the fact that the Bankog Co is not recharged by glacial meltwater. Unlike the direct input of precipitation, the specific process of temperature influence may be manifested in accelerating the melting of permafrost and glaciers upstream of runoff, which in turn increases the amount of water flowing into the lake. By comparing the growth rate of Siling Co with that of Bankog Co (Figure 2), the presence of glacial meltwater does enhance the expansion of Siling Co to some extent.

    Figure  5.  (a)–(b) The relationships between the Siling Co area and (a) the 5-year moving average annual temperature, (b) the 5-year moving average precipitation during 1988–2018; (c)–(d) the relationships between the Bankog Co area and (c) the 5-year moving average annual temperature, (d) the 5-year moving average precipitation during 1988–2018. r is the correlation coefficient, which is used to indicate the degree and direction of linear correlation between variables.

    The roles of precipitation and temperature by stages were further investigated. The detailed evolutions of annual precipitation and average annual temperature in the Siling Co basin between 1988 and 2018 are shown in Figure 6, with overall positive trends 4.06 ± 1.55 mm/yr and 0.045 ± 0.01 ℃/yr, respectively. For the stage 1988–1997, the former fluctuated with an average of 325.2 mm, which is similar to the lake area variation shown in Figure 2a. However, the latter increased steadily with an average of -2.09 ℃. According to the correlation analysis in Table 2, only weak relationships were found between the lake area and the two contributors during this period.

    Figure  6.  Changes in (a) annual precipitation and (b) average annual temperature in the Siling Co Basin from 1988 to 2018. The black dashed line shows the trend for the whole period, while the blue, red and purple dashed lines show the trend for the periods 1988–1997, 1998–2005 and 2006–2018 respectively.
    Table  2.  The correlation coefficients of precipitation and temperature with Siling Co area in three periods
    Period Area vs. precipitation Area vs. temperature
    1988–1997 -0.16 -0.1
    1998–2005 0.67* 0.24
    2006–2018 -0.15 -0.52*
    *Statistical significance at the 0.1 level.
     | Show Table
    DownLoad: CSV

    In the stage 1998–2005, a quick increase in annual precipitation was observed, with an average of 433.2 mm, which is also consistent with the lake rapid expansion. Meanwhile, the temperature continued to rise steadily, reaching an average of -1.5 ℃. The positive correlations were found between the lake area and the two contributors, but only the former was significant (r = 0.67, P < 0.1). This indicates that the increase in precipitation is the main factor contributing to the dramatic expansion of Siling Co during 1998–2005.

    However, both temperature and precipitation showed a decreasing trend in the final stage 2006–2018, and the lake expansion has slowed obviously. At this stage, the correlation between lake area and precipitation is weak, while the temperature showed a significant negative correlation (r = -0.52, P < 0.1). This may partly explain the slower growth of Siling Co, as the former has not continued to increase, and the apparently decreasing trend in the latter may have limited further melting of the glaciers. Nevertheless, the average precipitation and temperature in this stage have greatly increased (specifically 93.9 mm and 0.95 ℃) compared to the period 1988–1997, which may also explain the fact that the lake is still growing at about twice the rate of the first stage. In addition, the minimum precipitation in 2015 led to the lake shrinkage in 2016, which was connected with the 2015/2016 El Niño event (Lei et al., 2019). This futher suggests that precipitation does still play an important role in the inter-annual variation of the lake area. In general, all these changes seem to correspond to the three stages of the variation of Siling Co area.

    Evaporation may be the other contributing factor to the expansion stages, shown in (Guo et al., 2019). During the period 1961–2015, the mean annual evaporation of Siling Co varied from 826.8 to 1 349.2 mm, and the temporal variations can be divided into several periods. In which, -10.2 and 4.3 mm/yr were reported during the two periods 1985–2006 and 2007–2015, which is also consistent with the area staged changes. Thus, changes in evaporation before 2006 accelerated the expansion of Siling Co, while the subsequent changes gradually inhibited the expansion. To summarize, the sudden increase of precipitation and the steady rise of temperature accompanied by a drop in evaporation during 1998–2005 led to the rapid growth of Siling Co, and the slowdown in the growth rate of the Siling Co after 2006 may also be attributed to the smaller rise in the annual precipitation and average annual temperature and the rise in evaporation.

    TWS provided by GRACE can provide the spatial variation of water. As discussed in Section 3.2, JPL and GSFC are more in line with the trend of Siling Co area change. Hence, the spatial change of TWS from JPL and GSFC was used and analysed to infer the water change source of Siling Co during the fourth expansion stage.

    The long-term trends distribution of TWS between April 2002 and December 2020 was presented to investigate the spatial mass changes within the Siling Co Basin (Figures 7a, 7b). The result from JPL is generally consistent with the GSFC, they all capture a positive trend in the Siling Co region, and a negative trend in the southern. There is only a small difference in the northeastern, with JPL showing a slight negative trend and GSFC showing a slight positive or no significant trend. The spatial variation of the TWS trends may be explained by the topography shown in Figure 1. The Siling Co is located as a centre of river convergence, while the northeastern and the southern are alpine regions. The meltwater could be transported by rivers from the high mountains to the lake, such as the Geladandong glacier in the northeast shrank by about 1.7% between 1969 and 2000 due to the increased temperature (Lu et al., 2002). In addition, land surface precipitation is also an important source of mass as discussed earlier (Figure 4), it is related to the supply of runoff in the basin. As a result, the increased TWS is likely to come from the decreased water volume in the northeastern and southern basin, which pooled in Siling Co region after melting or evaporation, either by runoff or direct precipitation.

    Figure  7.  (a)–(b) Long-term trends of terrestrial water storage based on (a) JPL and (b) GSFC in Siling Co Basin from April 2002 to December 2020; (c)–(d) The distribution of (c) average annual temperature and (d) average annual precipitation in Siling Co basin between 2002 and 2018.

    The overall mass changes between April 2002 and December 2020 in three major regions of Siling Co Basin were roughly calculated based on GRACE (Figure S4). The three regions are divided according to the topographic differences and the original resolution of GRACE (Figure S5). In Siling Co region, JPL shows a mass increase of about 2.289 Gt, compared to 0.838 Gt from GSFC. In southern part, both products show a significant mass decrease, with JPL -3.78 Gt and GSFC -3.902 Gt, respectively. While JPL shows a slight negative trend in the northeastern part throughout the study period (Figure 7a), there was actually an increase in mass of 0.069 Gt in December 2020 compared to April 2002, suggesting that estimates of long-term trends may be sensitive to the time window chosen because of the large amplitude changes in GRACE (Figure S4). Nevertheless, GSFC similarly showed a slight increase of 0.104 Gt in the northeastern part. Overall, the two products show relatively consistent mass changes in the three regions.

    Lake expansion is influenced by a number of factors, one of which is the increased recharge of glacial meltwater. However, the northeastern region of Siling Co Basin, which is the main supplier of glacial meltwater, has not actually decreased in mass during 2002–2020, while the southern region lost mass more. From Figures 7c, 7d, the difference in mass changes between the northeastern and southern regions may be explained by the northeastern region receiving more precipitation and is colder, making it accumulate mass more readily than the southern region. But there is also the question of whether the inverse correlation between lake expansion and glacier retreat really means that the source of lake water is primarily glacial meltwater? A quantitative study of the effect of glacier melting on lake volume change in the Siling Co Basin showed that the contribution of glacier mass changes to lake level rise is only 5.52% at the beginning of the 21st century (Liu et al., 2019). On the other hand, the stronger relationships between the rate of lake level rise and the supply coefficient (defined as the ratio of the basin area to the lake area) among 105 closed lakes in the TP found by Song et al. (2014), suggest that precipitation runoff within the basin has a significant influence on lake dynamics. Similar to Siling Co, Nam Co is also a glacial meltwater recharge lake and Zhu et al. (2010) calculated its water balance. The results show that the total contribution of precipitation in the period 1971–1991 and 1992–2004 was 63% and 61.91% respectively, indicating that precipitation has been dominating the recharge of the Nam Co. As Siling Co has a larger supply coefficient of 18.9 (Liu et al., 2022) and the corresponding 5.36 of Nam Co (Song et al., 2014), implying the impact of precipitation in the Siling Co Basin is greater. Moreover, Zhou et al. (2015) showed that the cumulative contribution of precipitation and snow and glacier melts to discharge in Zaga Zangbo River (see Figure 1, the largest tributary of Siling Co) can reach about 97.3%, in which 74.5% come from precipitation, further supported that the precipitation is the main water source. As previously illustrated, the precipitation in the Siling Co Basin now is about 93.9 mm higher than that of 1988–1997, while warming has slowed, which has limited the contribution of glacial meltwater. Likewise, our results from GRACE also indicate that the Siling Co water may have been derived more from precipitation than from the glacial meltwater in the phase between 2002 and 2020.

    In this study, the lake areas and TWS of Siling Co were derived from Landsat and GRACE and the cause of Siling Co expansion was analysed using meteorological data, and the water sources in the Siling Co were finally discussed from the GRACE perspective.

    During 1972–2020, the area of Siling Co has increased about 48% compared to its original size, from 1 647.30 to 2 438.99 km2. The TWS increases with the increasing area of Siling Co. The correlation R2 between TWS from JPL and area is about 0.75, outperforming CSR and GSFC. The TWS time series since 1972 was further derived, with the mass increase rate about 0.65 ± 0.04 cm/yr. The direction of Siling Co expansion generally follows the shoreline of the river, most notably on the north side, where it extended about 23.71 km by 2020. From the time series of lake area, the expansion process of Siling Co can be divided into four stages according to the growth rate. Meanwhile, the Co Ngoin and Bankog Co near Siling Co changed little from 1988 to 2020, in which Bankog Co showed an overall upward trend at a rate of 0.91 ± 0.25 km2/yr, but the trend was not steady. 1995–2005 is the fastest period of area increase of Bankog Co, which is consistent with Siling Co changes. However, the area of Co Ngoin showed no obvious trend in 30 years.

    Precipitation and temperature lead to the expansion of Siling Co, but vary with time span. Precipitation is an important direct water supply for lakes from 1979 to 2020, 23% of the variation in Siling Co change area comes from the variation of the lake-wide precipitation, and it increases to 34% for basin-wide. The dramatic increase in Siling Co area from 1998 to 2005 is the result of a rise in temperature and a sudden increase in precipitation combined with a fall in evaporation. The rate of expansion of the Siling Co begins to slow after 2006, which is due to the slow growth trend of temperature and non increase of precipitation and evaporation. Spatial analysis of TWS from GRACE suggests that area increase in Siling Co may come from the input of northeastern and southern regions. Furthermore, precipitation was found as the main contribution.

    The combination of Landsat and GRACE provides a new opportunity for the study of lakes, such as Siling Co. Accompanied with meteorological data, this study better the understanding of cryosphere change.

    ACKNOWLEDGMENTS: This study is supported by the National Natural Science Foundation of China (No. 42076234). We also thank the anonymous reviewers and editor Ge Yao for contructive comments, which considerably improve the final manuscript. The final publication is available at Springer via https://doi.org/10.1007/s12583-022-1761-7.
  • Awange, J. L., Sharifi, M. A., Ogonda, G., et al., 2008. The Falling Lake Victoria Water Level: GRACE, TRIMM and CHAMP Satellite Analysis of the Lake Basin. Water Resources Management, 22(7): 775–796. https://doi.org/10.1007/s11269-007-9191-y
    Buma, W. G., Lee, S. I., Seo, J. Y., 2018. Recent Surface Water Extent of Lake Chad from Multispectral Sensors and GRACE. Sensors (Basel, Switzerland), 18(7): E2082. https://doi.org/10.3390/s18072082
    Dejiyangzong, Nimaji, Qiangbadunzhu, et al., 2018. Lake Area Variation of Selin Tso in 1975–2016 and Its Influential Factors. Plateau and Mountain Meteorology Research, 38(2): 35–41, 96 (in Chinese with English Abstract)
    Du, J., Yang, T. B., He, Y., 2014. Glaciers and Lakes Changes and Climate Response in the Selin Co Basin from 1990 to 2011. Journal of Arid Land Resources and Environment, 28(12): 88–93 (in Chinese with English Abstract)
    Duo, B., Baciren, B., Ba, L., et al., 2010. The Response of Water Level of Selin Co to Climate Change during 1975–2008. Acta Geographica Sinica, 65(3): 313–319 (in Chinese with English Abstract)
    Fang, Y., Cheng, W. M., Zhang, Y. C., et al., 2016. Changes in Inland Lakes on the Tibetan Plateau over the Past 40 Years. Journal of Geographical Sciences, 26(4): 415–438. https://doi.org/10.1007/s11442-016-1277-0
    Feng, L., Hu, C. M., Chen, X. L., et al., 2012. Assessment of Inundation Changes of Poyang Lake Using MODIS Observations between 2000 and 2010. Remote Sensing of Environment, 121: 80–92. https://doi.org/10.1016/j.rse.2012.01.014
    Gardner, A. S., Moholdt, G., Cogley, J. G., et al., 2013. A Reconciled Estimate of Glacier Contributions to Sea Level Rise: 2003 to 2009. Science, 340(6134): 852–857. https://doi.org/10.1126/science.1234532
    Gong, P., 2012. Remote Sensing of Environmental Change over China: A Review. Chinese Science Bulletin, 57(22): 2793–2801. https://doi.org/10.1007/s11434-012-5268-y
    Guo, Y. H., Zhang, Y. S., Ma, N., et al., 2019. Long-Term Changes in Evaporation over Siling Co Lake on the Tibetan Plateau and Its Impact on Recent Rapid Lake Expansion. Atmospheric Research, 216: 141–150. https://doi.org/10.1016/j.atmosres.2018.10.006
    Han, Q. X., 2005. A Study on Information Extraction of Water Body with the Modified Normalized Difference Water Index (MNDWI). Journal of Remote Sensing, 9(5): 589–595 (in Chinese with English Abstract)
    He, J., Yang, K., Tang, W., et al., 2020. The First High-Resolution Meteorological Forcing Dataset for Land Process Studies over China. Scientific Data, 7(1): 25. https://doi.org/10.1038/s41597-020-0369-y
    Huang, C., Chen, Y., Zhang, S. Q., et al., 2018. Detecting, Extracting, and Monitoring Surface Water from Space Using Optical Sensors: A Review. Reviews of Geophysics, 56(2): 333–360. https://doi.org/10.1029/2018rg000598
    IPCC, 2014. Climate Change 2014-Impacts, Adaptation, and Vulnerability: Summary for Policymakers. Intergovernmental Panel on Climate Change. https://archive.ipcc.ch/pdf/assessment-report/ar5/wg2/WGIIAR5-FrontMatterA_FINAL.pdf
    Jacob, T., Wahr, J., Pfeffer, W. T., et al., 2012. Recent Contributions of Glaciers and Ice Caps to Sea Level Rise. Nature, 482(7386): 514–518. https://doi.org/10.1038/nature10847
    Ji, L., Zhang, L., Wylie, B., 2009. Analysis of Dynamic Thresholds for the Normalized Difference Water Index. Photogrammetric Engineering & Remote Sensing, 75(11): 1307–1317. https://doi.org/10.14358/pers.75.11.1307
    Jiao, J. J., Zhang, X. T., Liu, Y., et al., 2015. Increased Water Storage in the Qaidam Basin, the North Tibet Plateau from GRACE Gravity Data. PLoS One, 10(10): e0141442. https://doi.org/10.1371/journal.pone.0141442
    Jin, S. M., Sader, S. A., 2005. Comparison of Time Series Tasseled Cap Wetness and the Normalized Difference Moisture Index in Detecting Forest Disturbances. Remote Sensing of Environment, 94(3): 364–372. https://doi.org/10.1016/j.rse.2004.10.012
    Kang, S. C., Xu, Y. W., You, Q. L., et al., 2010. Review of Climate and Cryospheric Change in the Tibetan Plateau. Environmental Research Letters, 5(1): 015101. https://doi.org/10.1088/1748-9326/5/1/015101
    Lei, Y. B., Yang, K., Wang, B., et al., 2014. Response of Inland Lake Dynamics over the Tibetan Plateau to Climate Change. Climatic Change, 125(2): 281–290. https://doi.org/10.1007/s10584-014-1175-3
    Lei, Y. B., Yao, T. D., Bird, B. W., et al., 2013. Coherent Lake Growth on the Central Tibetan Plateau since the 1970s: Characterization and Attribution. Journal of Hydrology, 483: 61–67. https://doi.org/10.1016/j.jhydrol.2013.01.003
    Lei, Y. B., Yao, T. D., Yang, K., et al., 2017. Lake Seasonality across the Tibetan Plateau and Their Varying Relationship with Regional Mass Changes and Local Hydrology. Geophysical Research Letters, 44(2): 892–900. https://doi.org/10.1002/2016gl072062
    Lei, Y. B., Zhu, Y. L., Wang, B., et al., 2019. Extreme Lake Level Changes on the Tibetan Plateau Associated with the 2015/2016 El Niño. Geophysical Research Letters, 46(11): 5889–5898. https://doi.org/10. 1029/2019gl081946 doi: 10.1029/2019gl081946
    Li, W. B., Du, Z. Q., Ling, F., et al., 2013. A Comparison of Land Surface Water Mapping Using the Normalized Difference Water Index from TM, ETM+ and ALI. Remote Sensing, 5(11): 5530–5549. https://doi.org/10.3390/rs5115530
    Liu, H. C., He, G. J., Peng, Y., et al., 2021. Dynamic Monitoring of Surface Water in the Tibetan Plateau from 1980s to 2019 Based on Satellite Remote Sensing Images. Journal of Mountain Science, 18(11): 2833–2841. https://doi.org/10.1007/s11629-020-6482-8
    Liu, J. S., Wang, S. Y., Yu, S. M., et al., 2009. Climate Warming and Growth of High-Elevation Inland Lakes on the Tibetan Plateau. Global and Planetary Change, 67(3/4): 209–217. https://doi.org/10.1016/j.gloplacha.2009.03.010
    Liu, L., Jiang, L. M., Xiang, L. W., et al., 2019. The Effect of Glacier Melting on Lake Volume Change in the Siling Co Basin (5Z2), Tibetan Plateau. Chinese Journal of Geophysics, 62(5): 1603–1612 (in Chinese with English Abstract)
    Liu, W. H., Liu, H. R., Xie, C. W., et al., 2022. Dynamic Changes in Lakes and Potential Drivers within the Selin Co Basin, Tibetan Plateau. Environmental Earth Sciences, 81(3): 1–17. https://doi.org/10.1007/s12665-021-10155-1
    Loomis, B. D., Luthcke, S. B., Sabaka, T. J., 2019. Regularization and Error Characterization of GRACE Mascons. Journal of Geodesy, 93(9): 1381–1398. https://doi.org/10.1007/s00190-019-01252-y
    Lu, A. -X., Yao, T. -D., Liu, S. -Y., et al., 2002. Glacier Change in the Geladandong Area of the Tibetan Plateau Monitored by Remote Sensing. Journal of Glaciology Geocryology, 24(5): 559–562 (in Chinese with English Abstract)
    Ma, N., Szilagyi, J., Niu, G. Y., et al., 2016. Evaporation Variability of Nam Co Lake in the Tibetan Plateau and Its Role in Recent Rapid Lake Expansion. Journal of Hydrology, 537: 27–35. https://doi.org/10.1016/j.jhydrol.2016.03.030
    Ma, N., Szilagyi, J., Zhang, Y. S., et al., 2019. Complementary-Relationship-Based Modeling of Terrestrial Evapotranspiration across China during 1982–2012: Validations and Spatiotemporal Analyses. Journal of Geophysical Research: Atmospheres, 124(8): 4326–4351. https://doi.org/10.1029/2018jd029850
    Maussion, F., Scherer, D., Mölg, T., et al., 2014. Precipitation Seasonality and Variability over the Tibetan Plateau as Resolved by the High Asia Reanalysis. Journal of Climate, 27(5): 1910–1927. https://doi.org/10.1175/jcli-d-13-00282.1
    McFeeters, S. K., 1996. The Use of the Normalized Difference Water Index (NDWI) in the Delineation of Open Water Features. International Journal of Remote Sensing, 17(7): 1425–1432. https://doi.org/10.1080/01431169608948714
    Meng, K., Shi, X. H., Wang, E., et al., 2012. High-Altitude Salt Lake Elevation Changes and Glacial Ablation in Central Tibet, 2000–2010. Chinese Science Bulletin, 57(5): 525–534. https://doi.org/10.1007/s1 1434-011-4849-5 doi: 10.1007/s11434-011-4849-5
    Mitkari, K. V., Arora, M. K., Tiwari, R. K., 2017. Extraction of Glacial Lakes in Gangotri Glacier Using Object-Based Image Analysis. IEEE Journal of Selected Topics in Applied Earth Observations and Remote Sensing, 10(12): 5275–5283. https://doi.org/10.1109/jstars.2017.2727506
    Qiao, B. J., Zhu, L. P., Yang, R. M., 2019. Temporal-Spatial Differences in Lake Water Storage Changes and Their Links to Climate Change Throughout the Tibetan Plateau. Remote Sensing of Environment, 222: 232–243. https://doi.org/10.1016/j.rse.2018.12.037
    Qin, D. H., Ding, Y. J., Xiao, C. D., et al., 2018. Cryospheric Science: Research Framework and Disciplinary System. National Science Review, 5(2): 255–268. https://doi.org/10.1093/nsr/nwx108
    Raj, B. K. G., Kumar, V. K., Remya, S., 2013. Remote Sensing-Based Inventory of Glacial Lakes in Sikkim Himalaya: Semi-Automated Approach Using Satellite Data. Geomatics, Natural Hazards and Risk, 4(3): 241–253. https://doi.org/10.1080/19475705.2012.707153
    Rokni, K., Ahmad, A., Selamat, A., et al., 2014. Water Feature Extraction and Change Detection Using Multitemporal Landsat Imagery. Remote Sensing, 6(5): 4173–4189. https://doi.org/10.3390/rs6054173
    Save, H., Bettadpur, S., Tapley, B. D., 2016. High-Resolution CSR GRACE RL05 Mascons. Journal of Geophysical Research: Solid Earth, 121(10): 7547–7569. https://doi.org/10.1002/2016jb013007
    Singh, A., Seitz, F., Schwatke, C., 2012. Inter-Annual Water Storage Changes in the Aral Sea from Multi-Mission Satellite Altimetry, Optical Remote Sensing, and GRACE Satellite Gravimetry. Remote Sensing of Environment, 123: 187–195. https://doi.org/10.1016/j.rse.2012.01.001
    Song, C. Q., Huang, B., Ke, L. H., 2013. Modeling and Analysis of Lake Water Storage Changes on the Tibetan Plateau Using Multi-Mission Satellite Data. Remote Sensing of Environment, 135: 25–35. https://doi.org/10.1016/j.rse.2013.03.013
    Song, C. Q., Huang, B., Richards, K., et al., 2014. Accelerated Lake Expansion on the Tibetan Plateau in the 2000s: Induced by Glacial Melting or other Processes? Water Resources Research, 50(4): 3170–3186. https://doi.org/10.1002/2013wr014724
    Song, C. Q., Ke, L. H., Huang, B., et al., 2015. Can Mountain Glacier Melting Explains the GRACE-Observed Mass Loss in the Southeast Tibetan Plateau: From a Climate Perspective? Global and Planetary Change, 124: 1–9. https://doi.org/10.1016/j.gloplacha.2014.11.001
    Sun, F. D., Ma, R. H., He, B., et al., 2020. Changing Patterns of Lakes on the Southern Tibetan Plateau Based on Multi-Source Satellite Data. Remote Sensing, 12(20): 3450. https://doi.org/10.3390/rs12203450
    Wang, B., Bao, Q., Hoskins, B., et al., 2008. Tibetan Plateau Warming and Precipitation Changes in East Asia. Geophysical Research Letters, 35(14): L14702. https://doi.org/10.1029/2008gl034330
    Wang, K., Zhang, Y., Zhang, T., 2020. Analysis of Climate Change in the Selin Co Basin, Tibetan Plateau, from 1979 to 2017. Arid Zone Research, 37(3): 652–662 (in Chinese with English Abstract)
    Wang, L. S., Chen, C., Thomas, M., et al., 2018. Increased Water Storage of Lake Qinghai during 2004–2012 from GRACE Data, Hydrological Models, Radar Altimetry and in situ Measurements. Geophysical Journal International, 212(1): 679–693. https://doi.org/10.1093/gji/ggx443
    Wang, Q. Y., Yi, S., Sun, W. K., 2016. The Changing Pattern of Lake and Its Contribution to Increased Mass in the Tibetan Plateau Derived from GRACE and ICESat Data. Geophysical Journal International, 207(1): 528–541. https://doi.org/10.1093/gji/ggw293
    Wang, S. J., Wei, Y. Q., 2022. Qinghai-Tibetan Plateau Greening and Human Well-being Improving: The Role of Ecological Policies. Sustainability, 14(3): 1652. https://doi.org/10.3390/su14031652
    Watkins, M. M., Wiese, D. N., Yuan, D. N., et al., 2015. Improved Methods for Observing Earth's Time Variable Mass Distribution with GRACE Using Spherical Cap Mascons. Journal of Geophysical Research: Solid Earth, 120(4): 2648–2671. https://doi.org/10.1002/2014jb011547
    Xue, B. L., Wang, L., Yang, K., et al., 2013. Modeling the Land Surface Water and Energy Cycles of a Mesoscale Watershed in the Central Tibetan Plateau during Summer with a Distributed Hydrological Model. Journal of Geophysical Research: Atmospheres, 118(16): 8857–8868. https://doi.org/10.1002/jgrd.50696
    Yang, K., He, J., 2019. China Meteorological Forcing Dataset (1979–2018), A Big Earth Data Platform for Three Poles, https://doi.org/10.11888/AtmosphericPhysics.tpe.249369.file
    Yang, R. H., Yu, X. Z., Li, Y. L., 2003. The Dynamic Analysis of Remote Sensing Information for Monitoring the Expansion of the Selincuo Lake in Tibet. Remote Sensing for Land & Resources, 15(2): 64–67 (in Chinese with English Abstract)
    Yang, Z., Du, J., Lin, Z., 2015. Extreme Air Temperature Changes in Selin Co Basin, Tibet (1961–2012). Acta Ecologica Sinica, 35: 613–621 (in Chinese with English Abstract)
    Yi, G., Zhang, T., 2015. Delayed Response of Lake Area Change to Climate Change in Siling Co Lake, Tibetan Plateau, from 2003 to 2013. Int. J. Environ. Res. Public Health, 12(11): 13886–13900. https://doi.org/10. 3390/ijerph121113886 doi: 10.3390/ijerph121113886
    Zhang, B., Wu, Y. H., Zhu, L. P., et al., 2011. Estimation and Trend Detection of Water Storage at Nam Co Lake, Central Tibetan Plateau. Journal of Hydrology, 405(1/2): 161–170. https://doi.org/10.1016/j.jh ydrol.2011.05.018 doi: 10.1016/j.jhydrol.2011.05.018
    Zhang, G. Q., Li, J. L., Zheng, G. X., 2017. Lake-Area Mapping in the Tibetan Plateau: An Evaluation of Data and Methods. International Journal of Remote Sensing, 38(3): 742–772. https://doi.org/10.1080/01431161.2016.1271478
    Zhang, G. Q., Luo, W., Chen, W. F., et al., 2019. A Robust but Variable Lake Expansion on the Tibetan Plateau. Science Bulletin, 64(18): 1306–1309. https://doi.org/10.1016/j.scib.2019.07.018
    Zhang, G. Q., Xie, H. J., Yao, T. D., et al., 2013. Water Balance Estimates of Ten Greatest Lakes in China Using ICESat and Landsat Data. Chinese Science Bulletin, 58(31): 3815–3829. https://doi.org/10.1007/s11434-013-5818-y
    Zhang, G., 2022. The Lakes Larger than 1 km2 in Tibetan Plateau (V3.0) (1970s–2021), National Tibetan Plateau Data Center, https://doi.org/10.11888/hydro.tpdc.270303
    Zhang, Y., Yao, T., Ma, Y., 2011. Climatic Changes Have Led to Significant Expansion of Endorheic Lakes in Xizang (Tibet) since 1995. Sciences in Cold and Arid Regions, 3(6): 463–467 (in Chinese with English Abstract)
    Zhao, Z. L., Zhang, Y., Hu, Z. Z., et al., 2021. Contrasting Evolution Patterns of Endorheic and Exorheic Lakes on the Central Tibetan Plateau and Climate Cause Analysis during 1988–2017. Water, 13(14): 1962. https://doi.org/10.3390/w13141962
    Zhou, J., Wang, L., Zhang, Y. S., et al., 2015. Exploring the Water Storage Changes in the Largest Lake (Selin Co) over the Tibetan Plateau during 2003–2012 from a Basin-Wide Hydrological Modeling. Water Resources Research, 51(10): 8060–8086. https://doi.org/10.1002/2014wr015846
    Zhou, Y., Jin, S. G., Tenzer, R., et al., 2016. Water Storage Variations in the Poyang Lake Basin Estimated from GRACE and Satellite Altimetry. Geodesy and Geodynamics, 7(2): 108–116. https://doi.org/10.1016/j.geog.2016.04.003
    Zhu, L. P., Xie, M. P., Wu, Y. H., 2010. Quantitative Analysis of Lake Area Variations and the Influence Factors from 1971 to 2004 in the Nam Co Basin of the Tibetan Plateau. Chinese Science Bulletin, 55(13): 1294–1303. https://doi.org/10.1007/s11434-010-0015-8
    Zou, F., Tenzer, R., Jin, S. G., 2019. Water Storage Variations in Tibet from GRACE, ICESat, and Hydrological Data. Remote Sensing, 11(9): 1103. https://doi.org/10.3390/rs11091103
  • Relative Articles

    [1]Kai Yi, Xianyong Cao. Recent vegetation shifts on the Tibetan Plateau exceed the range of variations seen over past millennia in pollen record[J]. Journal of Earth Science. doi: 10.1007/s12583-025-2029-9
    [2]Aiying Cheng, Junqing Yu, Yun Li, Haicheng Wei, Chunliang Gao, Lisha Zhang. Late Holocene Hydroclimatic Variations at Lake Hurleg, Northeastern Tibet Plateau[J]. Journal of Earth Science, 2025, 36(1): 161-172. doi: 10.1007/s12583-024-0077-1
    [3]Timothy M. Kusky, Jiannan Meng. Perspectives on the M 7.1 2025 Southern Tibetan Plateau (Xizang) Earthquake[J]. Journal of Earth Science. doi: 10.1007/s12583-025-0174-9
    [4]Shengru Yue, Lunche Wang, Qian Cao, Jia Sun. Assessment of future cotton production in the Tarim River Basin under climate model projections and water management[J]. Journal of Earth Science. doi: 10.1007/s12583-025-0213-6
    [5]Jibin Han, Jianping Wang, Hongkui Ma, Yongshou Li, Zhao An, Yong Xiao, Wenhua Han, Huaide Cheng, Haizhou Ma, Hongchen Jiang. Flow variation and circulation process of saline springs in the Nangqen Basin, Tibetan Plateau[J]. Journal of Earth Science. doi: 10.1007/s12583-024-0086-0
    [6]Juan Wu, Chang-Qing Ke, Yu Cai, Zheng Duan. Monitoring Multi-Temporal Changes of Lakes on the Tibetan Plateau Using Multi-Source Remote Sensing Data from 1992 to 2019: A Case Study of Lake Zhari Namco[J]. Journal of Earth Science, 2024, 35(5): 1679-1691. doi: 10.1007/s12583-022-1639-8
    [7]Limei Wang, Guowang Jin, Xin Xiong. Flood Duration Estimation Based on Multisensor, Multitemporal Remote Sensing: The Sardoba Reservoir Flood[J]. Journal of Earth Science, 2023, 34(3): 868-878. doi: 10.1007/s12583-022-1670-9
    [8]Xu Lin, Chang’an Li, Jing Liu-Zeng, Jovliet Marc, Haijin Liu, Lingling Li, Chengwei Hu, Xiaokang Chen, Jixin Chen. Detrital zircon U-Pb age analysis of Late Pliocene deposits from the lower Yangtze River, South China: Implications for sedimentary provenance and evolution of the Yangtze River[J]. Journal of Earth Science. doi: 10.1007/s12583-023-1961-9
    [9]Qi Yu, Xianyan Wang, Zhiyong Han, Xiaodong Miao, Huayu Lu. Diverse Climatic and Anthropogenic Impacts on Desertification in the Middle Reaches of Yarlung Zangbo River Catchment on the Tibetan Plateau[J]. Journal of Earth Science, 2023, 34(6): 1816-1826. doi: 10.1007/s12583-022-1658-5
    [10]Zhenghai Wang, Weilong Lin, Ruxin Ding. Quantitative Measurement of Bedding Orientation Using Remote Sensing Data: Yili Basin, Northwest China[J]. Journal of Earth Science, 2018, 29(3): 689-694. doi: 10.1007/s12583-017-0943-1
    [11]Jie Zhang, Qinglai Feng, Zhi Zhang. Tracing Escaping Structure in the Northern Indo-China Peninsula by Openness and Remote Sensing[J]. Journal of Earth Science, 2017, 28(1): 147-160. doi: 10.1007/s12583-017-0743-7
    [12]Ying Zhang, Jincui Wang, Jihong Jing, Jichao Sun. Response of Groundwater to Climate Change under Extreme Climate Conditions in North China Plain[J]. Journal of Earth Science, 2014, 25(3): 612-618. doi: 10.1007/s12583-014-0443-5
    [13]Shijin WANG, Jiankuo DU, Yuanqing HE. Spatial-temporal characteristics of a temperate-glacier's active-layer temperature and its responses to climate change: A case study of Baishui Glacier No. 1, southeastern Tibetan Plateau[J]. Journal of Earth Science, 2014, 25(4): 727-734. doi: 10.1007/s12583-014-0460-4
    [14]Cheng Zhong, Hui Li, Wei Xiang, Aijun Su, Xianfeng Huang. Comprehensive Study of Landslides through the Integration of Multi Remote Sensing Techniques: Framework and Latest Advances[J]. Journal of Earth Science, 2012, 23(2): 243-252. doi: 10.1007/s12583-012-0245-6
    [15]Mushtak T. Jabbar, Jingxuan Zhou. Assessment of Soil Salinity Risk on the Agricultural Area in Basrah Province, Iraq: Using Remote Sensing and GIS Techniques[J]. Journal of Earth Science, 2012, 23(6): 881-891. doi: 10.1007/s12583-012-0299-5
    [16]Hongbo Ling, Qingqing Zhang, Wei Shi, Hailiang Xu. Runoff Variation Law and Its Response to Climate Change in the Headstream Area of the Keriya River Basin, Xinjiang[J]. Journal of Earth Science, 2011, 22(6): 780-791. doi: 10.1007/s12583-011-0227-0
    [17]Aigang Lu, Shichang Kang, Zongxing Li, Wilfred H Theakstone. Altitude Effects of Climatic Variation on Tibetan Plateau and Its Vicinities[J]. Journal of Earth Science, 2010, 21(2): 189-198. doi: 10.1007/s12583-010-0017-0
    [18]Qinghua Ye, Tandong Yao, Feng Chen, Shichang Kang, Xueqin Zhang, Yi Wang. Response of Glacier and Lake Covariations to Climate Change in Mapam Yumco Basin on Tibetan Plateau during 1974-2003[J]. Journal of Earth Science, 2008, 19(2): 135-145.
    [19]Mushtak Talib Jabbar. Using Remote Sensing and GIS Techniques to Study Soil Degradation Processes in North Shaanxi Province, China[J]. Journal of Earth Science, 2003, 14(4): 356-362.
    [20]Jabbar Mushtak Talib, Guangdao Hu, Jianguo Chen. Study of Sand Dunes and Their Effect on Desertification of Cultivated Lands in Shaanxi Province, China Using Remote Sensing Techniques[J]. Journal of Earth Science, 2002, 12(3): 234-239.
  • Created with Highcharts 5.0.7Amount of accessChart context menuAbstract Views, HTML Views, PDF Downloads StatisticsAbstract ViewsHTML ViewsPDF Downloads2024-052024-062024-072024-082024-092024-102024-112024-122025-012025-022025-032025-04010203040
    Created with Highcharts 5.0.7Chart context menuAccess Class DistributionFULLTEXT: 35.5 %FULLTEXT: 35.5 %META: 35.5 %META: 35.5 %PDF: 29.0 %PDF: 29.0 %FULLTEXTMETAPDF
    Created with Highcharts 5.0.7Chart context menuAccess Area Distribution其他: 1.4 %其他: 1.4 %Brazil: 1.4 %Brazil: 1.4 %China: 25.7 %China: 25.7 %Honduras: 0.9 %Honduras: 0.9 %India: 7.0 %India: 7.0 %Norway: 0.9 %Norway: 0.9 %Other: 0.9 %Other: 0.9 %Reserved: 5.6 %Reserved: 5.6 %Russian Federation: 2.8 %Russian Federation: 2.8 %United Kingdom: 0.9 %United Kingdom: 0.9 %United States: 48.6 %United States: 48.6 %开封: 0.9 %开封: 0.9 %海得拉巴: 0.9 %海得拉巴: 0.9 %罗奥尔凯埃: 0.9 %罗奥尔凯埃: 0.9 %香港: 0.9 %香港: 0.9 %其他BrazilChinaHondurasIndiaNorwayOtherReservedRussian FederationUnited KingdomUnited States开封海得拉巴罗奥尔凯埃香港

Catalog

    通讯作者: 陈斌, bchen63@163.com
    • 1. 

      沈阳化工大学材料科学与工程学院 沈阳 110142

    1. 本站搜索
    2. 百度学术搜索
    3. 万方数据库搜索
    4. CNKI搜索

    Figures(7)  / Tables(2)

    Article Metrics

    Article views(75) PDF downloads(62) Cited by()
    Proportional views
    Related

    /

    DownLoad:  Full-Size Img  PowerPoint
    Return
    Return