
Citation: | F Bassam, Al Bassam. GIS Predictive Model for Producing Hydrothermal Gold Potential Map Using Weights of Evidence Approach in Gengma Region, Sanjiang District, China. Journal of Earth Science, 2003, 14(3): 283-292. |
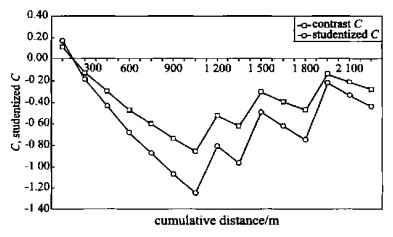
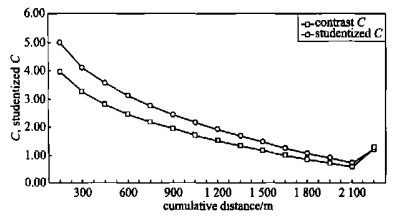
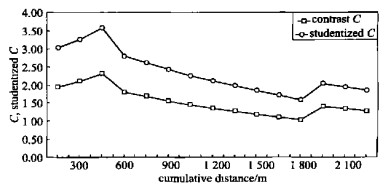
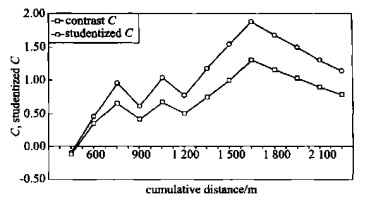
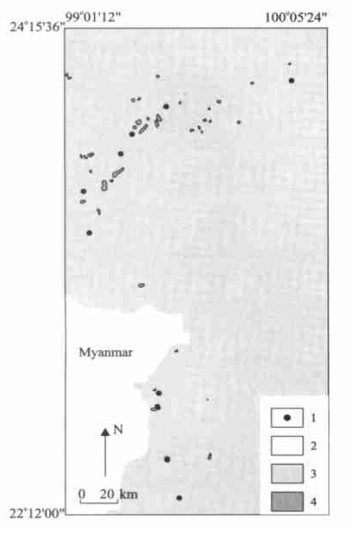
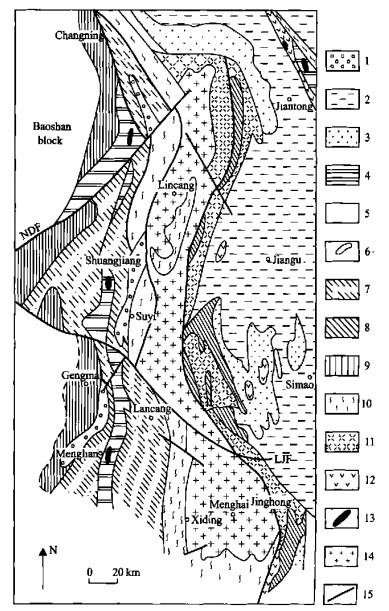
Gengma region, Sanjiang district is known to have some large-scale gold deposits. GIS predictive model for hydrothermal gold potential was carried out in this region using weights of evidence modeling technique. Datasets used include large-scale hydrothermal gold deposit records, geological, geophysical and remote sensing imagery. Based on the geological and mineral characteristics of areas with known gold occurrences in Sanjiang, several geological features were thought to be indicative of areas with potential for the occurrence of hydrothermal gold deposits. Indicative features were extracted from geoexploration datasets for use as input in the predictive model. The features include host rock lithology, geologic structures, wallrock alteration and associated (volcanic-plutonic) igneous rocks. To determine which of the indicative geological features are important spatial predictors of area with potential for gold deposits, spatial analysis was done through the modeling method. The input maps were buffered and the optimum distance of spatial association for each geological feature was determined by calculating the contrast and studentized contrast. Five feature maps were converted to binary predictor patterns and used as evidential layers for predictive modeling. The binary patterns were integrated in two combinations, each of which consists of four patterns in order to avoid over prediction due to the effect of duplicate features in the two structural evidences. The two produced potential maps define almost similar favorable zones. Areas of intersections between these zones in the two potential maps placed the highest predictive favorable zones in the region.
Sanjiang area (Nǜjiang-Lancang-Jinsha rivers) is one of the important metallogenic belts for nonferrous and noble metal deposits. The cumulative explored reserves of gold, silver and tin occupy an important position in their total explored reserves in China.
Economic gold deposits are becoming increasingly difficult to locate. Thus, new tools are required for archiving, managing, analyzing, integrating and visualizing the large volumes of geosciences data collected from variety of sources. Geographic information system (GIS) offers potential as a tool for accomplishing this task (Harris et al., 2001).
One of the major strength of GIS is the ability to integrate and combine multiple layers of geosciences data into predictive mineral potential maps showing areas favorable for mineral exploration (e.g. Raines, 1999; Wright and Bonham-Carter, 1996; Bonham-Carter, 1994; Rencz et al., 1994; Harris, 1989; Bonham-Carter et al., 1988; Chung and Agterberg, 1980).
Mineral source potential mapping is a complex analytical procedure, which requires simultaneous consideration of a number of spatial evidences such as geological, geomorphological, structural, geochemical, geophysical etc.. The capability of GIS to manipulate such classified spatial information through amalgamated layers makes it a unique tool for delineating potential locales (Mukhapadhyay et al., 2002).
Gengma region is located in the southern part of Sanjiang area (southwestern Yunnan Province) and bounded by (99°01'12"-100°05'24") E, (22°12'00"-24°15'36") N, longitude and latitude respectively.
The distribution of known hydrothermal gold occurrences was examined in term of spatial association with a series of evidence maps derived from the geological, geophy sical and remote sensing data. Analysis of these relationships, using GIS and weights of evidence modeling techniques, has predicted areas of high po tential deposits for further gold explorations.
Yunnan is situated in a compound position of Tethys-Himalayan and Marginal Pacific tectonic domain with com plex geological structures.The strata were fully developed containing abundant fossils and bio tas in different areas and the series were alternately grown in these strata with various sedimentary types and fully complicated environments.
Magmatic activities were intense showing polyphase and widespread features.The intrusive and ex trusive activities of various kinds of magma were extensive and strong which are seldom found elsewhere in China. Extensive metamorphism of different types obviously exhibited polycyclic character.Magmatism and metamorphism often constituted tectono-magmatic belts and metamorphic belts of different sizes and zones elong ated along regional structural lines displaying a complex structural framework and creating prerequisites for forming rich mineral resources.
Figure 1 show s the geological map of the study area and surrounding areas.
Sanjiang area is one of the most important nonferrous metal and precious metal metallogenic belts in China.The mineral resources were formed with formation and evolution of o rogenic zones and the landmasses and basins between them.
Volcanic activities have passed through various geological periods and developed frequently in each magmatic stage except the Caledonian stage.Nevertheless, they were most intense and very widespread during Tethyan evolution forming many ferrous, nonferrous and noble metal deposits. The Carboniferous, Permian, Triassic, Late Cretaceous and Cenozoic are major mineralization periods of nonferrous and precious metallic deposits associated with volcanic and subvolcanic rocks in the area (Mo et al., 1998).
Au deposits associated with volcanic and subvolcanic rocks are included in two series and three types in which the gold as accompanying (or coexisting) elements has been hosted in Cu-Mo or Pb-Zn ores. Single Au deposit has only been found in Ailaoshan tectono-magmatic zone.
Basic volcanic and ultramafic-mafic rocks are more favorable than sialic rocks for Au mineralization. The host rocks, such as tuffs, carbonates and intercalated carbonaceous mudstone with high permeability, strong adsorption and liability to replacement, are the most favorable sites for Au mineralization.
Magmatic activities in Variscan and Indosinian are more important and those in Lǜliang, Jining, Cheng jiang and Yanshan stages are closely related to regional mineralization. Intrusive rocks are widespread in the area in which basic and ultrabasic belts are mainly distributed in plate junctions and some deep faults associated with different ore deposits. In all tectonic movements, different sizes of intruded granite are accompanied by the ore forming process of tin, tungsten, rare metal, copper (molybdenum) and gold deposits.
About 70% of nonferrous and precious metallic deposits in the Sanjiang area have been considered to be associated with sedimentary stratabound mineralization, which are principally controlled by three factors of basin, facies and position and closely associated with the conditions of sources, transportation and reservoir. The host rocks are varying in geological age, excluding the Silurian, Pb, Zn and Ag bearing positions are well developed, Cu, Au, Ag and Sb mineralization have mostly been found in post Devonian strata.The mineralization age is generally younger than that of host rocks except for some deposits associated directly with volcanic rocks. The mineralization has been considered to be centered in the period of Late Paleozoic, Late Triassic, Late Cretaceous and Paleogene (Lin et al., 1993).
The host rocks in the region are mostly distributed in clastic and carbonates formations. The former is characterized by flysch, in which carbonaceous or volcanic lastic fissured rocks are favorable for mineralization, whereas, the bioclastic and reef limestone, dolomite and argillaceous limestone are more favorable.
Regional studies of mineral associations and wall rock alteration suggest that these deposits show polyphase and superimposed mineralization. Generally, these ore deposits exhibit three generations of mineralization; pyritization and silicification with minor mineralization are dominated in the early generation, which is superimposed by middle generation of major mineralization.The lower tem perature mineralization occurred in the late generation in which supergenesis often leads to concentration or depletion of beneficial compositions.
In Gengma, the hy drothermal gold deposits occur as disseminated deposits associated with pyrite, chalcopy rite, galena, stibnite, hematite and limonite hosted by Carboniferous, Permian, Triassic and Jurassic carbonate rocks which have been intruded by granitoid rocks and spatially associated with andesite and basalt volcanic and subvolcanic rocks. The mineralization is mainly controlled by major NE-SW trending faults. Close association of gold deposits with igneous rocks in the area indicates a magmatic component in mineralizing hydrothermal solution (GMEBYP, 1990).
Based on the geological and mineral characteristics of areas with known gold occurrences in Sanjiang, several geological features were thought to be indicative of areas with potential for the occurrence of hydrothermal gold deposits. The geological features are host rock lithology, geological, structures, wallrock alteration and associated (volcanic-plutonic) igneous rocks. However, certain general observations made by the earlier workers in the areas, which have similar conditions, are quite important.
High permeability and chemical reactivity provide favorable conditions for precipitation of mineralizing hydrothermal solution in host formation of Carlin-type gold deposits (Bagby and Berger, 1985). In Gengma area, the carbonates units represented by Sanhedong Formation T3, Guanling Formation T2, Dashuijinshan Formation T2, Hew angjia Formation T, Naqiang Formation P2, Damingshan Formation P1 and Yutanzhai Formation C, which occur along major fault zones, are suitable to host the hydrothermal gold deposits.
Wall rock alteration indicates the activity and intensity of mineralization processes. It is important for discerning the hydrothermal deposits. In the vicinity of gold deposits in the area, the pyritization, limonitization, silicification and sericitization following alteration processes can be disting uished (Liu, 2002). Mixture of hydrothermal argillic and iron oxides affects the spectral reflectance in satellite images. In Gengma area, the close proximity of gold deposits to zones of argillic shows higher favorability than zones of iron oxides which sometimes attributes to the effect of surface weathering in some formations.
Associated igneous rocks are really an extension of stratigraphic factor, but focus on geological constraints on the source of heat driving the hydrothermal system. Bagby and Berger (1985) pointed out that nearly all Carlin-type gold deposits in Nevada are spatially associated with intermediate to acidic igneous rocks that are either exposed at surface or concealed at shallow depth. In Gengma, there are Triassic and Cretaceous granite rocks and andesite-basalt of Upper Triassic, Middle Permian and Lower Cretaceous represented by Niuhetang, Shamu and Pingzhang formations respectively in close proximity of the most known gold deposits. Asadi and Hale (2001) attributed high amplitude aeromagnetic anom alies within Takab area to high magnetic susceptibility igneous rocks. This high magnetic signature is located almost in the central part of the study area near Niuhetang and Shamu outcrops and includes the surface gold prospects between them. These anomalies are attributed to the extension of intrusive igneous rocks beneath the surface gold deposits. Unfortunately, the aeromagnetic data are not being available uniformly over the study area, especially in the southern part of Gengma, which includes the rest of gold prospects.
Linear structures are also important in controlling the magmatism and may act as conduits for hydrothermal fluids and subsequent gold mineralization. Most of the gold deposits in the area occur within or close to major NE-SW trending lineaments interpreted from Landsat TM image and NE-SW and N-S trending faults, which have lengths more than 10 km.
Production of a predictive mineral potential map using GIS involves a number of steps. Firstly, data must be collected and compiled into a digital format acceptable for input to the GIS. Secondly, the data should be projected to the same coordinate system (i.e.selection of appropriate datum and map projection). GIS datasets comprise of the following layers.
(1) Exposed host rocks were digitized from the 1: 500 000 scale geological map of Yunnan Province as polygon coverage; the lithological units were added in the polygon attribute table using A RC/INFO softw are. These digitized information constituted one layer represents lithological or host rock evidence.
(2) Two Landsat TM images from path 131, row 43 to path 131, row 44 acquired on 19880302 and 19870326 were georeferenced using ground control points identified both on the image and on 1:25 000 scale topographic maps. No sun angle correction was conducted because the images were obtained at the same period of the year.The two images were mosaicked to create one image covering the area of Gengma and surrounding areas. The later image was saved as a new dataset and used to identify the hydrothermal alteration zones by using selected band ratio images and special principal component analysis. Strong alteration zones emphasizing on argillic hydrothermal alterations have been chosen to represent the hydrothermal alteration evidence.
(3) Exposed (volcanic-plutonic) igneous rocks in the area were digitized from 1:500 000 scale geological map of Yunnan Province and merged with the buried igneous rocks derived from the analytical signal of the total intensity magnetic field image with an added attributes to create the layer represent heat source evidence.
(4) (a) Major faults within the selected area were digitized from 1:500 000 scale geological map of Yunnan Province. Other major structures derived from the interpretation of gravity and magnetic field data carried out by a geophysical team from Geological and Mineral Exploration Bureau of Yunnan Province in 1:500 000 and 1:1 000 000 were resampled to the same pixel size and digitized. These two sets were merged in one layer representing the first structural evidence.(b) Improved interpretation on the same image created in step 2 using different spectral and spatial enhancement has been applied to delineate and digitize the major lineaments using digitizing module of ErMapper softw are. The result represents remote sensing structural evidence.
(5) The locations of the large-scale known hydrothermal gold occurrences were collected from the Geological and Mineral Exploration Bureau of Yunnan Province.
Mineral exploration companies increasingly use GIS technology to combine spatial data and make predictive mineral potential maps. Weights of evidence is a discrete multivariate method first applied to this problem (Bonham-Carter, 1998). It is based on the application of Bayes Rule (e. g. Bonham-Carter et al., 1988), the Bayesian approach to the problem of combining multiple predictor variables (datasets) uses probability framework. One of the concepts in this approach is the idea of prior and posterio r probability. Starting with prior probability of mineral deposits occurring in a unit area, a posterior probability is calculated based on the weights of evidence for the presence and absence of predictor v ariable.The weights of evidence for all predictor variables are combined to estim ate the conditional probability of mineral occurrence given in presence and absence of all the binary predicto rvariables.Combining the weights of evidence of the different binary predictor maps requires an assumption that the input maps are conditionally independent.
The Arc-WofEextension developed by US Geological Survey and Geological Survey of Canada with funding from five mining companies has been used in this study for weights of evidence analysis. This extension was made available to public in May 1999. It can be dow nloaded from Arc-WofEhomepage (gis.nrcan.gc.ca/software/arcview/wofe). The Arc-WofEex tension requires Arcview spatial analyst as well as Arcview GIS.
A pixel size 100 m ×100 m is used in rasterizing the mineral occurrence point map and the input binary evidence maps, derived from geological, geophy sical and remote sensing data, for the creation and calculation of weights of binary predictor maps. This size is chosen to ensure that only one mineral occurrence is present in any given pixel. The spatial association of each evidence map is assessed with respect to the location of known gold occurrences. A pair of weights (W+, W-) are determined from the deg ree of overlap between the known gold deposits and the binary evidence map. For the rasterized maps representing host rocks features, hydrothermal alteration features, and heat sources rocks linear structures faults/lineaments features, the optimum distance within which the spatial association of these features with the known hydro thermal gold occurrences is optimal was determined by calculating the weights (W+, W-) and contrast C for successive distances away from the geological features and examining variations in C or in studentized C. Different buffer zone intervals were experimented in order to determine the optimum buffer intervals.
Each lithologic unit present on 1:500 000 geological map of the area is evaluated with respect to known gold prospects using Arc-WofE. Units that showed a positive association were selected from the map in addition to the lithologies, thought to be prospective for gold based on the ex plo ration criteria.These units were reclassified into binary of favorable lithologies by assigning a score of 1 (i.e. presence) to these formations and 0 (i.e. absence) to the other units.
Distance map showing relative distances by dilating (buffering) around these formations in successive zones at distances of 150 to 2 250 m with increment of 150 m was generated. Because the distance map has multiple classes, the optimal spatial association between the known gold occurrences and favorable host rocks should be calculated to define the potentially favorable lithologies that may have been covered by unfavorable lithologies. The hig hest C usually indicates the optimum cutoff distance at which the predictive power of the binary pattern is maximized (Bonham-Carter et al., 1988). However, in cases where there are only a sm all number of occurrence points or small area, the uncertainty of weights could be large so that C is meaningless. In this study, the studentized C was useful for choosing the cutoff distances because it serves as a measure of the certainty and uncertainty of the contrast. The variation in the contrast for cumulative distances from the outline of host lithologies with respect to the known gold prospects is given in Fig. 2. For all successive cumulative distances away from the outline of host lithology, C is negative, nonetheless, both C and studentized C are the highest for 1 950 m where 6 of 10 gold occurrences are presented in the favorable pattern, and the other occurrences are probably spatially correlated with other geological features.
Two image-processing techniques have been applied for the mapping of hydrothermal alteration zones, these techniques are : (1) Two selected band ratios that take the spectral behaviors of argillic and iron oxides have been chosen for the delineation of hy drothermal alteration zones, and these ratios are bands 5/7 and 3/1 respectively. Strong alteration zones have been mapped for the two types by applying low pass (averaging) filter to the resulted ratio images and defining suitable threshold level to extract the high values. (2) A special image processing technique (ERMAPPER, 1995. Application Manual), which provides a robust way to alteration zones for mineral exploration using Landsat Thematic Mapper (TM), was used in this study. This technique is based on the use of principal component analysis (PCA) and sometimes is called Crosta technique (Crosta and Moore, 1989). Low pass filter has been applied to the resulted RGB layers to smooth noise in high order PCs.By creating a threshold formula, strong argillic and iron oxides alteration zones have been separated according to their DN values.
Digital data was processed using ErM apper version 5.5 softw are, and the vectors were drawn using different algorithms for image interpretation. Finally, the results were combined using GIS-Arcview softw are.
Field observations and spatial analysis show that mainly argillic hydrothermal alteration zones are associated with many known gold prospects in the area and usually located in the vicinity of heat igneous sources and controlled by linear structures.
In the synthesization of the final alteration zones, which are related to the mineralizing process, Arc-WofE has been used to evaluate these zones with respect to known gold prospects. Zones that have positive association (mainly argillic) were selected as a second binary predictor input map for weight of evidence analysis.
Figure 3 shows the variation in the contrast for cumulative distances from the hydrothermal alteration zones in the area. C and studentized C indicate that the optimum cutoff distance is 150 m. 8 of 10 gold occurrences are presented within this distance.
Two pieces of mappable evidence can be used to predict the heat sources driving the migration of mineralizing hydrothermal solutions : (1) Proximity to the surface exposures of Triassic and Cretaceous granite rocks and Upper Triassic, Middle Permian and Lower Cretaceous andesite-basalt rocks. (2) Proximity to interpret high magnetic susceptibility igneous rocks beneath the sediments.The former was digitized from 1: 500 000 geological map of the area in vector (polygon) format. High-resolution aeromagnetic data of the area were used to interpret the high susceptibility surface and subsurface igneous rocks. The procedure described by Paterson and Reeves (1985) was applied to perform analytical signal analysis of total magnetic intensity in order to identify anomalously high magnetic field associated with high magnetic susceptibility igneous rocks in the area using Geophysical Data Processing System (GDPS) software. These two pieces of mappable evidence were com bined in a binary raster map representing the heat sources factor. Distance map showing relative distances (buffer zones) away from the heat sources bodies at distances of 150 to 2 250 m was generated and weights of evidence, contrast C and studentized value of C were calculated (Fig. 4). Both C and studentized C indicate that the optimum cutoff distance is 450 m where seven of 10 gold occurrences are present within this distance.
Major faults (length greater than 10 km.) trending NE-SW and N-S and the major faults derived from the geophy sical interpretation (i.e. surface and subsurface faults) were digitized from different maps carried out by Geolog ical and Mineral Exploration Bureau of Yunnan Province.
Major NE-SW lineaments extracted from remote sensing data were performed using two spectral enhancement techniques on Landsat TM data namely principal component analysis (PCA) and IHS decorrelation stretching. PCA was applied to decrease both information redundancy and the number of layers. Two separate PCA were utilized, first by applying PCA on bands 1, 2 and 3 (the visible bands) of the image, then by applying another PCA on bands 5 and 7 (the middle-infrared bands). Since band 4 (near infrared) is less correlated to any of the other bands, it was lifted alone. The result data were displayed in RGB composite as follow : R. PC1 from the PCA of the three visible bands (1, 2, 3); G. Thematic Mapper band 4; B.PC1 from PCA of two mid-IR bands (5, 7).
IHS decorrelation stretching has been applied to the above RGB data. In IHS, coordinates saturation was stretched and directional edge enhancement filters were applied on the intensity layer.Digital data was processed on SUN 1000 micro-system workstation and the vectors were drawn using Er Mapper softw are.
The above two types have been used separately in weight of evidence analysis as a fourth input data representing the structural evidence. 150 m buffer zones were created around each structure line, out to maximum of 2 250 m to asses the spatial association with the known gold deposits.
Figures 5 and 6 show the variation in contrast for cumulative distances away from the NE-SW and N-S faults and major NE-SW lineaments in the area. A distance threshold (based on peaks in C and studentized C values) of 1 650 m was chosen for both the faults and lineament where 6 and 7 of occurrences are presented within this distance for the two types respectively.
Now five weighted binary maps (binary predictor patterns) were created (Fig. 7). These maps can be combined to produce the final predictive map for hydrothermal gold potential in Gengma region. Table 1 shows the weights, contrast and their standard deviations for each of the binary predictor pattern.
![]() |
Bayes' rule requires that all input maps should be conditionally independent of one another with respect to the mineral occurrences. If this rule is violated, the resultant predictive map will be biased and under- or overestimates the undiscovered mineral deposits. The following relationship is satisfied if two binary maps are conditionally independent.
|
The left-hand side of the equation is the observed number of occurrences in the overlap zone of B1 and B2. The right-hand side is the predicted number of deposits in this overlap zone. A contingency calculation table (Bonhan-carter, 1994) is used to test for conditional independence of two binary patterns, and the following equation was applied for chi-square test to all possible map pairs
|
Because the mineral occurrences are considered as points or single unit cell, the resulting values of X2 are unaffected by the units of area measurement. The calculated values can then be compared with standard values of X2 to verify if the conditional independence hy pothesis holds at 95% probability with one deg ree of freedom. The X2 values for each pair of binary predictor maps for all the four overlap conditions can be calculated using contingency table (Bonham-Carter, 1994). A sum of these four X2 values gives the total X2 value for each possible pair of the binary patterns.
Table 2 is the matrix of the X2 values for the pairs of binary predictor patterns. Values less than the critical X2 value of 3.841 at the 95% significance level with one degree of freedom indicate map pairs for which the null hypothesis of conditional independence is not rejected (Davis, 1973). All the binary predictor map pairs show that they are conditionally independent.
![]() |
After considering the weights and deciding on the appropriate breaks, Arc-WofE extension has been used to generalize the evidential themes (input binary maps). The generalization was implemented by symbolizing each evidential theme with new reclassification field.
The generalized evidential themes (binary predictor maps) have been combined for the prediction and calculation of response theme.For each evidential theme, the attribute field containing the desired generalization was selected. The com plete weights of evidence calculation create a response map symbolized by posterior probability values that was added to the view.
The binary patterns were integrated in two combinations, each consisting of four patterns in order to avoid over prediction due to the effect of duplicate features in the two structural evidences. Two hydrothermal gold potential maps show that almost the similar predictive zones (figures are not shown) have been created by summing the weights of evidence of four binary predictor patterns representing hydrothermal gold exploration criteria.The major faults were used as structural evidence in creating the first map, whereas, the major lineaments interpreted from remote sensing data were used as the same evidence in creating the second map. In these maps, the highest values of posterior probabilities represent the right overlap combination of binary maps where all favorable conditions are presented and the lowest values located where these conditions are scarce. Based on the values of posterior probabilities, the two predictive maps were meaningfully symbolized into four potential zones : low, moderate, high and very high to be easily interpreted.
By outlining the concentrated high and very high potential zones in the created maps, another two maps of prospective mineralizing zones for hydrothermal gold deposits in the region were produced (figures are not shown). The areas of intersections between these zones in the two produced maps placed the highest predictive favorable zones in Gengma region (Fig. 8).
(1) This paper endeavored simply to illustrate WofE approach for predicting the hydrothermal gold potential map in rugged terrain and difficult access area such as Gengma.The processing techniques of ArcWofE extension within GIS-Arcview environment are particularly suited for building the database, modeling the spatial correlations between geological features and known gold occurrences, map calculations, and displaying the results that are required in the quantitative mapping of mineral potential.
(2) The predictive ex plo ration model has placed high prospective areas for hydrothermal gold occurrences, many of which are coincident with known gold prospects and are suggested as a highly prospective some other areas for further investigations.
(3) Contrast C and studentized C were used in selecting the optimum distances that have the best spatial association with known gold occurrences. Depending on these values, the best predictors for hy drothermal gold deposits in the area include strong (mainly argillic) hydrothermal alteration zones mapped in the field or interpreted from remote sensing data, specific surface and subsurface igneous heat sources rocks, NE-SW and N-S linear structures and specific geologic units.
(4) The results extracted from applying WofE approach in Gengma region and the way in which the weights have been calculated could be helpful in estimating the weights in another area with small number of gold occurrences, providing that the new area is characterized by the same geological and mineralogical environments.
(5) The spatial association of NE-SW major lineaments interpreted from remote sensing data with known gold occurrences revealed by WofE may result in a causal association that should be taken in consideration by the geologist especially when the structural and geophysical data are not available.
Asadi H H, Hale M, 2001. A Predictive GIS Model for Mapping Potential Gold and Base Metal Mineralization in Takab Area, Iran. Computer & Geosciences, 27: 901-912 |
Bagby W C, Berger B R, 1985. Geologic Characteristic of Sediment-Hosted, Disseminated Precious Metal Deposits in the Western United States. In: Berger B R, Bethke P M, eds. Geology and Geochemistry of Epithermal System. Society of Economic Geology, Reviews in Economic Geology, 2: 169-202 |
Bonham-Carter G F, Agterberg F P, Wright D F, 1988. Integration of Geological Datasets for Gold Exploration in Nova Scotia. Photogrammetric Engineering and Remote Sensing, 54 (11): 1585-1592 |
Bonham-Carter G F, 1994. Geographic Information Systems for Geoscientists. Modeling with GIS. New York: Pergamon. 398 |
Bonham-Carter G F, 1998. Geographic Information Systems for Earth Scientists. Modeling with GIS, 13: 398 |
Chung C F, Agterberg F P, 1980. Regression Models for Estimating Mineral Resources from Geological Map Data. Mathematical Geology, 12(5): 473-488 doi: 10.1007/BF01028881 |
Crosta A P, M oore J, 1989. Enhancement of Landsat Thematic M apper Imagery for Residual Soil Mapping in SW Minas Gerais State, Brazil: A Prospecting Case History in Greenstone Belt Terrain. Proceedings of the 7th (ERIM) Thematic Conference, Remote Sensing for Exploration Geology. 1173-1187 |
Davis J C, 1973. Statistics and Data Analysis in Geology. 2nd Edition. Singapore: John Wiley and Sons. 646 |
Ermapper, 1995. Applicalions Manual: 265-267 |
Geological and Mineral Exploration Bureau of Yunnan Province (GMEBYP), 1990. Regional Geology of Yunnan Province. Geological Memoirs, Series 1, No. 21. Beijing: Geological Publishing House. 727 (in Chinese) |
Harris J R, 1989. Data Integration for Gold Exploration in Eastern Nova Scotia Using GIS. Proceedings of Remote Sensing for Exploration Geology Calgary, Alberta: [sn] 233-249 |
Harris J, Wilkinson L, Heather K, et al, 2001. Application of GIS Processing Techniques for Producing Mineral Prospectivity Maps—A Case Study: Mesothermal Au in Swayze Greenstone Belt, Ontario, Canada. Natural Resources Research, 10(2): 91-123 doi: 10.1023/A:1011548709573 |
Lin Z Q, Li X Z, Ye Q T, 1993. Division of Tectono-Magmatic Zones and the Distribution of Deposits in the Sanjiang Area. Geological Memoris, Series 4, No. 34. Beijing: Geological Publishing House. 246 (in Chinese) |
Liu Y C, 2002. The Application of the TM Data to the Gold Deposits Prospecting. http://www.gisdevelopment.net/aars/acrs/1996/ts10/ts10005.shtml. Accessed in 4 September 2002 |
Mo X X, Shen S Y, Zhu Q W, 1998. Volcanic-Ophiolite and Mineralization of Middle-Southern Part in Sanjiang Area of Southwestern China. Beijing: Geological Publishing House. 128 (in Chinese) |
Mukhapadhyay B, Hazra N, Sengupta S R, et al, 2002. Mineral Potential Map by Know ledge Driven GIS Modeling: An Example from Singbhum Copper Belt, Jharkhand. http://www.gisdevelopment.net/application/geology/mineral/geom0007.htm. Accessed 10 May 2002 |
Paterson N R, Reeves C V, 1985. Applications of Gravity and Magnetic Surveys: The State-of-the-Art in 1985. Geophysics, 50(12): 2558-2594 |
Raines G L, 1999. Evaluation of Weight of Evidence to Predict Epithermal Gold Deposits in the Great Basin of Western United States. Natural Resources Research, 8(4): 257-276 doi: 10.1023/A:1021602316101 |
Rencz A N, Harris J R, Watson G P, et al, 1994. Data Integration for Mineral Exploration in Antigonish Highlands, Novia Scotia. Canadian Journal of Remote Sensing, 20(3): 258-267 |
Wright D F, Bonham-Carter G F, 1996. VHM S Favourability Mapping with GIS-Based Integration Models, Chisel LakeAnderson Lake Area. In: Bonham-Carter G F, Galley A G, Hall G E M, eds. EXTECHI: A Multidisciplinary Approach to Massive Sulphide Research in the Rusty LakeSnow Lake Greenstone Belt, Manitoba. Geol Survey Canada Bull, 426: 339-376, 387-401 |
Zhong Dalai 2000, Paleotethysides in West Yunnan and Sichuan, China. Beijing: Science Press. 248 |
![]() |
![]() |