
Citation: | Guocheng Li, Jingtao Wang. Model Tests of Pile Defect Detection. Journal of Earth Science, 2001, 12(4): 321-324. |
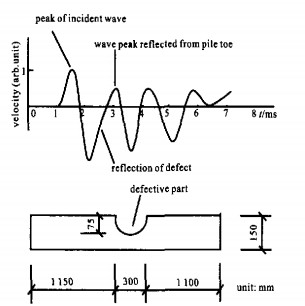
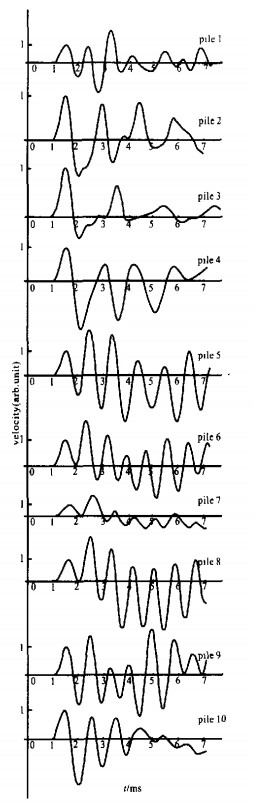
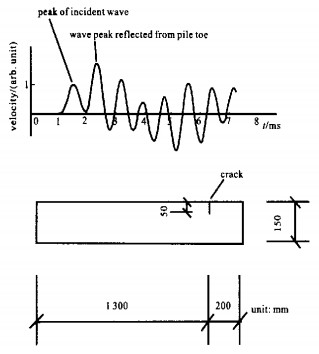
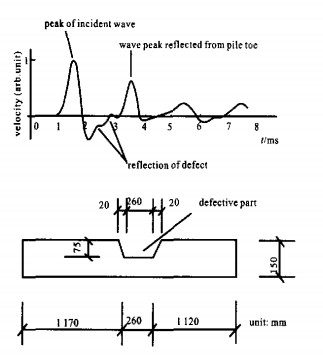
The pile, as an important foundation style, is being used in engineering practice. Defects of different types and damages of different degrees easily occur during the process of pile construction. So, dietecting defects of the pile is very important. As so far, there are some difficult problems in pile defect detection. Based on stress wave theory, some of these typical difficult problems were studied through model tests. The analyses of the test results are carried out and some significant results of the low-strain method are obtained, when a pile has a gradually-decreasing crosssection part, the amplitude of the reflective signal originating from the defect is dependent on the decreasing value of the rate of crosssection
When the soil beneath a footing or raft is too weak or too compressible to provide adequate support. the loads are 1ransferred to more suitable soil layers at a greater depth by means of piles. With the continuous dewelopment of the construction, the pile, one of the most important foundation styles, is widely applied. For various reasons, defects of different types and damages of different degrees easily occur during the process of construction.
In general, the defects in piles can be divided into 1wo kinds: one resulting from struclural variations such as cracking. breaking, variation in cross section and prcsence of cavities: the other resulting from variations of material properties such as concrete separation and low quality concrele. These defects will seriously reduce the pile bearing capacity. At present. there are still some limitations in low strain tests for pile integrity detection. l1 is difficult to detect such defects in piles as a gradual decrease in crosssection and cracks near the pile's top or toe. To study those difcult problems. some pile model tests have been performed and the interpretation of the test results is presented in this paper.
For the study of these difiult problems in pile defect detetion.10 model piles were constructed. Concrete for piles was made by mixing cement and water to form a cement paste binder that is mixed with materials such as sand and crushed stone (referred to as aggregates). The ratio of the concrete 10 all piles was1 : 2.13 : 3.25 : 0.57 (cement : sand : crusbed stone : water), except for the defective purts of ples, The re ments selected were ordinary silicate cerments. The diamelers of sands were smaller than 1. 3 mm. and those of crushed sione ranged between5 mm and 20 mm, Pile 1 was a hugh quality pile. Pile 2 had a 30 cm low qualiy concrete at its middlc. The ratio of defective parl was 1 : 2.89 : 4. 10: 0. 18. Pile 3 had an abruptly decreasing ersssection and pile 4 had a graduallydecreasing crosssection. In the lattcr two piles, the defects were 30 cm long with minimal crossection Area that is one half of the initial cross section area of the pile. as ilustrated ir Figs. 1 and 2. respectively.
For the investigation into how thc defects near the pule top or toe influence the stress wave responses at the pile top, pile 3 with a smal crack near its top was tnade. and the length between the crack and the pile top was 200 mm. Pile 6 with a small crack near its toe was constructed. and the length be 1ween the crack and the pile top was also 200 mm. Pile 7 with a loose top and pile 8 with a loose toc were both-made also with the loose parts of 200 mm long. Pile 9 with two cracks ncar its top and toe respectively was made. and the lengths between the cracks to the pile top or toe were 200 mm. respectively. The piles with an enlarged bottom are often used for engincering practice. Therefore. model pile 10 was used 10 simulate this kind of pile. as ilustrated in Fig. 5.
The lcngths of piles2. 3 and 4 were 2 550 mm. and those of others were 1 500 mm. respectively. Since the lengths of the model piles were short, just 1.5 m or 2. 550 m, the sampling frequency in low-strain tests was chosen as high as 100 kHz.All of the time velocity response curves measured for the 10 model piles are presented in Fig. 3.
The wave speeds in pile 6 and pile I were calculated from measured velocity traces at 3 571 m/s and 3 409 m/s, respectively. However, both pile 6 and pile | were made from the same batch of concrete, and at the same time they have the same geometrical size. Why is the wave speed in pile 6 higher than that in pile 1? It is hard to identify the defect from the waveform reflected from the toe of pile 6. There is a small crack near the toe in pile 6, as shown in Fig. 4. The wave reflected from this crack would be superposed on the wave reflected from the pile toe. The superposed peak extended forwardly to the point al which should arrive the peak o[ the rllective wave of the pile toe. Therefore, the time difference between two peaks of the incident and reflective waves in pile 6 would be smaller than that in pile 1. Thus, the wave speed in pile 6 was greater than that in pile 1.
Sirmilar cases that occurred in piles 5, 7, 8 and 10 could be interpreted from the analysis of pile 6 mentioned above. The influence of the enlarged bottom on pile 10 is opposite to that of the crack on pile 6. It is hard to identify the enlarged botom from the waveform reflected from the toe of pile 10. as shown in Fig. 5, The wave reflected from the cnlarged bottorn would be superposed on the wave reflected from the pile toe. The superposed peak extended backwardly lo the point al which should arrive the peak of the reflective wave of the pile toe. Therefore, the time difference between two peaks of the incident and rllctive waves in pile 10 would be greater than that inpile 1. Thus. the wave speed calculated from the velocity curve2 727 m/s in pile 10 is lower than3 409 m/s in pile 1.
However, the effect of a small crack near the pile top on the wave speed, such as pile 5, is dependent upon the relative position of the wave peak reflected from the crack to the peak of the incident wave. If the peak rfected lrom the crack extends forwardly to the peak of the incident wave, the formcr would be superposed on the ltter. The wave speed would be smaller than that calculated from the peak of the incident wave to the peak of the rflective wave of the pile toe. ot vice versa.
In pile 9. the influences od the crack near the pile top and the crack close to the pile toe are combined ogether. The refieerive wave of the crack near the pile top was superposed on the incident wave, and the peak reflected from the crack would extend forwardly to the peak of the incident wave. After superposition, the peak extends forwardly 10 the peak of the incident wave. Meanwhile, the reflective wave of the cruck near the pile toe was superposed on that of the pile toe. and the peak reflected from the crack would extend forwardly to the peak of the reflective wave of the pile toe. After superposition, the peak extends forwardly to the peak of the reflective wave of the pile toe. Thus. the wave speed calculared from the velocity curve c=3 409 m/s in pile 9 equals to c=3 409 m/s in pile 1.
According to the stress wave theory of pile detection (Wang, 1999), wave dispersion would occur in the case of a stress wave propagating in a shaft with gradually varying crosssection, but no reflection appears when the variation in crosssection is very slow. The wave equation of onc dimension for this case becomes (Miklowitz, 1978)
|
(1) |
where u is the displacement; ρ is the mass density of the shaft; A is the crosssection area of the shaft, σ is the stress exerted. on the crosssection; t and x are time and position coordinates, respectively.
According to Hooker's law,
|
where E is the elastic modulus of shaft, equation (1) becomes
|
(2) |
where c0 is the wave speed,
The second term,
This conclusion is consistent with both the stress wave theory mentioned above and the results of numerical simulation (Rausche et al., 1988).
Pile 3 with a suddenly decreasing crosssection, in which the value of β is higher than 3.5 %, is shown in Fig. 1. The signals reflected from the necking can be clearly seen from Fig. 1. It is hard to identify this kind of necking and its serious degree of damage only using the velocity response.
Model tests were performed by 10 piles with typical defects. The corresponding analyses show the foilowing conclusions.
(1) The appearance of a crack close to the pile toe could. cause the position of the peak of the reflective wave 10 extend forwardly to the peak of reflective wave of the pile toe so as 1o increase the calculated value of wave speed. A similar case would possibly occur in piles with cracks near the pile top. However, the effect of a small crack near the pile top on the. wave speed is dependent upon the relative position of the wave peak rllcted from the crack to the peak of the incident wave, If the peak reflected from the crack extends forwardly 1o the peak of the incident wave, the former would be superposed on the latter. The calculated wave speed would be smaller than the wave speed calculated from the peak of the incident wave to the peak of the reflective wave of the pile toe, or vice versa.
(2) The amplitude of the rllctive signal originating from the defec in a pile with a gradually decreasing cross section is dependent on the decreasing value of the rate of cross section β. No apparent signal rflected from the necking appeared on the velocity rcsponse curve when the value of β is less than about 3.5 %.
Miklowitz J, 1978. The Theory of Elastic Waves and W aveguides. Amsterdam: North-holland Publ Co |
Rausche F, Likins G, Hussein M, 1988. Pile Integrity by Low and High Strain Impacts. In: Bengt H F, ed. Proc of the Third International Conference on the Application of Stress Wave Theory to Piles Ottawa: [sn]. |
Wang J, 1999. Stress Wave Theory for Pile Detection and Engineering Application. Beijing: Seismological Press |