Advanced Search

Indexed by SCI、CA、РЖ、PA、CSA、ZR、etc .

Yu Zhu, Jun Wei, Manjuan Yang, Hao Li, Hongqing Liu. Analysis on Bearing Capacity of Tunnel-Type Anchorage of a Long-Span Suspension Bridge. Journal of Earth Science, 2005, 16(3): 277-282.
Citation: Yu Zhu, Jun Wei, Manjuan Yang, Hao Li, Hongqing Liu. Analysis on Bearing Capacity of Tunnel-Type Anchorage of a Long-Span Suspension Bridge. Journal of Earth Science, 2005, 16(3): 277-282.

Analysis on Bearing Capacity of Tunnel-Type Anchorage of a Long-Span Suspension Bridge

More Information
  • Corresponding author: Zhu Yu, E-mail: zhuyu1210@163.com
  • Received Date: 28 Feb 2004
  • Accepted Date: 25 Jun 2005
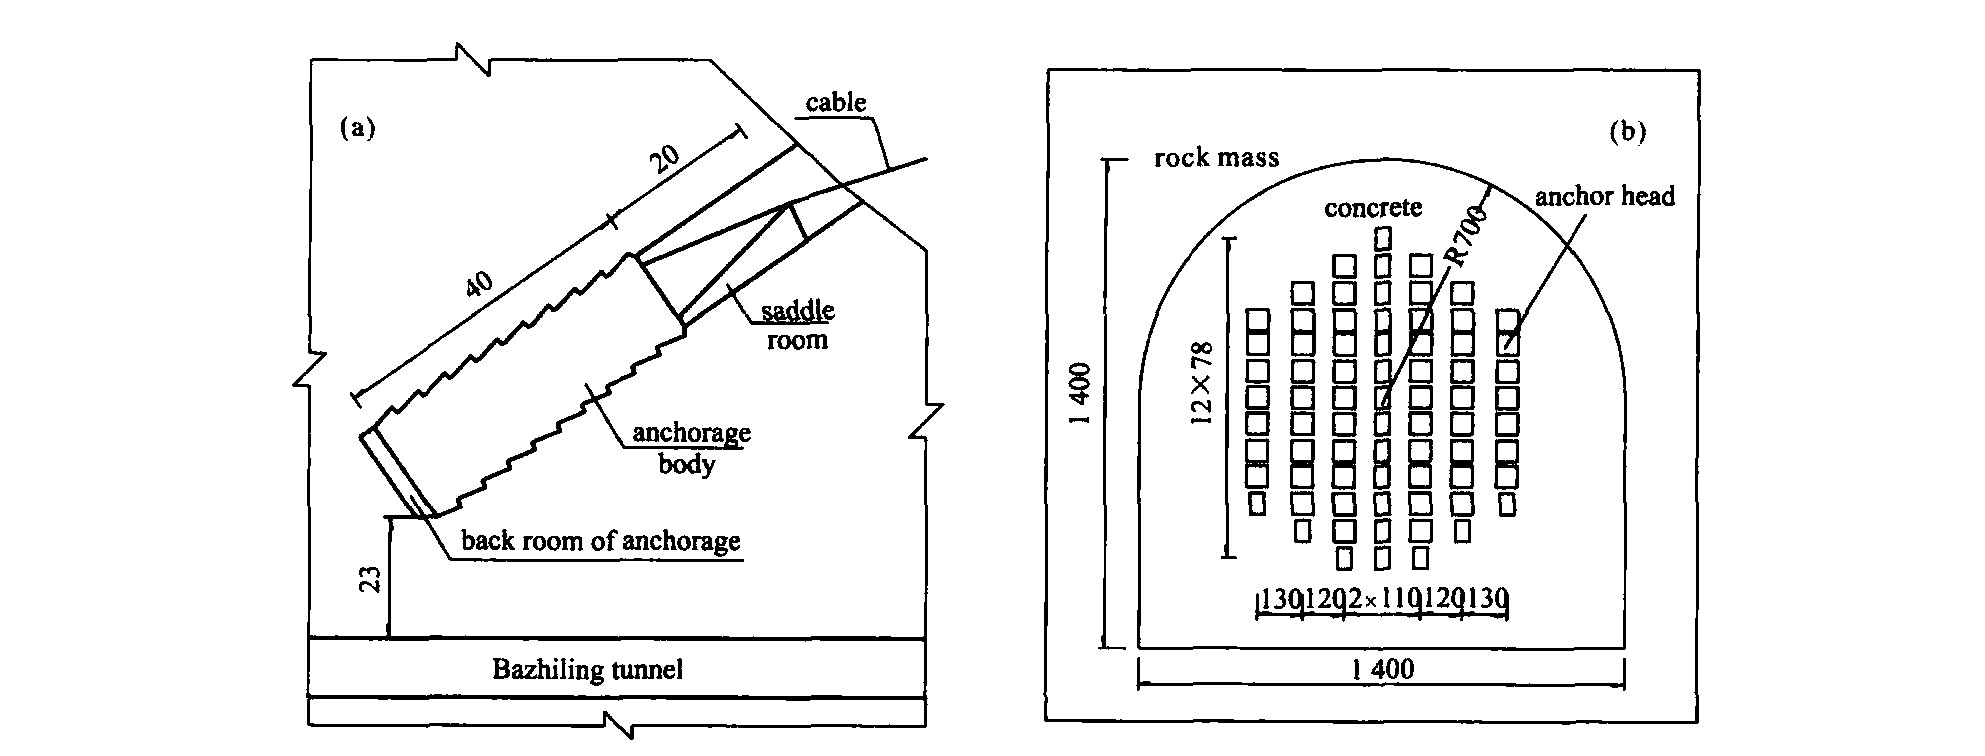
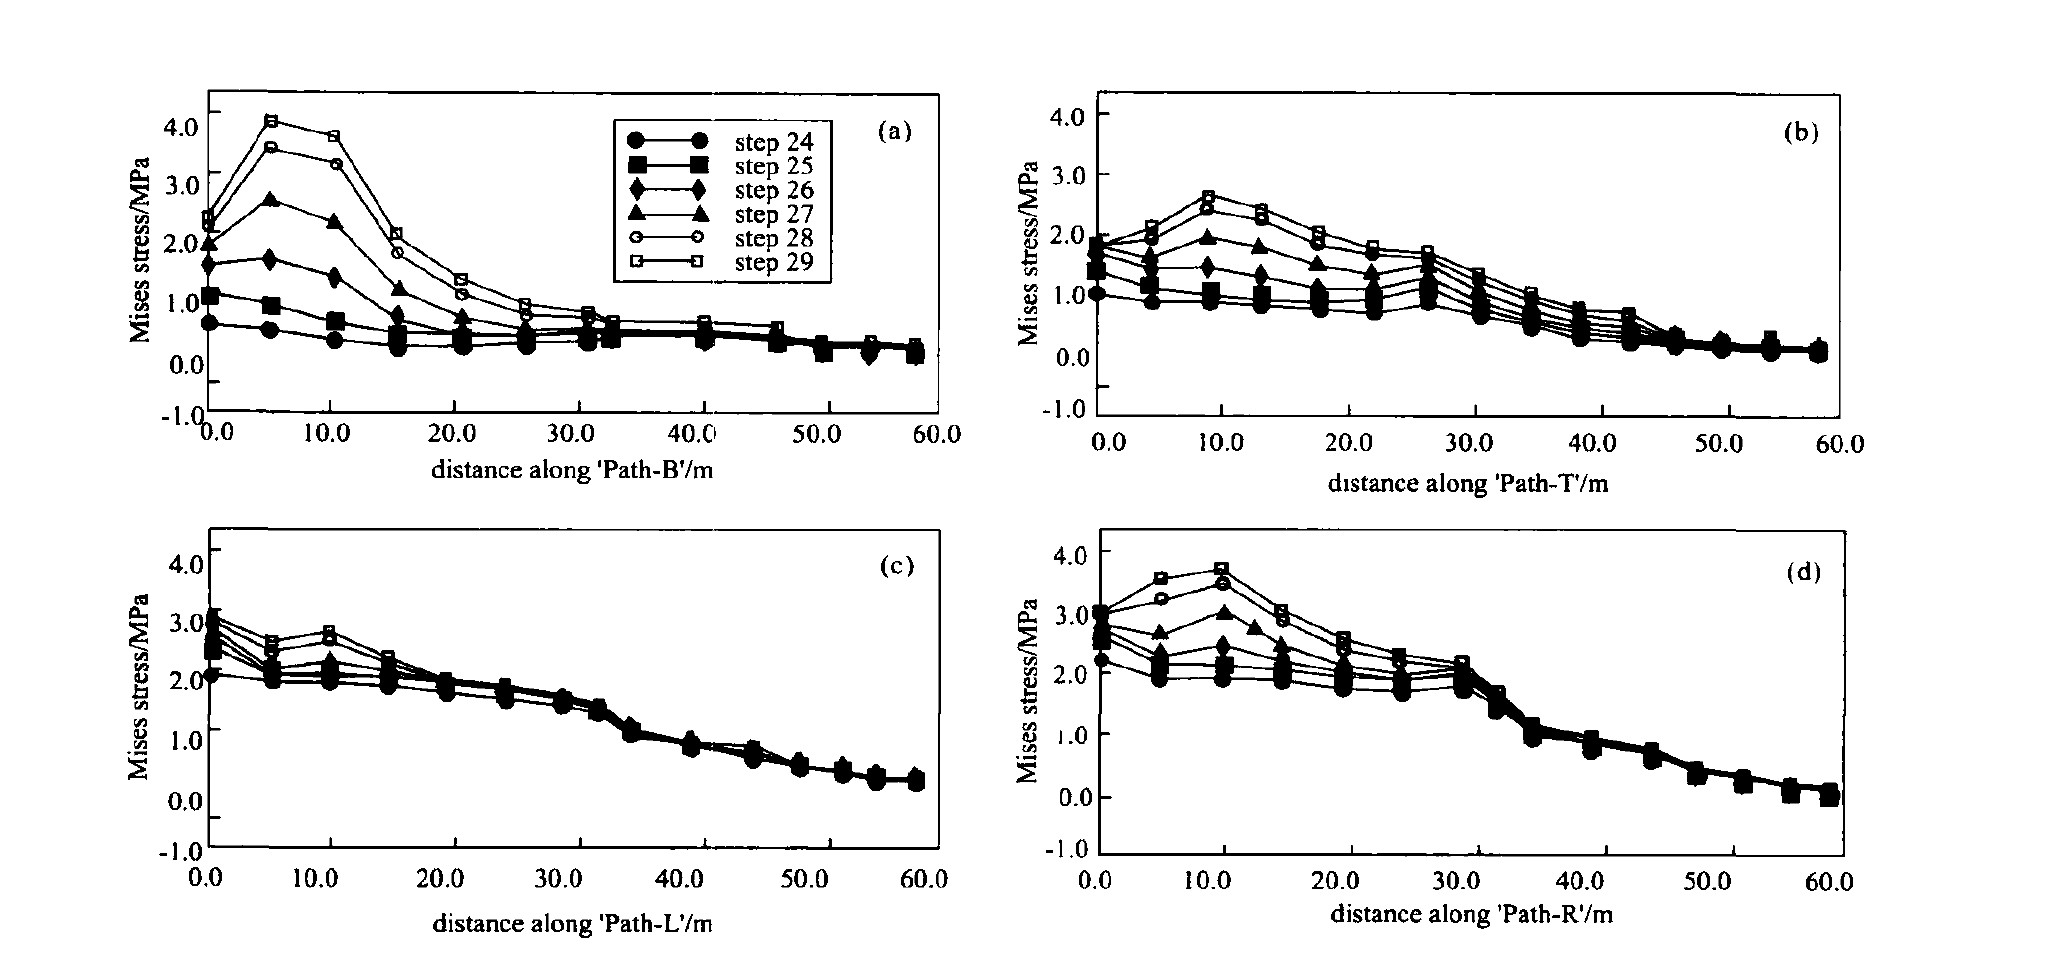
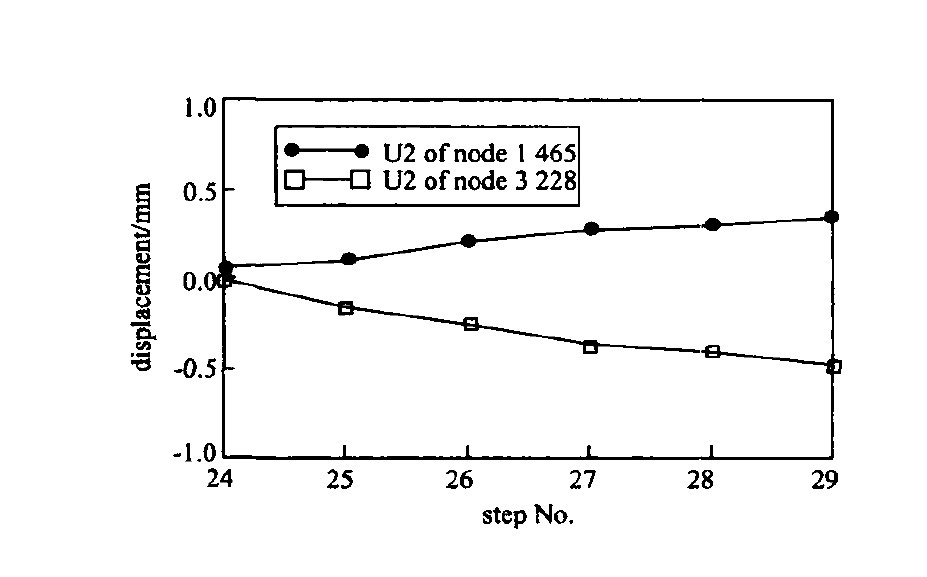
  • Due to complicated rock structure and environment, a prototype test for a tunnel-type anchorage is infeasible. Based on the rock mass parameters from tests, a three-dimensional (3D) elasto-plastic analysis was performed to simulate the influence of the construction procedure of Siduhe bridge with tunnel-type anchorage (TTA) in Hubei Province, China. The surrounding rock and concrete anchorage body were simulated by 8 nodes 3D brick elements. The geostatic state of the complex geometric structure was established with initial data. The in-situ concrete casting of the anchorage body and excavation of the rock mass were simulated by tetrahedral shell elements. The results show that the surrounding rock is in an elastic state under the designed cable force. The numerical overloading analysis indicates that the capacity of the surrounding anchorage is 7 times that of the designed cable force. The failure pattern shows that two anchorage bodies would be pulled out in the end. The maximum shear stress appears 10 m before the back anchorage face. The maximum range influenced by the TTA under ultimate loads is about 16 m.


  • Tunnel-type anchorage has obvious advantages in bearing capacity versus investment (Liu and Hu, 1996). However, it is rarely used in a practical project because of its requirement of good rock conditions. Siduhe bridge (Fig. 1), which lies in the Badong mountains in the west plateau of Hubei Province, is the longest suspension bridge with tunnel-type anchorage in China. The bridge site is mainly composed of limestone, and it is suitable for tunnel-type anchorage. The bridge will be built in a ravine and there is only 40 m between its pylon on Yichang bank and the entrance of Baziling highway tunnel. The tunnel-type anchorage lies just above the tunnel. As such, the design and construction of the anchorage are very involved.

    Figure  1.  Elevation view of Siduhe bridge.

    According to the function of the anchorage, two demands must be fulfilled. First, the strength and stiffness of the anchorage must be high enough to bear the bridge cable forces. Second, the rock around the anchorage must be strong enough to bear the forces transferred from the anchorage body. Of these, the latter is more important. A prototype test is infeasible due to the complicated rock structure and surrounding environment, making a numerical method be the preferred choice. A three-dimensional finite-element model was established to simulate the whole construction procedure, including the construction of the highway tunnel, the excavation of the tunnel-type anchorage, casting concrete, prestressing, installation of main cables, etc.. By using a numeric and overloading method, the bearing capacity and forecast possible destruction pattern was analyzed to provide a reliable basis for the design and construction of the bridge.

    The tunnel-type anchorage of Siduhe bridge is mainly constituted of three parts: the saddle room, anchorage body and back anchoring room. The anchorage body is 40 m long and the distance from its base to the top of the tunnel is 23 m.

    The saddle room contains the saddle and must be long enough to deploy the wires of the main cables to fix them properly. A prism shape has been chosen for the room and the distance from the saddle to the front of the anchorage is 20 m. Allowing for the different topography at two sides of the anchorage body, and to ensure minimum damage to the mountain slope, the lengths of the saddle room at two sides are different according to the transformation of the topography (Fig. 2a).

    Figure  2.  Layout of anchorage on Yichang bank (a) and distribution of prestress strands in rear anchoring plane (b) (unit: m).

    The anchorage body, which is a prestressed concrete structure, transfers the forces from the main cables to the rock mass. Its longitudinal surface, the front of which is small and the rear large, is in dovetail form. The anchorage produces positive pressure towards the rock mass due to axial tension force. The top of the transverse section is an arc and the side walls and base are lines (Fig. 2b). There is one 2-meter-long projecting strip per 4 m around the circumferential surface of the anchorage body in a longitudinal direction, like the whorl of the skew steel bar.

    The general purpose code ABAQUS (Hibbit, Karlson & Sorensen Inc., 2003) was used for the numerical analysis and the numerical overloading method was used.

    The generalized geotechnical model and computation parameters of the rock mass form the basis of the mechanical analysis. This research is based on the geological exploration results and parameters offered in reference (Zhou and Chen, 2003). The mechanical parameters of the rock mass in the anchorage area are listed in Table 1.

    Table  1.  Mechanical parameters of rock mass used in anchorage area of Siduhe bridge
     | Show Table
    DownLoad: CSV

    The excavation of a whole hole in the tunnel-type anchorage, and the action of the tensile force of the cable, can be considered as an infinite-field problem. When the finite-element method (FE) is used, it is difficult to determine where to set the boundary condition so it has the minimum influence on results. When a larger range is selected, there would be accurate computation results and a longer computation time, which is limited by computer memory. When a smaller range is selected, the results will be affected by the man-made boundary condition. There are different suggestions about the selection of the compu-tation range in Lu et al. (1999). In this research, synthesizing the research results of others and considering the interaction between tunnel-type anchorage and the highway tunnel under it, the computation range is selected as 7 times the dimension of the cavern; that is 324.2 m in length, 240 m in width, and 229 m vertically.

    The rock mass is considered an elasto-plastic body. For rock/soil material, the Mohr-Coulomb (M-C) and Drucker-Prager (D-P) criteria are widely used (jumikis, 1983). In this paper, we use the extended M-C criterion for numeric analysis. The yield function is

    (1)

    (2)

    and the plastic potential function is (Menétrey and William, 1995)

    (3)

    (4)

    (5)

    where c0 is the initial cohesion of the material; ε is the meridional eccentricity; ϕ is the friction angle; ψ is the dilation angle; p is the hydrostatic pressure; q is the equivalent Mises stress, and J3 is the invariant of the third stress deviator. The normal flow rule is adopted and no strengthening of the material is considered.

    The surrounding rock is in its original stress state before the whole hole of the tunnel-type anchorage is excavated. Temperature stress is not considered because the anchorage is located in a shallow field (the maximum depth is about 100 m). The original stress field could be computed according to the gravitational field of the rock mass.

    There are three types of loads: (1) Weight of anchorage and lining structure, which will be changed into a nodal force by the software according to the physical force. (2) Prestressing force. There are 73 bundles of prestress strands in each anchorage body, and the prestressing force will be changed into area loads following the size of the anchoring surface. Considering the working area is 38.88 m2, the effective prestress 1 116 MPa could be converted into an area load 9 659 MPa. (3) Designed force of cables. The designed force for each cable is 220 MN and the corresponding area load is 5 658 kPa.

    In the FE analysis, by means of pilot calculations, the construction progress is simulated by 29 construction steps in consideration of the configuration of the computer, the structure type and the possible construction states. The steps are as follows: establishment of original stress state (steps 1-2), excavation of Baziling tunnel and lining (steps 3-9), excavation of saddle room and lining (steps 10-15), excavation of anchorage body (steps 16-21), backfilling of anchorage body (step 22), prestressing on anchorage body (step 23), application of cable force (step 24), the numeric and overloading trial with 3 times cable force (step 25), 5 times cable force (step 26), 7 times cable force (step 27), 9 times cable force (step 28), and 10 times cable force (step 29).

    For the purpose of this study, a complete 3D FE model was established, as shown in Fig. 3 (longitudinal direction along bridge axis is denoted by 1, vertical direction by 3, and transverse direction by 2). In this model, two types of finite elements are used. The rock mass and anchorage body are modeled as hexahedral elements, and ejecting concrete and the lining are modeled as tetrahedral shell elements. There are 16 844 hexahedral elements, 944 tetrahedral shell elements and 21 198 nodes. Assuming the remolding thickness due to excavation of surrounding rock is 1 m, the cementation strength of the rock mass and anchorage body concrete is considered. The shearing strength parameters of the concrete/rock in Table 1 were adopted. The normal displacement in side directions, three-dimensional displacements in the base are all restrained, and the top is free.

    Figure  3.  FE model. (a) hexahedral elements of rock mass; (b) shell elements of lining.

    The computation results suggest that the plastic area only emerges in the surrounding rock of the back anchor rooms under designed cable force P. The plastic area extends slowly at the back, but develops quickly in front and to the sides of the body. At 7 times the designed cable force, the majority of the surrounding rock would be in a plastic state. Figure 4c shows that 70 % of the rock mass is in plasticity, and plastic areas between two anchorage bodies as shown in Fig. 5c. With 9 times the designed cable force, almost all surrounding rock is in plasticity (Fig. 4d) and plastic areas run through and extend around in a transverse direction (Fig. 5d).

    Figure  4.  Plastic areas in rock mass (left side of anchorage, perspective view). (a) 3 times cable force; (b) 5 times cable force; (c) 7 times cable force; (d) 9 times cable force.
    Figure  5.  Plastic areas in rock mass (transverse section). (a) 3 times cable force; (b) 5 times cable force; (c) 7 times cable force; (d) 9 times cable force.

    The bearing capacity is about 5-7 times of the designed cable force based on the analysis of the distribution of plastic areas in the surrounding rock. It could be regarded that the anchorage has been destroyed at 7 times the normal cable force. There is no plastic area in the surrounding rock near the tunnel under the anchorage with cable force increasing from 3 to 10 times.

    From the back plane of the anchorage body to the saddle room, four central paths are defined along the direction of the cable force, in order to study the distribution of shearing stress (Mises stress q) in the surrounding rock. The left and right paths are de-fined by facing the bridge and looking along the di-rection of the cable force: the left-hand path is Path-L, the right-hand path is Path-R, the top path is Path-T and the bottom is Path-B. Figure 6 shows the variation of Mises stress along the four paths. The distance from the back surface of the anchorage body is represented along the horizontal (m) and the Mises stress is represented vertically (MPa). The suffix in the symbol box represents the corresponding construction step number; for example, "24" represents the 24th construction step.

    Figure  6.  Mises stress along four central paths in surrounding rock. (a) Path-B-central line at bottom; (b) Path-T-central line at top; (c) Path-L-central line at left side; (d) Path-R-central line at right side.

    It can be seen from Fig. 6 that the distribution of shearing stress along the different paths is almost the same. Owing to the prestressed anchoring system without bond, shearing stress near the back plane of the anchorage is larger, and gradually decreases moving forward, approaching zero at the front plane.

    There are differences in the distribution of shearing stress. It is obvious that shearing stress along Path-L varies little under different cable forces. For example, it increases only 1 MPa when cable force is increased from 1 to 10 times. This is quite different from the other three because of the expansion of the palstic zone in the surrounding rock between anchorages. The stress near the back plane of the anchorage spreads to the right due to the development of a plastic area in the rock between the two anchorage bodies, and the maximum shearing stress along Path-R approaches 4 MPa in the surrounding rock at the right side of the anchorage. The stress along Path-T is similar to that along Path-L with a comparative maximum value of about 3 MPa; it shows a wider range of stress under different cable forces. The variety of stress along Path-R is the most obvious one where the shearing stress varies from 0.5 to 4.0 MPa. The maximum value of shearing stress along all the four paths appears at a point 10 m from the back plane of the anchorage, and then decays. An explanation is that some distance is required when cable forces are transferred from the back plane of the anchorage to the concrete anchorage bodies.

    With 7 times the designed cable force, the value of the shearing stress of the surrounding rock is about 3 MPa at the bottom and right side of anchorage, and about 2 MPa at the top and left side. The gap between them is about 1 MPa. The possible destruction pattern of the surrounding rock is concluded to be the following: plastic areas between anchorages cut through and this leads to unloading in these areas, then the stress transfers to the surrounding rock at the bottom and right side, and the two anchorage bodies are pulled out in the end.

    This conclusion can also be proved by differences between the displacements near the front and back faces of the anchorage body on Path-T (Fig. 7, node 3 228 is near the front face, node 1 465 is near the back face of anchorage body. U2 is the displacement in direction 2).

    Figure  7.  Lateral displacement in surrounding rock near the front and back faces of the anchorage.

    A complete 3D FE model was established for the tunnel-type anchorage in Siduhe suspension bridge in order to analyze its bearing capacity. From this analysis, the main conclusions can be summarized as follows: (1) The plastic area in the surrounding rock extends slowly backwards, but develops fast in forward and transverse directions. With 7 times the designed cable force, about 70 % of the surrounding rock is in plasticity and plastic areas between two anchorage bodies cut through. Under such circumstances, the rock appears to lose bearing capacity. It can be concluded that the safety factor of the anchorage is about 6 from this analysis. (2) In the prestressed anchoring system without bond, the maximum shearing stress appears at a point 10 m away from the back plane of the anchorage. It shows that 10 m is the necessary distance when cable forces transfer from the back anchorage head to the anchorage body for the tunnel-type anchorage of Siduhe bridge. (3) The possible destruction pattern of the surrounding rock is that plastic areas between two anchorage bodies cut through, which leads to unloading in these regions and stress transfers to the bottom and right side of anchorage, and finally the two anchorage bodies are pulled out.

  • Hibbit, Karlson & Sorensen Inc., 2003. ABAQUS Theory Manual(Ver. 6.4). Pawtucket, R. I.
    Jumikis, A. R., 1983. Rock Mechanics. 2nd Edition. Gulf Publishing Company, Houston.
    Liu, J. X., Hu, Z. T., 1996. Long Span Suspension Bridge. China Communications Press, Beijing(in Chinese).
    Lu, A. Z., Jiang, B. S., You, C. A., 1999. Studyon Range of Mesh about Finite Element for Back Analysis of Displacement. China Civil Engineering Journal, 32(1): 26-30(in Chinese).
    Menétrey, P. H., William, K. J., 1995. Triaxial Failure Criterion for Concrete and Its Generalization. ACI Structural Journal, (92): 311-318 https://www.concrete.org/publications/internationalconcreteabstractsportal.aspx?m=details&i=1132
    Zhou, H. M., Chen, H. Z., 2003. Research on Rock Mass Mechanical Propertiesin Region of Siduhe Bridge in Yichang Enshi Segmenton Hu Rong National Road. Un-published Report. China Communications Second High-way Survey Design and Research Institute, Wuhan(in Chinese).
  • Relative Articles

    [1]Yuhua Wang, Jianqing Lai, Yonghua Cao, Matthew Brzozowski, Yong Wan, Luqing Zhou. Characterizing the dynamics of the magma conduit system hosting the Jinchuan Ni-Cu-PGE sulfide deposit through statistical analysis of base-metal sulfide compositions[J]. Journal of Earth Science. doi: 10.1007/s12583-025-0207-4
    [2]Lidong Zhang, Changzhou Deng, Yao Tang, Xinran Ni, Bizheng Yang, Shanshan Liang, Weipeng Liu, Jishuang Ding, Xiaohui Zeng. Pyrite Geochemistry and S-Hg Isotopes Reveal the Ore Genesis of the Hydrothermal Vein-type Cuiluan Ag-Pb-Zn Deposit in NE China[J]. Journal of Earth Science. doi: 10.1007/s12583-025-0201-x
    [3]Jiangxia Wang, Panpan Xu, Hui Qian, Yongqi Zang, Qiming Wang, Zhiyuan Ma. Genesis of geothermal water in the hinterland of Guanzhong Basin, China: Insight from hydrochemical and isotopic analysis[J]. Journal of Earth Science. doi: 10.1007/s12583-025-0202-9
    [4]Zeyang Liu, Meilin Jiang, Fuming Zhou, David Selby, Zhen Qiu. The role of terrestrial organic matter in Re and Os uptake: Insights for Re-Os dating of organic-bearing sedimentary rocks and weathering of organic carbon[J]. Journal of Earth Science. doi: 10.1007/s12583-025-0255-9
    [5]Xu Lin, Chang’an Li, Jing Liu-Zeng, Jovliet Marc, Haijin Liu, Lingling Li, Chengwei Hu, Xiaokang Chen, Jixin Chen. Detrital zircon U-Pb age analysis of Late Pliocene deposits from the lower Yangtze River, South China: Implications for sedimentary provenance and evolution of the Yangtze River[J]. Journal of Earth Science. doi: 10.1007/s12583-023-1961-9
    [6]Xifeng Guo, Xinfu Xing, Zhonghao Wang, Qiang Cheng, Lei Huang, Ning Li, Shengming Hu. Compression Characteristic and Creep Behavior of Moraine Soil at Xingkang Bridge, West Sichuan, China[J]. Journal of Earth Science, 2023, 34(4): 1272-1279. doi: 10.1007/s12583-022-1800-4
    [7]Reda Amer, Timothy M. Kusky. ASTER Analysis for Locating REE-Bearing Granites in Arid Regions: Example from the Arabian Shield[J]. Journal of Earth Science, 2022, 33(5): 1114-1123. doi: 10.1007/s12583-022-1650-0
    [8]Xinghua Ma, Qingwen Zeng, Siyuan Tao, Rui Cao, Zhenhua Zhou. Mineralogical Characteristics and in-situ Sulfur Isotopic Analysis of Gold-Bearing Sulfides from the Qilishan Gold Deposit in the Jiaodong Peninsula, China[J]. Journal of Earth Science, 2021, 32(1): 116-126. doi: 10.1007/s12583-020-1370-2
    [9]Zhiye Gao, Shuling Xiong. Methane Adsorption Capacity Reduction Process of Water-Bearing Shale Samples and Its Influencing Factors: One Example of Silurian Longmaxi Formation Shale from the Southern Sichuan Basin in China[J]. Journal of Earth Science, 2021, 32(4): 946-959. doi: 10.1007/s12583-020-1120-5
    [10]Xiaofei Fu, Lingyu Yan, Lingdong Meng, Xiaobo Liu. Deformation Mechanism and Vertical Sealing Capacity of Fault in the Mudstone Caprock[J]. Journal of Earth Science, 2019, 30(2): 367-375. doi: 10.1007/s12583-018-0998-7
    [11]Gang Chen; Shuheng Li; Huiruo Zhang; Fu Yang; Chao Ding; Panpan Lei; Yanxu Hu. Fluid Inclusion Analysis for Constraining the Hydrocarbon Accumulation Periods of the Permian Reservoirs in Northeast Ordos Basin[J]. Journal of Earth Science, 2013, 24(4). doi: 10.1007/s12583-013-0354-x
    [12]M S Muya, Bo HE, Jingtao WANG, Guocheng LI. Simulation of Stress Distribution around Tunnels and Interaction between Tunnels Using an Elasto-plastic Model[J]. Journal of Earth Science, 2007, 18(1): 90-94.
    [13]Jian-min ZI, Yuan-han WANG, Hong-ping ZHU. Numerical and Experimental Study of Free Vibration Characteristics of a Cable-Stayed Bridge[J]. Journal of Earth Science, 2006, 17(2): 185-188.
    [14]Li Li, Yuancheng Peng, Xiaohong Long, Ping Liao. Nonlinear Stability Analysis of Long-Span Continuous Rigid Frame Bridge with Thin-Wall High Piers[J]. Journal of Earth Science, 2005, 16(1): 72-78.
    [15]Tao Cheng, Jingtao Wang, Bichang Dong. Decoupling Conditions for Elasto-plastic Consolidation Question Based on Numerical Modeling Method[J]. Journal of Earth Science, 2005, 16(4): 363-368.
    [16]Xiaohong Long, Li Li. Study of Nonlinear Seismic Response and TMD Primary Control of the Cable-Stayed Bridge Section of the Third Macao-Taipa Bridge[J]. Journal of Earth Science, 2004, 15(4): 409-415.
    [17]Yusheng Zhai, Runmin Peng, Jun Deng, Jianping Wang. Analysis of Mineralization System and Prediction of New-Type Ore Deposits[J]. Journal of Earth Science, 2000, 11(2): 107-112.
    [18]V. N. Golubev, I. V. Chernyshev, B. T. Kochkin, N. N. Tarasov, G. V. Ochirova, A. V. Chugaev. Uranium Isotope Variations (234U/238U and 238U/235U) and Behavior of U-Pb Isotope System in the Vershinnoe SandstoneType Uranium Deposit, Vitim Uranium Ore District, Russia[J]. Journal of Earth Science. doi: doi.org/10.1007/s12583-021-1436-9
    [19]Yin Chen, Peisen Miao, Jianguo Li, Ruoshi Jin, Hualei Zhao, Lulu Chen, CongWang, Haoyu Yu, Xiaoru Zhang. Association of Sandstone-Type Uranium Mineralization in the Northern China with Tectonic Movements and Hydrocarbons[J]. Journal of Earth Science. doi: doi.org/10.1007/s12583-021-1493-0
    [20]Ruoshi Jin, Huajian Liu, Xiaoguang Li. Theoretical System of Sandstone-Type Uranium Deposits in Northern China[J]. Journal of Earth Science. doi: doi.org/10.1007/s12583-021-1449-4
  • Created with Highcharts 5.0.7Amount of accessChart context menuAbstract Views, HTML Views, PDF Downloads StatisticsAbstract ViewsHTML ViewsPDF Downloads2024-062024-072024-082024-092024-102024-112024-122025-012025-022025-032025-042025-0502.557.510
    Created with Highcharts 5.0.7Chart context menuAccess Class DistributionFULLTEXT: 45.5 %FULLTEXT: 45.5 %META: 52.0 %META: 52.0 %PDF: 2.5 %PDF: 2.5 %FULLTEXTMETAPDF
    Created with Highcharts 5.0.7Chart context menuAccess Area Distribution其他: 2.5 %其他: 2.5 %Austria: 0.6 %Austria: 0.6 %Azerbaijan: 0.6 %Azerbaijan: 0.6 %Canada: 0.6 %Canada: 0.6 %China: 41.7 %China: 41.7 %India: 0.6 %India: 0.6 %Israel: 0.6 %Israel: 0.6 %Japan: 0.6 %Japan: 0.6 %Korea Republic of: 0.9 %Korea Republic of: 0.9 %Mexico: 0.9 %Mexico: 0.9 %Netherlands: 2.2 %Netherlands: 2.2 %Norway: 0.9 %Norway: 0.9 %Peru: 0.9 %Peru: 0.9 %Poland: 0.6 %Poland: 0.6 %Reserved: 7.2 %Reserved: 7.2 %Russian Federation: 1.6 %Russian Federation: 1.6 %Saudi Arabia: 1.2 %Saudi Arabia: 1.2 %Serbia: 0.6 %Serbia: 0.6 %Spain: 0.9 %Spain: 0.9 %United Kingdom: 0.6 %United Kingdom: 0.6 %United States: 33.3 %United States: 33.3 %其他AustriaAzerbaijanCanadaChinaIndiaIsraelJapanKorea Republic ofMexicoNetherlandsNorwayPeruPolandReservedRussian FederationSaudi ArabiaSerbiaSpainUnited KingdomUnited States

Catalog

    通讯作者: 陈斌, bchen63@163.com
    • 1. 

      沈阳化工大学材料科学与工程学院 沈阳 110142

    1. 本站搜索
    2. 百度学术搜索
    3. 万方数据库搜索
    4. CNKI搜索

    Figures(7)  / Tables(1)

    Article Metrics

    Article views(1068) PDF downloads(29) Cited by()
    Proportional views
    Related

    /

    DownLoad:  Full-Size Img  PowerPoint
    Return
    Return