Processing math: 100%
Advanced Search

Indexed by SCI、CA、РЖ、PA、CSA、ZR、etc .

Xi-wu ZHOU, Jun WEI, Xin LUO. Determination and Application of the Sharp Degradation Point of Concrete under Environmental Actions. Journal of Earth Science, 2006, 17(2): 181-184.
Citation: Xi-wu ZHOU, Jun WEI, Xin LUO. Determination and Application of the Sharp Degradation Point of Concrete under Environmental Actions. Journal of Earth Science, 2006, 17(2): 181-184.

Determination and Application of the Sharp Degradation Point of Concrete under Environmental Actions

Funds:

the National Natural Science Foundation of China 50538070

the National Natural Science Foundation of China 50578068

More Information
  • Corresponding author: ZHOU Xi-wu, E-mail: xiwuzhou@163.com
  • Received Date: 15 Oct 2005
  • Rev Recd Date: 25 Mar 2006
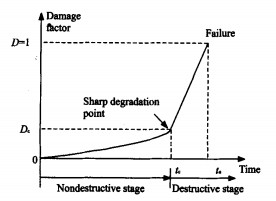
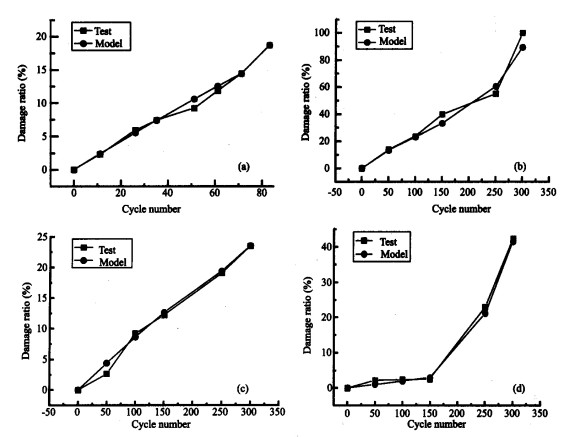
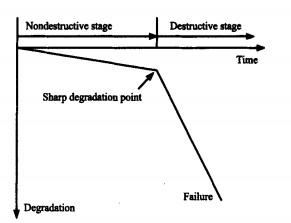
  • To study the sharp degradation point of concrete durability, damage at the characteristic failure point under loads was first obtained by the application of the one-dimensional stress-strain relationship of Saenz. Then based on the principle that damage at the characteristic failure point subjected to loads is equal to the damage in accordance with the characteristic point of concrete durability under environmental actions, the sharp degradation point of concrete durability was determined. The results were applied to the case of concrete suffering freeze-thaw actions. Good accordance between experimental results and forecasted results indicated the reliability of this method.


  • Many experimental results have indicated that the deterioration process of concrete can be divided into two stages--the nondestructive stage(stage 1) and the destructive stage(stage 2), as shown in Fig. 1(Wu, 2002;Rostam, 1993).When concrete is subjected to environmental actions, the inner energy it gains is almost balanced by the released energy when cracking in stage 1, while in stage 2 the inner energy is greater than that released.There are few remarkable degradation phenomena in concrete as cracks expand slowly and stably in stage 1, while in stage 2, concrete deteriorates rapidly and performance markedly degenerates; finally, cracks expand sharply and cut through damaged areas until the concrete fails completely.

    Figure  1.  General degradation process of concrete under freeze-thaw actions

    The corresponding damage evolution process is shown in Fig. 2.In stage 1, as damage slowly accumulates in the concrete.more discontinuous and fine cracks appear.The damage is isotropic, as well as the isotropy of concrete; hence, study in this stage can be conducted using the damag continuous medium.In stage 2, e mechanics of a damage develops sharply until the terminal stage。when.D=1 and concrete collapses.The critical point between the two stages is defined as the sharp degradation point, which is a mark of accelerated damage in the degradation process.Undoubtedly, the sharp degradation point is more attractive.

    Figure  2.  The developing process of concrete damage under freeze-thaw actions

    This problem has been studied by several authors(Hisham and Iqbal, 2003; Guan et al., 2001; Akhras, 1998; Alliche and Francois, 1992, 1986).However.traditional research to determine the characteristic degradation point under environmental tictions has been conducted chiefly by observational and empirical ways.In this paper, a Successful theoretical method is presented, which can easily determine the sharp degradation point in the damage evolution process of concrete.

    The stress-strain curve of concrete under uniaxial compression is described by the Saenz formula (Chen and Salip, 2001)

    (1)

    where E0 is the initial Young's modulus; Ef is the secant modulus in accordance with the peak stress fc; εf is the peak strain.

    For undamaged material, the stress-strain relationship is

    (2)

    According to the equivalent hypothesis of a strain, damaged material under an effective stress has an equivalent strain with the undamaged material of the same kind(Li, 2002)

    (3)

    Based on equations(1) and(3), the damage variable can be defined as follows

    (4)

    In the above expression, the damage variable D is applicable to the whole uniaxial compression process, not merely in the ascending branch.

    Assuming the stress at the degradation point in the failure process of concrete under uniaxial cornpression could be described fls follows

    (5)

    Suppose that E0/Ef=A,εϕ/εf=B,εϕ is the strain at the characteristic point.

    Based on equations (1), (4) and (5), Dϕ can be obtained as follows

    (6)

    Many experiments and research have indicated that when concrete is under a uniaxial stress, cracks begin to expand while the stress reaches its critical point (about 0.7fc0.9fc), which means α=0.70.9. Generally, the secant modulus is half of the Young's modulus when the stress reaches its peak, that is A=2. The damage at the degradation point of concrete subjected to loads can be calculated by equation (6) (shown in Table 1).

    Table  1.  Damage at degradation point
     | Show Table
    DownLoad: CSV

    The failure process of concrete subjected to environmental actions is gradual. Under environmental actions, the degradation of concrete durability follows the sequential process of initiation, expansion and connectivity of flaws, such as microcracks and interspace, which is similar to the failure process of concrete under loads. It is feasible to solve the durability problem of concrete in a mechanical way. Based on the principle that damage at the characteristic failure point subjected to loads is equal to the damage in accordance with the characteristic degradation point of concrete durability under environmental actions, the sharp degradation point of concrete durability can be determined in the light of the one-dimensional stress-strain relationship mentioned above. According to Chen and Salip (2001), we make α=0.75 here. Then, the damage at the sharp degradation point can be obtained: Dc=Dϕ=0.17.

    With the alternate rise and fall in temperature, concrete with sufficient water inside will generally undergo damage due to freeze-thaw actions.Concrete structures, such as hydro-structures, harbor structures, roads and bridges, are often damaged by freeze-thaw denudation.Failure induced by freezethaw actions is the most representative index of concrete durability degradation.Taking the degradation process of concrete durability in freeze-thaw cycles as an example, we apply the damage expression of the sharp degradation point to establish corresponding damage evolution equations.

    Many experimental results(Wei et al., 2003; Zhao, 2003)indicate that concrete in freeze-thaw cycles goes through two stages: (1)the initial stage, when the damage within the concrete has not been lo- calized; (2)the expanding stage, in which the damage has been localized.The cut-off point between the two stages is the sharp degradation point.Freezethaw damage in the two stages could be described by the following equations

    (7)

    (8)

    where α and β are constants related to concrete material and temperature etc.; Nc is the times of freezethaw cycle and Dc is the damage value at the sharpdegradation point.

    Taking the damage evolution process of concrete under freeze-thaw actions as an example here, the accuracy of the ascertained sharp degradation point is verified with both theoretical and experimental methods. Four kinds of concrete specimens were made in dimension of 100 mm×100 mm×400 mm, and a slow freezing method was adopted. Values of supersonic speed for each specimen were measured respectively after each freeze-thaw cycle. By constructing a variable D=1v2Nv2 with supersonic speed, the damage ratio of concrete after certain freeze-thaw cycles can be obtained (Zhao, 2003).

    Tables 2 and 3 show the damage values of different types of concrete after consecutive freeze-thaw cycles. Three common concrete types are testedC30, C40, C60, and high performance concreteH40 (Zhao, 2001). The freeze-thaw cycle times in accordance with damage Dc=0.17 are calculated with the interpolation method and shown in the last column. Based on the freeze-thaw cycle times in accordance with the sharp degradation point and the damage Dc, damage values in accordance with different freeze-thaw times are calculated with equations (7) and (8) and shown in Tables 2 and 3. Experimental and calculated values are both shown in Fig. 3. Good agreement between the two kinds of results confirms the accuracy of the calculated critical point damage.

    Table  2.  Damage ratio in the freeze-thaw experimeat of C30  %
     | Show Table
    DownLoad: CSV
    Table  3.  Damage ratio in the freeze-thaw experiment of C40.H40 and C6  %
     | Show Table
    DownLoad: CSV
    Figure  3.  Comparison between experimental and forecasted values.(a)C30;(b)C40;(c)H40; (d)C60.

    The following conclusions can be drawn from this paper.(a)Based on the principle that damage at the characteristic failure point subjected to loads is equal to the damage at the characteristic point of concrete durability under environmental actions, the damage at the sharp degradation point can be ascertained.(b)By applying this method to the case of concrete suffering freeze-thaw actions, good accordance between experimental results and forecasted resuits indicated the rationality of the critieal point damage induced in this paper.(c)The confirmation of the critical point will help to solve the damage evolution law of concrete durability, and furthermore。it has great significance in the performance design and life evaluation field of concrete.

  • Akhras, N.M., 1998. Detecting Freezing and Thawing Damage in Concrete Using Signal Energy. Cement and Concrete Research, 28(9): 1275~1280 doi: 10.1016/S0008-8846(98)00101-X
    Alliche, A., Francois, D., 1986. Fatigue Behavior of Hardened Cement Paste. Cem. Concr. Res., 16(2): 199-206 doi: 10.1016/0008-8846(86)90136-5
    Alliehe, A., Francois, D., 1 992. Damage of Concrete in Fatigue. ASCE Journal of Engineering Mechanics, 118 (11): 285-297
    Guan, Y.G., Sun, W., Miu, C.W. 。2001. Analysis onDeterioration Characteristic Point of High Strength Concrete under Freeze-Thaw Cycles. Journal 0f Southeast University, 31(6): 26-29(in Chinese with English Abstract)
    Hisham, Y.Q., Iqbal, A.M., 2003. The Use of USPV tO Anticipate Failure in Concrete under Compression. Cement and Concrete Research, 33(12): 2017-2021 doi: 10.1016/S0008-8846(03)00218-7
    Jiang, J.J., Lu, X.Z., Ye, L.P., 2005. Finite Element Analysis of Concrete Structures. Tsinghua University Press. Beijing. 111-112(in Chinese)
    Li, Z.X., 2002. Damage Mechanics and Its Application. Science Press, Beijing. 16--18(in Chinese)
    Rostam, S., 1993. Service Life Design-The European Approach. ACI Concrete International, 15(7): 24-32
    Wei, J., Wu, X.H., Zhao, X.L., 2003. A Model for Concrete Durability Degradation in Freeze-Thawing Cycles. Acta Mechanica Solida Sinica, 16(4): 353-358
    Wu, X.H., 2002. Research on the Deterioration Process of Concrete Durability under Freeze-Thaw Cycles: [Dissertation]. Huazhong University of Science and Teehnology, Wuhan(in Chinese with English Abstract)
    Zhao, X.L., 2001. Research on Durability of High Performance Concrete in Cold Areas and Evaluation Methods. Harbin Institute of Technology, Harbin(in Chinese)
    Zhao, X.L., 2003. Research on Damage Evolution Law of Concrete under Freeze-Thaw Cycles: [Dissertation]. Huazhong University of Science and Technology, Wuhan (in Chinese)
  • Relative Articles

    [1]Yang Xue, Fasheng Miao, Yiping Wu, Linwei Li, Daniel Dias, Yang Tang. Probabilistic Assessment of Constitutive Model Parameters: Insight from a Statistical Damage Constitutive Model and a Simple Critical State Hypoplastic Model[J]. Journal of Earth Science, 2025, 36(2): 685-699. doi: 10.1007/s12583-022-1763-5
    [2]Xin Wei, Yanjun Shen, Yan Wang, Muhammad Murtaza, Rui Wang, Wei Shen. Textural and mineralogical characterization of moraine from the Galongla Glacier: Insights into climate-driven glacial degradation in Southeast Tibet[J]. Journal of Earth Science. doi: 10.1007/s12583-025-0236-z
    [3]Zhen Ye, Qiang Xu, Qian Liu, Xiujun Dong, Feng Pu. 3D Distinct Element Back Analysis Based on Rock Structure Modelling of SfM Point Clouds: The Case of the 2019 Pinglu Rockfall of Kaili, China[J]. Journal of Earth Science, 2024, 35(5): 1568-1582. doi: 10.1007/s12583-022-1667-4
    [4]Jing-Jing Tian, Tian-Tao Li, Xiang-Jun Pei, Jian Guo, Shou-Dao Wang, Hao Sun, Pei-Zhang Yang, Run-Qiu Huang. Experimental Study on Multistage Seismic Damage Process of Bedding Rock Slope: A Case Study of the Xinmo Landslide[J]. Journal of Earth Science, 2024, 35(5): 1594-1612. doi: 10.1007/s12583-023-1829-z
    [5]Suran Wang, Youliang Chen, Jing Ni, Guanlin Liu, Tomás Manuel Fernández-Steeger, Chao Xu. Mechanical Characteristics and Mechanism of Granite Subjected to Coupling Effect of Acidic Corrosion and Freeze-Thaw Cycles[J]. Journal of Earth Science, 2021, 32(5): 1202-1211. doi: 10.1007/s12583-021-1414-2
    [6]Caixiang Zhang, Xiaoping Liao, You Lü, Chao Nan. Enhanced Degradation of Methyl Parathion in the Ligand Stabilized Soluble Mn(Ⅲ)-Sulfite System[J]. Journal of Earth Science, 2019, 30(4): 861-869. doi: 10.1007/s12583-018-0889-y
    [7]Brad Walker. Comparison of the Birds Point-New Madrid Floodway, Mississippi River and the Yolo Bypass, Sacramento River[J]. Journal of Earth Science, 2016, 27(1): 47-54. doi: 10.1007/s12583-016-0628-1
    [8]Kaichang Di, Zongyu Yue, Zhaoqin Liu, Shuliang Wang. Automated Rock Detection and Shape Analysis from Mars Rover Imagery and 3D Point Cloud Data[J]. Journal of Earth Science, 2013, 24(1): 125-135. doi: 10.1007/s12583-013-0316-3
    [9]Frederik P. AGTERBERG. Fractals and spatial statistics of point patterns[J]. Journal of Earth Science, 2013, 24(1): 1-11. doi: 10.1007/s12583-013-0305-6
    [10]Junqi Liu, Xuebin Huang, Chonglong Wu, Wenming Cheng, Wei Xiang, He Xia. From the Area to the Point-Study on the Key Technology of 3D Geological Hazard Modeling in Three Gorges Reservoir Area[J]. Journal of Earth Science, 2012, 23(2): 199-206. doi: 10.1007/s12583-012-0246-5
    [11]Jingxun Zuo, Shanchi Peng, Xuejian Zhu, Yuping Qi, Huanling Lin, Xianfeng Yang. Evolution of Carbon Isotope Composition in Potential Global Stratotype Section and Point at Luoyixi, South China, for the Base of the Unnamed Global Seventh Stage of Cambrian System[J]. Journal of Earth Science, 2008, 19(1): 9-22.
    [12]Yong GE, He-xiang BAI, Qiu-ming CHENG. Solution of Multiple-Point Statistics to Extracting Information from Remotely Sensed Imagery[J]. Journal of Earth Science, 2008, 19(4): 421-428.
    [13]Qing-qing QIAO, Qing-sheng LIU, Ning QIU, Yuan-yuan FU, Su-tao ZHAO, Yao WU, Tao YANG, Zhen-min JIN. Investigation of Curie Point Depth in Sulu Ultrahigh-Pressure Metamorphic Belt, Eastern China[J]. Journal of Earth Science, 2008, 19(3): 282-291.
    [14]Zhi-liang FU, Hua GUO, Yan-fa GAO. Creep Damage Characteristics of Soft Rock under Disturbance Loads[J]. Journal of Earth Science, 2008, 19(3): 292-297.
    [15]Yanfen Wang, Yuanhan Wang, Hongyang Xie. Computing of the Anchor by the Method of Three-Dimension Point-Radiate Infinite Elements[J]. Journal of Earth Science, 2007, 18(2): 185-190.
    [16]Yaoguo Wu, Hui Wang, Wencun Zhang, Weijian Sun. Soil-Column Test on Aniline Degradation in Riverbank Filtration under Denitrification Conditions[J]. Journal of Earth Science, 2005, 16(2): 183-188.
    [17]Mushtak Talib Jabbar. Using Remote Sensing and GIS Techniques to Study Soil Degradation Processes in North Shaanxi Province, China[J]. Journal of Earth Science, 2003, 14(4): 356-362.
    [18]Yuanqiao Peng, Shangyan Wang, Yufang Wang, Fengqing Yang. A Proposed Area for Study of Accessory Section and Point of Terrestrial Permian-Triassic Boundary[J]. Journal of Earth Science, 2002, 13(2): 157-162.
  • Created with Highcharts 5.0.7Amount of accessChart context menuAbstract Views, HTML Views, PDF Downloads StatisticsAbstract ViewsHTML ViewsPDF Downloads2024-072024-082024-092024-102024-112024-122025-012025-022025-032025-032025-042025-0502.557.510
    Created with Highcharts 5.0.7Chart context menuAccess Class DistributionFULLTEXT: 45.9 %FULLTEXT: 45.9 %META: 54.1 %META: 54.1 %FULLTEXTMETA
    Created with Highcharts 5.0.7Chart context menuAccess Area Distribution其他: 0.8 %其他: 0.8 %China: 75.2 %China: 75.2 %Japan: 0.5 %Japan: 0.5 %Lebanon: 0.5 %Lebanon: 0.5 %Reserved: 4.2 %Reserved: 4.2 %Russian Federation: 3.7 %Russian Federation: 3.7 %United States: 15.0 %United States: 15.0 %其他ChinaJapanLebanonReservedRussian FederationUnited States

Catalog

    通讯作者: 陈斌, bchen63@163.com
    • 1. 

      沈阳化工大学材料科学与工程学院 沈阳 110142

    1. 本站搜索
    2. 百度学术搜索
    3. 万方数据库搜索
    4. CNKI搜索

    Figures(3)  / Tables(3)

    Article Metrics

    Article views(910) PDF downloads(23) Cited by()
    Proportional views
    Related

    /

    DownLoad:  Full-Size Img  PowerPoint
    Return
    Return