Advanced Search

Indexed by SCI、CA、РЖ、PA、CSA、ZR、etc .

Yuan-qing HE, Zong-sheng LI, Xiao-mei YANG, Wen-xiong JIA, Xian-zhong HE, Bo SONG, Ning-ning ZHANG, Qiao LIU. Changes of the Hailuogou Glacier, Mt. Gongga, China, against the Background of Global Warming in the Last Several Decades. Journal of Earth Science, 2008, 19(3): 271-281.
Citation: Yuan-qing HE, Zong-sheng LI, Xiao-mei YANG, Wen-xiong JIA, Xian-zhong HE, Bo SONG, Ning-ning ZHANG, Qiao LIU. Changes of the Hailuogou Glacier, Mt. Gongga, China, against the Background of Global Warming in the Last Several Decades. Journal of Earth Science, 2008, 19(3): 271-281.

Changes of the Hailuogou Glacier, Mt. Gongga, China, against the Background of Global Warming in the Last Several Decades

Funds:

Major Directionality Program of the Chinese Academy of Sciences KZCXZ-YW-317

Key Project of the National Natural Science Foundation of China 90511007

National Basic Research Program of China 2007CB411201

Innovative Research International Partnership Project of the Chinese Academy of Sciences CXTD-Z2005-2

and Project for Outstanding Young Scientists of the National Natural Science Foundation of China 40121101

More Information
  • Corresponding author: Li Zongxing, yxmlzx1982822@163.com
  • Received Date: 30 Nov 2007
  • Accepted Date: 10 Feb 2008
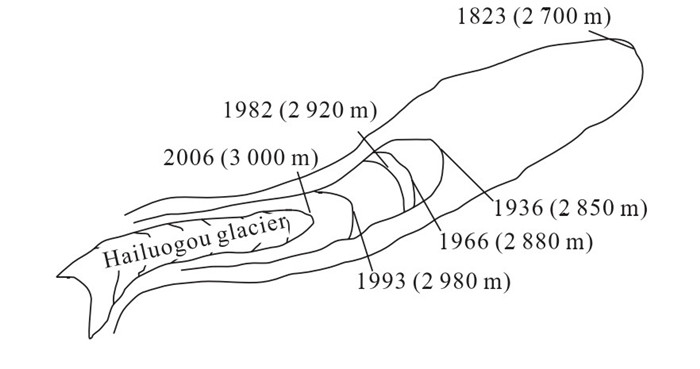
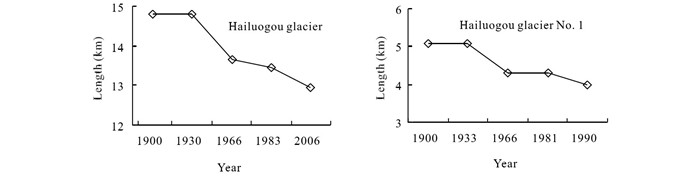
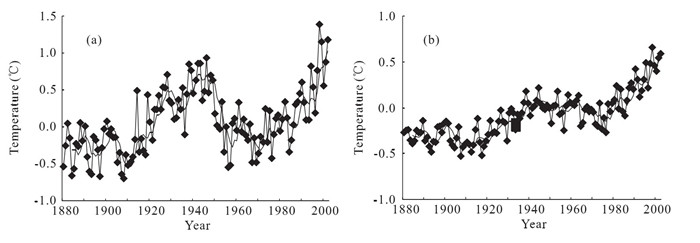
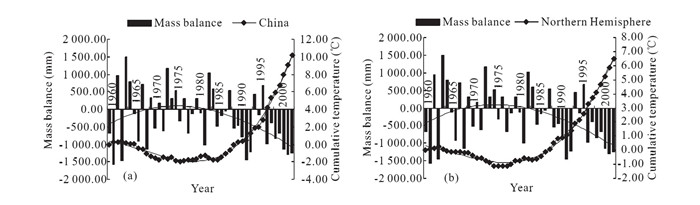
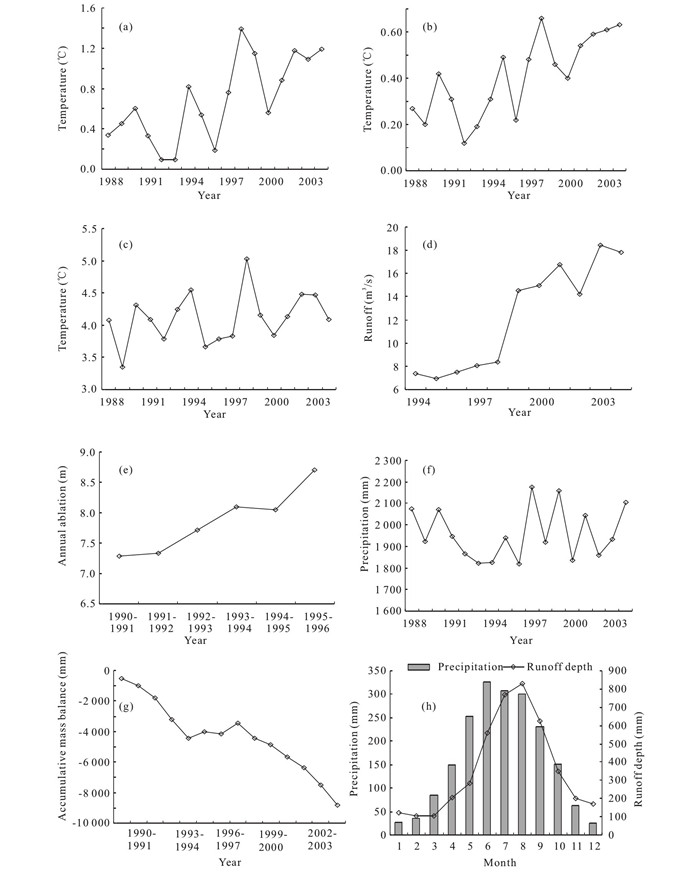
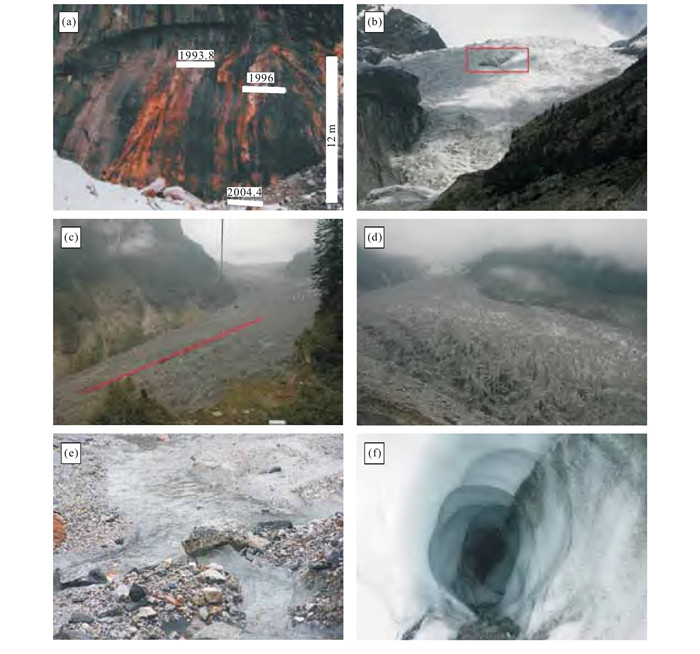
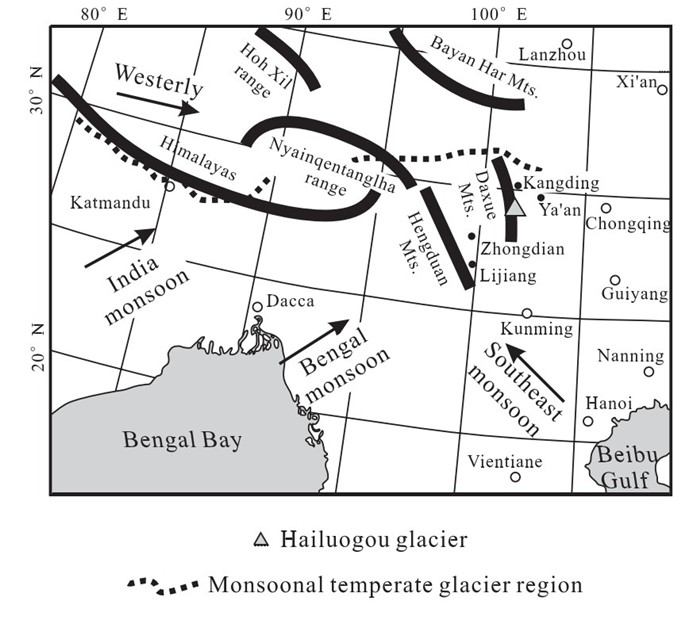
  • Great change, associated with global warming, has occurred at the Hailuogou (海螺沟) glacier, Mt. Gongga (贡嘎), China, since the early 20th century. Various data indicate that the glacier has retreated 1 822 m in the past 106 years, with an annual mean retreat of 17.2 m, and the front elevation has risen by 300 m since 1823. Comparison of glacier variations and temperature fluctuations in China and the Northern Hemisphere, over the last 100 years, indicates that glacier retreat stages occurred during the warm phase, and vice versa. Mass balance records during 1959/60-2003/04 have shown that the glacier has suffered a constant mass loss of snow and ice. The accumulated mass balance, -10.83 m water equivalent, indicates an annual mean value of -0.24 m water equivalent. The correlation between the mass balance and temperature is significant, which also indicates that climatewarming is the crucial cause of glacier loss. Local hydrological and climatic data demonstrate that runoff from the glacier has been increasing both seasonally and annually. The correlation analysis and trend analysis indicate that ice and snow melted water is the main cause of an increase in the runoff. As the climate has become warmer, changes in the glacier surface morphology have obviously occurred. These include a decrease in glacier thickness, enlargement of glacial caves, and reduction of the size of clefts on the glacier surface. The ablation period has lengthened and the ablation area has expanded. A variety offactors thus provide evidence that the Hailuogou glacier has suffered a rapid loss of snow and ice as a result of climatic warming.


  • Global warming has brought about many severe environmental problems, including a rise in sea level and increased natural hazards.The report of IPCC (2007) indicated that global warming has had an accelerative tendency since 1910, and the global annual mean temperature has increased by 0.74℃from 1906 to 2005, and global annual mean temperature will increase by 1.1–6.4℃in 2100.The temperature in China has increased by 0.4–0.5℃from 1860 to 2005, and the rise in winter temperature has been apparent since 1951.Nineteen"green winters"have been experienced since 1986/87 (Chen et al., 2006) in China.In response to global warming, glaciers on the Tibetan plateau have been retreating since the early 20th century, and the change has begun to accelerate since 1980s (Ye et al, 2008; Pu and Yao, 2004; Shen, 2004; Yao et al., 2004; He et al., 2003; Shi, 2001; Shi and Liu, 2000; Shi et al., 2000; Liu and Kang, 1999; Zhang and Yao, 1998).From the previous studies of mass balance, equilibrium-line altitude, accumulation area ratio, and ablation volume of 300 mountain glaciers from 1961 to 1998, Dyurgerov (2003) has concluded that since the 1980s, glacier area and volume have decreased at an increasing rate and the speed of the water cycle has increased as a result of global warming.The retreat extent of worldwide glaciers from 1884 to 1978 has been proportional to the degree of global warming (0.66±0.1) K in the same period, and Oerlemans and Fortuin (1992) and Oerlemans (1994) estimated that the total area of the world's mountain glaciers would decrease by 1/3–2/3 in the 21st century.

    Monsoonal temperate glaciers in China are located in the region of the southeastern part of the Tibetan plateau, including Mt.Hengduan and Mt.Daxue, the eastern part of the Himalayas, and the eastern segments of the Nyainqentanglha range (Fig. 1).This region is characterized by high precipitation (1 000–3 000 mm) in the glacier-covered area, a low snowline (4 200–5 200 m), which is 800–1 200 m lower than that of the polar glaciers on the western Tibetan plateau, and relatively high temperatures (equilibrium line mean annual value-6℃, summer value-1–5℃).According to the Glacier Inventory of China, there are 8 607 monsoonal temperate glaciers in China, covering an area of 13 200 km2, which is18.6%of the total glacier number and 22.2%of the total glacier area.Monsoonal temperate glaciers are the most sensitive indictors to climatic change, with a shorter lag time in response to climatic change (He et al., 2003).Here, taking the Hailuogou glacier on Mt Gongga as an example, the authors explored the extensive changes of glacier retreat, mass balance runoff, and surface morphology to provide the evidence of global warming in China's monsoonal temperate glacier region.

    Figure  1.  Simplified map showing the location of the Hailuogou glacier.

    The Hailuogou glacier, a typical monsoonal temperate glacier, is located on the eastern side of Mt Gongga, one of the easternmost glacial areas in China (Fig. 1).It has a total area of about 25 km2, and is about 13 km long.The regional climate is dominated by the southwest (India and Bengal monsoons) and southeast monsoons in the wet season, and by the westerly and the Qinghai-Tibet monsoon in the dry season.The total annual precipitation at the glacier tongue area (3 000 m) is about 1 960 mm, with a maximum between June and September, and the annual mean air temperature is 4℃.At the ELA (equirbrium-line altitude) (4 900 m), the annual mean air temperature is about-4.4℃and the annual precipitation is 3 000 mm (Su and Liu, 2001).The glacier flows eastwards as it descends from 7 556 m to3 000 m.Four distinct zones can be recognized: the accumulation zone (from 7 556 m to 4 980 m), a large icefall zone (from 4 980 m to 3 850 m), a zone of glacier-arch (from 3 850 m to 3 480 m) and a debris-covered zone (from 3 480 m to 3 000 m).

    Data concerning glacier variations are based on field surveys in 1936, 1966, 1982, 1989, 1994, and2006.These references provide the glacier front location and the retreat distance.In addition, previous research (Duan et al., 2007; He et al., 2003; Zhang and Su, 2001; Li and Su, 1996; Heim, 1936), topographic map of 1982 have also been employed to reconstruct the variation processes of the Hailuogou and Hailuogou No.1 glaciers, which had formerly been connected to each other, and to inspect the record of the previous field surveys.The resultant contrast among various references indicates that the data, which have reconstructed the glacier front elevation and variation processes, are reliable.Mass balance data from 1959 to 2003 have been derived from meteorological and hydrological data using the method of Shi et al. (2000).The meteorological data for 1988–2004 have been collected at the Alpine Meteorological Station located at 3 000 m a.s.l..The hydrological data for 1994–2004 have been collected at the Glacier Hydrological Station located at 2 920 m a.s.l., about 1 km downstream of the glacier terminus.Glacier tongue (3 000 m–3 600 m) ablation data for1990–1996 have been provided by the Ecological System and Environment Research Station, Chengdu Institute of Mountain Hazards and Environment, Chinese Academy of Sciences (CAS).Climatic data for China and the Northern Hemisphere have been obtained from the previous study (Wang et al., 2002; Wang and Ye, 1998).

    Mass balance data for the Hailuogou basin during1959/60–1992/93 were calculated from the meteorological and hydrological data by Xie et al. (1995) using the glacial hydrological mass balance method and the data for 1993/94–2003/04 were reconstructed using the same method (this study).The hydrological mass balance method was widely used to reconstruct the mass balance where no continuous long-term glacier observation existed (Shi et al., 2000).The mass balance was calculated from Bn= (P-R-E)/K, where Bn is the mass balance (mm); P is the precipitation (mm); R is the runoff (mm); E is the evaporation (mm), and K is the ratio of the total basin area and the glacier-covered area, and the value in the Hailuogou basin was 2.7.

    Data of glacier length are calculated from

    (1)

    (2)

    where L is the glacier length (m); L1 is the glacier length in 1988, recorded by Chinese glacier inventory (m); D is the length of the glacier front change (m) (if glacier retreat is before 1988, D is plus, and vice versa; if glacier advance is after 1988, D is plus, and vice versa); function (1) was used to calculate the glacier length before 1988, and function (2) was used for after1988.

    The method of polynomial fitting was used to analyze the change in the trend of temperature and mass balance.Trends were analyzed by means of linear regression of the long-term climatic and glacier data, and correlation analysis of meteorological, hydrological, and mass balance data was used to quantify the relationship between glacier change and climate.

    As shown in Table 1, a steady retreat of the Hailuogou glacier has been observed since the early20th century.The variation process of the front elevation has been reconstructed with the help of the topographic map and the front elevation data.The front elevation of the Hailuogou glacier has risen by300 m since 1823 (Fig. 2).It is obvious that the elevation rise has accelerated since 1936, because it has risen by 150 m in the past 113 years from 1823 to1936, whereas, it has risen by the same height in 70years, during 1936–2006.As Fig. 3 indicates, the glacier was in a relatively stationary or advancing stage from the early 20th century to the 1930s: the distance between the glacier front and the youngest terminal moraines that formed in the Little Ice Age was only 200 m when Heim (1936) made his observations in 1930.At that time, the front of Hailuogou glacier No.1 joined that of the Hailuogou glacier (Heim, 1936).A comparison of the 1966satellite imagery of Mt.Gongga and the elevation of the Hailuogou glacier front determined by Heim in1930, indicated that both the Hailuogou glacier and Hailuogou glacier No.1 were in recession from the1930s to the 1960s (Zhang and Su, 2001).During that period, the Hailuogou glacier retreated more than1 150 m and the front elevation rose by 30–40 m.Hailuogou glacier No.1 retreated 800 m, and the front of the Hailuogou glacier No.1 was separated from that of the Hailuogou glacier since the 1960s.

    Table  1.  Variations of the principal glaciers in the Hailuogou basin since the early 20th century
     | Show Table
    DownLoad: CSV
    Figure  2.  Sketch map showing the variation of glacier front since 1823.
    Figure  3.  Diagrams showing changes of length of the Hailuogou glacier and Hailuogou glacier No.1.

    From the beginning of the 1960s to the mid1980s, the Hailuogou glaciers were in a relativelystationary or slowly-retreating state, whereas, the Hailuogou glacier No.1 maintained a relativelystationary terminus position.The Hailuogou glacier retreated 200 m with an annual retreat of 11.8 m and its front had risen by 20 m.Since the 1980s, the glacier had undergone intensive recession in response to rapid climatic warming.The Hailuogou glacier retreated 147.8 m during 1983–1989 and 274 m between 1990 and 2004.Field investigations in 2006revealed a further retreat of 50 m.Since 1983, the elevation of the glacier front had risen by 60 m as it had retreated to a total of 471 m, with an annual retreat of 21.4 m (Table 1).The Hailuogou glacier No.1 retreated 250–300 m from 1981 to 1990, and is retreating rapidly at present.

    The temperature has increased in a variable manner in both China and the Northern Hemisphere (Fig. 4).At least four main phases (two cold and two warm) are distinguishable.During the first cold phase, from the end of the 19th century to the 1930s, the Hailuogou glacier was stationary or advancing.In the second, from the beginning of the 1970s to the mid1980s, they were in relatively-stationary state or their rate of recession was decreasing.In the first warm phase, from the 1930s to the end of the 1960s, the Hailuogou glacier retreated more than 1 150 m, with an annual retreat of 31.1 m, and the altitude of its front rose 30–40 m, whereas, the Hailuogou glacier No.1retreated 800 m with an annual retreat of 21.6 m, and its front separated from that of the Hailuogou glacier.During the second warm phase, from the mid 1980s to present, the glaciers have been retreating quickly in response to rapid climatic warming: the Hailuogou glacier retreated 471 m between 1983 and 2006, an annual mean value of 21.4 m, and the altitude of its front had risen by 60 m from 1983 to 2006.The altitude of the front of the Hailuogou glacier No.1 had risen by 280 m from 1994 to 2006.In summary, the glaciers retreated during the warm phase, and vice versa.

    Figure  4.  Diagrams showing the variations of annual mean temperature in China (a) and the Northern Hemisphere (b) over the past 100 years.

    The Hailuogou glacier has been characterized by mass loss of snow and ice during the last 45 years.The accumulated mass balance from 1959/60 to2003/04 was-10.83 m water equivalent, with an annual average value of-0.24 m water equivalent.The fluctuation of mass balance was also distinguishable (Fig. 5).In the first phase between 1959/60 and1970/71, the mean annual balance was-0.18 m·a-1.In the second phase between 1971/72 and 1984/85, it was 0.11 m·a-1, and in the third phase between1985/86 and 2003/04, it was-0.54 m·a-1.The respective accumulated mass balances were-2.15 m, 1.53 m, and-10.21 m water equivalent.It was obvious that the negative phase was during the warm phase, and vice versa (Fig. 5).The value in the intensively negative phase between 1985/86 and 2003/04accounted for 94.3%of the total accumulative value, which responded to accelerative climate warming after the 1980s.

    Figure  5.  Diagrams showing the relationships between mass balance variation in Hailuogou basin and the annual mean temperature variation in China (a) and in the Northern Hemisphere (b).

    The obvious inverse variation between mass balance and the temperature in China and the Northern Hemisphere over the last 45 years indicates that intensified melting is principally responsible for the negative mass balance (Fig. 5).

    This confirmed that glacier loss was the result of global warming, and was caused by a higher ablation rate and longer ablation period in the negative phase.In addition, as temperatures rose, the ELA also increased, causing enlargement of the ablation area.The retreat slowed down or glacier front positions became stationary during the positive phase because temperatures were low.As Fig. 6 shows, the negative correlation between mass balance and temperature was significant, which also indicates that climate warming was the crucial cause of glacial loss.The correlation between mass balance and the Northern Hemisphere temperatures was higher than that in China.Two reasons could account for this.The response of mass balance variations to large-scale climatic changes was greater than the response to small-scale climatic changes, and moreso, the climatic warming had been greater in the Northern Hemisphere than in China (Wang and Ye, 1998).

    Figure  6.  Statistical diagrams showing the relationships between mass balance variation and the annual mean temperature variation of China (a) and the Northern Hemisphere (b).

    The temperature in China, the Northern Hemisphere, and the Hailuogou basin, has increased since 1988 (Figs. 7a, 7b, 7c).The annual mean value in 1997–2004 was 0.27℃higher than that in1988–1996 in the Hailuogou basin.The temperature rise has resulted in an obvious increase of glacial runoff in the Hailuogou basin: the annual mean runoff in 1997–2004 was 6.88 m3·s-1 higher than in1994–1996 (Fig. 7d).Instrumental climatic data, ice core signals, and tree ring indices indicate that the temperature in China's monsoonal temperate glacier region has increased in a variable manner during the20th century, and the temperature rise has accelerated since the 1980s (He et al., 2003).Glacier ablation is heavy (Fig. 7e), and the mean ablation rate in the glacier tongue has been 7.86 m·a-1 (7.20 m water equivalent, equal to 3.7 years'total precipitation in the area), but the increase of precipitation is very little from 1988 to 2004 (Fig. 7f), which reflects that the rise in runoff is the result of the heavy ablation, with increasing temperature.As a result of the intensification of warming in the 1980s, in China's monsoonal temperate glacier region, a relatively small temperature increase will lead to a nonlinear increase of ablation.

    Figure  7.  Diagrams showing the mean annual temperature in China since 1988 (a), mean annual temperature in the Northern Hemisphere since 1988 (b), mean annual temperature at the Hailuogou meteorological station (3 000 m) since 1988 (c), mean annual runoff from the Hailuogou basin (d), ablation of the tongue of the Hailuogou glacier (e), variation of precipitation in the Hailuuogou basin since 1988 (f), variation of accumulative mass balance 1990/1991–2002/2003 (g), and seasonal variations of precipitation and runoff at the Hailuogou basin (h).

    The feedings in the Hailuogou basin are precipitation, groundwater, and melt water.Groundwater is often considered to be a relatively stable component, fluctuating only slightly in the long-term, according to previous study (Li and Su, 1996).In considering whether precipitation or melt water has been the main contribution to the increase of runoff in recent years, five facts need to be taken into account. (1) The mean winter temperature in the Hailuogou basin has increased by 0.69℃from1994–1998 to 1999–2004 and the mean winter runoff in 1999–2004 has been 2.74 m3·s-1 higher than that of the former period, but the mean winter precipitation (87.7 mm) accounts for only 4%of the mean annual precipitation.Thus the increased winter runoff results from melt water. (2) The statistical relationship between runoff and the area's summer temperature (R=0.90, P < 0.000 1) is more significant than that between the runoff and summer precipitation (R=0.80, P < 0.000 1). (3) The annual mean precipitation has increased by only 53 mm from 1994–1998 to1999–2004, with a slower ratio than temperature (Fig. 7f), whereas, the runoff depth has increased by 2 234mm, showing that the melt water has made a greater contribution to the runoff increase, rather than an increase in precipitation. (4) The annual mean ablation (7.20 m water equivalent) at glacier tongue area is3.67 times higher than the annual mean precipitation (1 960 mm). (5) The statistical relationship between runoff and mass balance in 1994–2004 is an inverse correlation (R=-0.82, P < 0.000 1) (Figs. 7d, 7f), indicating that increased melt water is the main factor responsible for increased runoff.

    The peak value of runoff occurs in August, two months later than the June peak of precipitation (Fig 7h).The runoff depth value in October is 162 mm higher than that in April, although precipitation in October and April is equal.The runoff depth is higher than the corresponding monthly precipitation throughout the year.The Hailuogou basin is small, with a good deal of bare rock, in a mountainous region, and the hydrological station is located at the front of the glacier.The cause of hysteresis between runoff and precipitation is the ice-snow melted water rather than precipitation, as ice and snow can maintain runoff after a long period of ablation.Thus, it is the variation of the ice-snow melt water that is responsible for the seasonal variation of runoff in the Hailuogou basin, and it is also clear that the ice-snow melt water is the main source of water issuing from the Hailuogou basin.

    The thickness of the glacier tongue had decreased by 12 m from 1993 to 2004, owing to intensified ablation (Fig. 8a), reconfirming the intensive ablation.High ablation in 2006 resulted in the development of five"glacier-holes"in the icefall (Fig. 8b).According to the local people, there were some"glacier-holes"before 2006, one"glacier-hole"formed in 1993, three in 2000, and four in 2004.This was in accordance with the rise in the glacier's equilibrium-line elevation and the increase in the ablation rate.The ablation period would become longer and ablation rate would increase with the rise of the ELA in the icefall events, hence, ice would fall in summer and formulate"glacier-holes".In 2006, there was a large crevasse, 300 m long and 20 m wide, in the center of the glacier tongue (Fig. 8c).This was caused by intense ablation at the glacier surface and a substantial outflow of englacial meltwater, and englacial water channels were widely distributed according to a previous study (Lüand Zhong, 1996).Small glacier kettle holes and clefts in the ice were widely distributed along the front of the glacier as a result of ablation.With the rise of the equilibrium line, the zone of clefts became larger, although it decreased in size at low altitudes.Before1980, many"glacier arches"were visible (personal communication with Zhang Wenjing), but since then, they have gradually disappeared and evolved into clefts (Fig. 8d).Surface rivers were also widely distributed in the Hailuogou glacier tongue area on account of heavy ablation (Fig. 8e).There was also an englacial water channel in the glacier tongue area owing to washing out by surface runoff (Fig. 8f).

    Figure  8.  Photographs showing changes in surface level of the Hailuogou glacier tongue (provided by Zhang Wenjing, 2004) (a), a"glacier-hole"in the large icefall of the Hailuogou glacier (b), a large cleft in the tongue of the Hailuogou glacier (2006)(c), glacier arches evolving into clefts at the Hailuogou glacier (2006)(d), surface runoff in the Hailuogou glacier tongue area (e), and englacial water channels in the Hailuogou glacier tongue area (f).

    Four principal conclusions can be drawn from the data analyzed here.

    (1) Warming during the 20th century has caused a general retreat of the glaciers on Mt.Gongga, as manifested by the retreat of the Hailuogou glacier.The glacier has retreated 1.822 km in the past 106years, at a mean rate of 17.2 m·a-1.Glacier retreat stages have occurred during the warm phase of China and the Northern Hemisphere in the last 100 years, and vice versa.

    (2) Climate warming has resulted in a negative trend of the Hailuogou glacier's mass balance, with constant mass loss over the past 45 years.The accumulated mass balance from 1959/60 to 2003/04is-10.83 m water equivalent, with an annual average of-0.24 m water equivalent.The negative correlation between mass balance and temperature is significant, which indicates that climate warming is the crucial cause of glacier mass loss.

    (3) The annual mean runoff records show a strong positive trend and remarkable similarities to the climatic data.High ablation and increased runoff fed by melting snow and ice have increased in recent years, with seasonal and inter-annual variations.

    (4) Climatic warming and an increase of equilibrium line altitude have resulted in changes in glacier surface morphology, such as, thinning of the glacier, enlargement of glacial caves.The ablation area of the Hailuogou glacier is increasing and the ablation period is lengthening.

    ACKNOWLEDGMENTS: Thanks to Professor Theakstone W. H. from School of Environment and Development, University of Manchester, Manchester M13 9PL, England for grammar modification, and also to Professor Xie Zichu from Hunan Normal University for method of mass balance reconstruction.
  • Chen, Y. Y., Li, X. Y., Qin, D. H., et al., 2006. Climate and Environment in China. Science Press, Beijing. 15–36 (in Chinese).
    Duan, Q. F., Zhang, K., X., Wang, J. X., 2007. Sporopollen Assemblage from the Totohe Formation and Its Stratigraphic Significance in the Tanggula Mountains, Northern Tibet. Earth Science—Journal of China University of Geosciences, 32 (5): 629–637 (in Chinese with English Abstract).
    Dyurgerov, M., 2003. Mountain and Subpolar Glaciers Show an Increase in Sensitivity to Climate Warming and Intensification of the Water Cycle. Journal of Hydrology, 282 (1–4): 164–176.
    He, Y. Q., Zhang, Z. L., Theakstone, W. H., et al., 2003. Changing Features of the Climate and Glaciers in China's Monsoonal Temperate Glacier Region. Journal of Geophysical Research, 108 (D17): 4530–4536. doi: 10.1029/2002JD003365
    Heim, A., 1936. The Glaciation and Solifluction of Minya Gongka. Geographical Journal, 87: 444–454. doi: 10.2307/1785645
    IPCC Report, 2007. Climate Change 2007: The Physical Science Basis. Report of Working Group of the Intergovernmental Panel on Climate Change. CambridgeUniversity Press, Cambridge. 16–72.
    Lajindela, P., Q., 2007. Climate Change 2007: Impacts, Adaptation, and Vulnerability: Summary for Policymakers. In: Report of Working Group II of the Intergovernmental Panel on Climate Change. Cambridge University Press, Cambridge. 338–352.
    Li, J. J., Su, Z., 1996. Glaciers of Mt. Hengduan. Science Press, Beijing. 125–141 (in Chinese).
    Liu, C. H., Kang, E. S., 1999. The Research about Glaciers Change and Runoff Effect in the Northwestern Region of China. Science in China (Series D), 29 (Suppl. 1): 55–62 (in Chinese).
    Lü, R. R., Zhong, X. H., 1996. Block and Burst of the Water Channels inside Hailuogou Glacier. Journal of Glaciology and Geocryology, 18 (Suppl. ): 257–262 (in Chinese with English Abstract).
    Oerlemans, J., 1994. Quantifying Global Warming from the Retreat of Glaciers. Science, 264: 243–245. doi: 10.1126/science.264.5156.243
    Oerlemans, J., Fortuin, J. P. E., 1992. Sensitivity of Glaciers and Small Ice Caps to Greenhouse Warming. Science, 258: 115–118. doi: 10.1126/science.258.5079.115
    Pu, J. C., 1994. Glacier Inventory of China (the Changjiang River Drainage Basin). Gansu Culture Press, Lanzhou. 117–129 (in Chinese).
    Pu, J. C., Yao, T. D., 2004. Fluctuations of the Glaciers on the Qinghai-Tibetan Plateau during the Past Century. Journal of Glaciology and Geocryology, 5 (26): 517–522 (in Chinese with English Abstract).
    Shen, Y. P., 2004. An Overview of Glaciers, Glacier Retreating and Its Impact in the Tibetan Plateau. In: A Consultative Report for Climate Impact and Adaptation Project in the Tibetan Plateau Submitted to the World Wide Fund for Nature—China Programme Office (WWF-China). 50.
    Shi, Y. F., 2001. Estimation of the Water Resources Affected by Climatic Warming and Glacier Shrink Age before 2050 in West China. Journal of Glaciology and Geocryology, 23 (4): 333–341 (in Chinese with English Abstract).
    Shi, Y. F., Liu, S. Y., 2000. Estimation of the Response ofGlaciers in China to the Global Warming in the 21st Century. Chinese Science Bulletin, 45 (4): 668–672.
    Shi, Y. F., Huang, M. H., Yao, T. D., 2000. Glaciers and Their Environments in China—The Present, Past and Future. Science Press, Beijing. 94–101 (in Chinese).
    Su, Z., Liu, S. Y., 2001. Glacier Changes on the Hengduan Mountain and Their Response to Climate. In: Zhong, X. H., ed., The Environment and Ecosystem in the Eastern Edge of the Qinghai-Xizang Plateau. Sichuan University Press, Chengdu. 102–109 (in Chinese).
    Wang, S. W., Ye, J. L., 1998. Foundation of Temperature Change of China in the Last 100 Years. Quarterly Journal of Applied Meteorology, 9 (4): 392–400 (in Chinese with English Abstract).
    Wang, S. W., Xie, Z. H., Chai, J. N., 2002. A Study of the Global Average Temperature in the Last 1 000 Years. Progress in Natural Science, 12 (11): 1145–1149 (in Chinese with English Abstract).
    Xie, Z. C., Su, Z., Cao, Z. T., 1995. Water and Mass Balance in the Gongga Mountain. In: Researches on Evolution, Environment Change and Ecosystems of Tibet Plateau. Science Press, Beijing. 340–346 (in Chinese).
    Yao, T. D., Liu, S. Y., Pu, J. C., 2004. Recent Glaciers Retreating in High Asia and Their Impact on the Water Resources of Northwest China. Science in China (Series D), 34 (6): 535–543.
    Ye, Q. H., Yao, T. D., Chen, F., et al., 2008. Response of Glacier and Lake Covariations to Climate Change in Mapam Yumco Basin on Tibetan Plateau. Journal of China University of Geosciences, 19 (2): 135–145. doi: 10.1016/S1002-0705(08)60032-1
    Zhang, W. J., Su, Z., 2001. Changes Features of Hailuogou Glacier. In: Zhong, X. H., ed., Environment and Ecosystem in the Eastern Edge of Qinghai-Xizang Plateau. Sichuan University Press, Chengdu. 113–120 (in Chinese).
    Zhang, Y. S., Yao, T. D., 1998. The Response of Continental-Type Glaciers to Climate Change in China. Journal of Glaciology and Geocryology, 20 (1): 3–8 (in Chinese with English Abstract).
  • Relative Articles

    [1]Yu Lai, Bao Zhang, Yibin Yao, Sulan Liu, Binhong Xie, Zilong Li, Yunlong Wu. The response of terrestrial water storage change to El Niño-Southern Oscillation in global 28 hot areas revealed by GRACE[J]. Journal of Earth Science. doi: 10.1007/s12583-025-0226-1
    [2]Jian Yang, Bingfu Yao, Min Cai, Mingxian Han, Zenghui Wu, Pingping Zhang, Haiyi Xiao, Jibin Han, Xiying Zhang, Hongchen Jiang. Salinity change overrides nitrogen increase in affecting microbial abundance, diversity, community composition and organic carbon mineralization in saline lakes[J]. Journal of Earth Science. doi: 10.1007/s12583-024-0139-4
    [3]Xiaoxia Lü, Gerard J. M. Versteegh, Jinming Song, Xuegang Li, Huamao Yuan, Ning Li. Geochemistry of Middle Holocene sediments from south Yellow Sea: Implications to provenance and climate change[J]. Journal of Earth Science, 2016, 27(5): 751-762. doi: 10.1007/s12583-015-0577-0
    [4]Ying Zhang, Jincui Wang, Jihong Jing, Jichao Sun. Response of Groundwater to Climate Change under Extreme Climate Conditions in North China Plain[J]. Journal of Earth Science, 2014, 25(3): 612-618. doi: 10.1007/s12583-014-0443-5
    [5]Puyu Wang, Zhongqin Li, Wenbin Wang, Huilin Li, Feiteng Wang. Glacier Volume Calculation from Ice-Thickness Data for Mountain Glaciers—A Case Study of Glacier No. 4 of Sigong River over Mt. Bogda, Eastern Tianshan, Central Asia[J]. Journal of Earth Science, 2014, 25(2): 371-378. doi: 10.1007/s12583-014-0427-5
    [6]Shijin WANG, Jiankuo DU, Yuanqing HE. Spatial-temporal characteristics of a temperate-glacier's active-layer temperature and its responses to climate change: A case study of Baishui Glacier No. 1, southeastern Tibetan Plateau[J]. Journal of Earth Science, 2014, 25(4): 727-734. doi: 10.1007/s12583-014-0460-4
    [7]Ling Wang, Bingwei Tian, Alaa Masoud, Katsuaki Koike. Relationship between Remotely Sensed Vegetation Change and Fracture Zones Induced by the 2008 Wenchuan Earthquake, China[J]. Journal of Earth Science, 2013, 24(2): 282-296. doi: 10.1007/s12583-013-0329-y
    [8]Zhen Wu; Shiyin Liu; Shiqiang Zhang; Donghui Shangguan. Accelerated Thinning of Hei Valley No. 8 Glacier in the Tianshan Mountains, China[J]. Journal of Earth Science, 2013, 24(6). doi: 10.1007/s12583-013-0382-6
    [9]Kaiming Li, Huilin Li, Lin Wang, Wenyu Gao. On the Relationship between Local Topography and Small Glacier Change under Climatic Warming on Mt. Bogda, Eastern Tian Shan, China[J]. Journal of Earth Science, 2011, 22(4): 515-527. doi: 10.1007/s12583-011-0204-7
    [10]Qi Feng, Yiming Gong, Robert Riding. Stage Change of Middle–Late Devonian Calcified Algae and Cyanobacteria in South China and Its Significance[J]. Journal of Earth Science, 2010, 21(S1): 79-81. doi: 10.1007/s12583-010-0174-1
    [11]Christoph Seeber, Heike Hartmann, Wei Xiang, Lorenz King. Land Use Change and Causes in the Xiangxi Catchment, Three Gorges Area Derived from Multispectral Data[J]. Journal of Earth Science, 2010, 21(6): 846-855. doi: 10.1007/s12583-010-0136-7
    [12]Wentao Yang, Yuansheng Du, Min Wang, Bin Hu. Trace Fossils Indicative of Paleoclimatic Change in Triassic in Jiyuan Region, Henan Province, China[J]. Journal of Earth Science, 2010, 21(S1): 222-224. doi: 10.1007/s12583-010-0218-6
    [13]Yongqiang Zong, Zhanghua Wang, Zhongyuan Chen, James B Innes. Environmental change linked to changes in the Neolithic agricultural development in the east coast of China[J]. Journal of Earth Science, 2010, 21(S1): 284-285. doi: 10.1007/s12583-010-0237-3
    [14]Steve Kershaw, Sylvie Crasquin. Microbialites and Environmental Change at the Permian-Triassic Boundary: An Overview[J]. Journal of Earth Science, 2010, 21(S1): 143-144. doi: 10.1007/s12583-010-0193-y
    [15]Ningning Zhang, Yuanqing He, Wilfred H Theakstone, Hongxi Pang. Chemical Composition of Aerosol and Fresh Snow and Tourism Influences at Baishui Glacier No. 1 from Mt. Yulong, Southeastern Tibetan Plateau[J]. Journal of Earth Science, 2010, 21(2): 199-209. doi: 10.1007/s12583-010-0018-z
    [16]Yuanqing He, Tao Pu, Zongxing Li, Guofeng Zhu, Shijin Wang, Ningning Zhang, Shuxin Wang, Huijuan Xin, Wilfred H Theakstone, Jiankuo Du. Climate Change and Its Effect on Annual Runoff in Lijiang Basin-Mt. Yulong Region, China[J]. Journal of Earth Science, 2010, 21(2): 137-147. doi: 10.1007/s12583-010-0012-5
    [17]Yuanchun ZHANG, Huayao ZOU, Cunwu WANG, Pingping LI. Reserve and Pressure Change of Paleo-oil Reservoir in Puguang Area, Sichuan Basin[J]. Journal of Earth Science, 2008, 19(6): 726-738.
    [18]Qinghua Ye, Tandong Yao, Feng Chen, Shichang Kang, Xueqin Zhang, Yi Wang. Response of Glacier and Lake Covariations to Climate Change in Mapam Yumco Basin on Tibetan Plateau during 1974-2003[J]. Journal of Earth Science, 2008, 19(2): 135-145.
    [19]Zhizhong ZHAO, Fuchu JIANG, Xihao WU, Shubing WANG, Yansong QIAO, Ke LIU, Sumin WANG. Sanmenxia Loess and Paleoenvironmental Change[J]. Journal of Earth Science, 2006, 17(4): 283-290.
    [20]Keyan Xiao, Xiaohua Zhang, Zhenghui Chen, Yusheng Zhu, Guoyao Song. GIS—A Tool to Change Traditional Way of Mineral Resources Appraisal[J]. Journal of Earth Science, 2000, 11(2): 138-140.
  • Created with Highcharts 5.0.7Amount of accessChart context menuAbstract Views, HTML Views, PDF Downloads StatisticsAbstract ViewsHTML ViewsPDF Downloads2024-052024-062024-072024-082024-092024-102024-112024-122025-012025-022025-032025-0402468
    Created with Highcharts 5.0.7Chart context menuAccess Class DistributionFULLTEXT: 47.2 %FULLTEXT: 47.2 %META: 52.3 %META: 52.3 %PDF: 0.4 %PDF: 0.4 %FULLTEXTMETAPDF
    Created with Highcharts 5.0.7Chart context menuAccess Area Distribution其他: 2.2 %其他: 2.2 %Austria: 0.4 %Austria: 0.4 %China: 66.7 %China: 66.7 %Germany: 0.4 %Germany: 0.4 %Reserved: 1.3 %Reserved: 1.3 %Russian Federation: 4.9 %Russian Federation: 4.9 %Thailand: 0.7 %Thailand: 0.7 %United States: 23.3 %United States: 23.3 %其他AustriaChinaGermanyReservedRussian FederationThailandUnited States

Catalog

    通讯作者: 陈斌, bchen63@163.com
    • 1. 

      沈阳化工大学材料科学与工程学院 沈阳 110142

    1. 本站搜索
    2. 百度学术搜索
    3. 万方数据库搜索
    4. CNKI搜索

    Figures(8)  / Tables(1)

    Article Metrics

    Article views(781) PDF downloads(29) Cited by()
    Proportional views
    Related

    /

    DownLoad:  Full-Size Img  PowerPoint
    Return
    Return