Loading [MathJax]/jax/output/SVG/fonts/TeX/fontdata.js
Advanced Search

Indexed by SCI、CA、РЖ、PA、CSA、ZR、etc .

Fariba Padyar, Mohammad Rahgoshay, Alexander Tarantola, Marie-Camille Caumon, Seyed Mohammad Pourmoafi. High ƒH2-ƒS2 Conditions Associated with Sphalerite in Latala Epithermal Base and Precious Metal Deposit, Central Iran: Implications for the Composition and Genesis Conditions of Sphalerite. Journal of Earth Science, 2020, 31(3): 523-535. doi: 10.1007/s12583-019-1023-5
Citation: Fariba Padyar, Mohammad Rahgoshay, Alexander Tarantola, Marie-Camille Caumon, Seyed Mohammad Pourmoafi. High ƒH2S2 Conditions Associated with Sphalerite in Latala Epithermal Base and Precious Metal Deposit, Central Iran: Implications for the Composition and Genesis Conditions of Sphalerite. Journal of Earth Science, 2020, 31(3): 523-535. doi: 10.1007/s12583-019-1023-5

High ƒH2S2 Conditions Associated with Sphalerite in Latala Epithermal Base and Precious Metal Deposit, Central Iran: Implications for the Composition and Genesis Conditions of Sphalerite

doi: 10.1007/s12583-019-1023-5
More Information
  • Corresponding author: Fariba Padyar, ORCID:0000-0002-8236-9404.E-mail:padyar@geologist.com
  • Received Date: 20 Dec 2018
  • Accepted Date: 02 Jun 2019
  • Publish Date: 01 Jun 2020
  • This paper presents the properties of fluid inclusions found in sphalerite from Latala epithermal base and precious metal deposit (Central Iran), which is hosted in Cenozoic volcanic- sedimentary host-rocks. The Latala Deposit represents an example of vein type, base metal deposits in the Miduk porphyry copper deposits (PCDs) in southern Urumieh-Dokhtar magmatic belt (UDMB). Mineralization in Latala epithermal base and precious metal vein type formed in 3 stages and sphalerite-quartz veins occur in stages 2 and 3. Stage 2 quartz-sphalerite veins are associated with chalcopyrite and zoned sphalerite, along with quartz+hematite, and Stage 3 quartz-sphalerite veins contain galena+sphalerite+ chalcopyrite and quartz with overgrowth of calcite. Mineralization in Stage 3 occurs as replacement bodies and contains Fe-poor sphalerite without zoning in the outer parts of the deposit. This paper focuses on fluid inclusions in veins bearing sphalerite and quartz. The fluid inclusion homogenization temperatures and salinity in sphalerite (some with typical zoning) range from 144 to 285 ℃ and from 0.2 wt.% to 7.6 wt.% NaCl eq. Sphalerite and fluid inclusions of the Latala base and precious metal deposit formed from relatively low-T and low-salinity solutions. Raman spectroscopy analyses indicate a high percentage of CO2 in the gas phase of fluid inclusions in Fe-poor sphalerites, as expected with melting temperature for CO2 of -56.6 ℃, and significant amounts of H2. Lack of reduced carbon species (methane and lighter hydrocarbons) was confirmed in the petrographic study using UV light and Raman spectroscopy. High amounts of H2 in fluid inclusions of Fe-poor sphalerite can be the result of different intensities of alteration and diffusion processes. The common occurrences of CO2 in fluid inclusions have originated from magma degassing and dissolution of carbonates. The δ34S values for sulfide minerals in galena of sphalerite bearing veins vary between -9.8‰ and -1.0‰, and the δ34S values calculated for H2S are between -7.1‰ and +0.6‰. These values correspond to magmatic sulfur whit possible interaction with wall rocks. Magmatic fluids were successively diluted during cooling and continuous ascent. Secondary boiling would lead to variable amounts of potassic or prophylactic alteration and the hydrogen diffusion into the inclusions hosted in sphalerite of Latala.


  • Vein type deposits are formed by fluids of various origins, from magmatic to meteoric, seawater, basinal brines, and to metamorphic. Associated deposits such as skarns, Cordilleran vein, and high and intermediate-sulfidation epithermal deposits may occur above or adjacent to porphyry orebodies that are characterized by lateral and vertical alteration-mineralization zoning in complex porphyry systems (Voudouris et al., 2019, 2018; Richards et al., 2018; Bozkaya et al., 2017; Padyar, 2017; Padyar et al., 2017a; Akaryali, 2016; Imer et al., 2016; Catchpole et al., 2015, 2011; Cooke et al., 2015; Wang et al., 2013; Kouzmanov and Pokrovski, 2012; Mao et al., 2011; Jamali et al., 2010; Sillitoe, 2010; Baumgartner et al., 2009; Cook et al., 2009; Pirajno, 2009; Richards, 2009; Yigit, 2009; Williams-Jones and Heinrich, 2005; Melfos et al., 2002; Hedenquist et al., 2001; Seward and Barnes, 1997; Frei, 1995).

    Such veins mineralization are in fact part of the epithermal deposits of precious elements (Au-Ag) and base metals that form during elemental zoning of distant-type in porphyry systems (Cooke et al., 2015; Kouzmanov and Pokrovski, 2012; Catchpole et al., 2011; Mao et al., 2011; Sillitoe, 2010; Pirajno, 2009; Huebner, 1962). Metals may originate directly from crystallizing magmas, or be leached from various country rocks. The origin of fluids and solutes in many hydrothermal vein type deposits has been controversial. This might be due to extreme modification of the original fluids, or lack of appropriate data. The combination of fluid-inclusion micro thermometry and Raman spectroscopy of individual fluid inclusions in sphalerite and quartz and stable isotope data has been used to characterize the ore-forming solutions involved with polymetallic mineralization in Latala. This paper focuses on fluid record in veins bearing sphalerite. Fluid inclusions were studied in quartz and sphalerite on samples collected from veins at various levels of different depths. Similarly, any compositional zoning may be used as a tool to reconstruct the evolution of the physicochemical conditions in the precipitating fluid during crystal growth. Di Benedetto et al. (2005) discussed a possible inhomogeneous distribution of paramagnetic cations replacing Zn in sphalerite, usually assumed to be distributed randomly. On the other hand, Tauson and Chernyshev (1977) proposed a model involving a quasi-ideal solid solution of sphalerite (ZnS) and the main substituting elements (Fe, Mn, and Cd). The color zoning in sphalerite crystals is presumably related to variable amounts of Fe2+ and Mn2+ ions that have co-precipitated with ZnS. On the basis of experimental and Raman spectroscopy investigations, the Fe, Mn and Cd substitution within sphalerite has been discussed (Bonnet et al., 2016; Keith et al., 2014; Buzatu et al., 2013; Osadchii and Gorbaty, 2010; Di Benedetto et al., 2005; Hope et al., 2001; Mernagh and Trudu, 1993), which suggested that the variations of Fe/Zn ratios and sulfur content of sphalerite depend on the abundance of sediments hosted the mineralized veins in the hydrothermal circulation system.

    This study used fluid inclusions in samples of sphalerite and quartz from the Latala area (North Miduk porphyry system, Central Iran). The purpose of our work is to determine sulfur source and the role of magmatic fluid specified in sphalerite mineralization and the magmatic to hydrothermal evolution by analyzing fluid inclusions and 34S stable isotopes. Sphalerite composition can be used to determine the Fe/Zn ratios and the minimum temperature of the associated fluid during crystallization, the fS2 and fO2, and the redox state during sphalerite precipitation (Belissont et al., 2014; Keith et al., 2014; Daliran and Bakker, 2011; Murciego et al., 2010; Melcher et al., 2006; Di Benedetto et al., 2005; Lepetit et al., 2003; Richards and Kerrich, 1993; Oen et al., 1980; Rickard et al., 1979; Roedder, 1977; Shikazono, 1973; Sawkins, 1964). Microthermometry study allowed to determine the composition and density properties of fluid inclusions. Raman spectroscopy study complemented the analysis of the composition of the gas phase and was used to characterize the Fe-Zn substitution within sphalerite.

    Vein materials and wall rocks across drill cores were sampled for various laboratory studies, including transmitting and reflected light microscopy, chemical analysis, stable isotopes (S) and fluid inclusion microthermometry and Raman microspectroscopy. All the samples were prepared from veins bearing sphalerite-quartz assemblage as thin sections for petrography and double polished wafers for fluid inclusion study. Grains of sphalerite were selected and separated from samples and were polished to a thickness of ~250 μm at the Geological Survey & Mineral Exploration Institute of Iran (GSI). Cathodoluminescence (CL) of selected quartz samples was performed at the Research Institute of Petroleum Industry, Iran. Microthermometric characteristics of the fluid inclusions was performed on 250 µm thick doubly polished wafers. Fluid inclusion ice and halite melting, clathrate dissociation and homogenization temperatures were measured on a Linkam MDS-600 heating-freezing stage combined with a Leitz Wetzlar POL microscope. Measurements were conducted at the GeoResources Laboratory, University of Lorraine, France and the Geological Survey & Mineral Exploration Institute of Iran (GSI). Calibration was performed on synthetic fluid inclusion standards to ±0.1 ℃ at the melting points of CO2 (-56.6 ℃) and H2O (0.0 ℃), and to ±1 ℃ at the critical point of pure H2O (374.1 ℃). Qualitative and quantitative Raman spectroscopy was performed at the GeoResources Laboratory, University of Lorraine, France with a confocal microspectrometer (LabRam, Horiba-Jobin-Yvon) using a 514 nm Ar+ laser (Stabilite 2017, Spectra-Physics) as excitation, a confocal hole aperture of 500 µm, a slit width of 100 µm and an exposure time of 10 s repeated 6 times in order to reduce the noise/signal ratio. Sulfur-isotope analyses have been performed on sulfide minerals of sphalerite-quartz veins from samples of the deep drill core. These sulfide minerals are archived at G. G. Hatch Isotope Laboratories, University of Ottawa, Canada.

    The Cenozoic Urumieh-Dokhtar magmatic belt (UDMB) of Iran is a major host to porphyry Cu-Mo-Au deposits (PCDs). The UDMB extends for over 2 000 km in NW-SE direction, parallel to the Zagros Mountain Ranges in western Iran. The majority of the known PCDs occur in the southern section of the belt, also known as Dehaj-Sarduyeh magmatic belt, or Kerman belt (Fig. 1). Vein type, base and/or precious metals deposits are also common and some are spatially associated with the PCDs. Examples of such associations are observed in Miduk and Sarae in southern UDMB and Masjed-Daghi in northern UDMB (Movagyar, 2011; Alirezai et al., 2010). The Latala Deposit occurs about 8 km north of the Miduk porphyry system. The area is covered mainly by Paleocene-Eocene volcanic and pyroclastic rocks of basaltic, basaltic andesite and trachy-andesite compositions, and minor marls and limestones (Figs. 2, 3). The volcanic and pyroclastic rocks are intruded by Miocene shallow intrusions of quartz diorite, quartz monzonite and granodiorite compositions; the rocks are host to a set of ore-bearing quartz veins (Figs. 1a-1c). Mineralization in Latala Deposit is controlled by faults and fractures. The ring structures and faults have important role in the distribution of hydrothermal alteration zones and mineralization in the Latala Deposit because they facilitate the movement of magmatic fluid in more distal parts (Figs. 1-2).

    Figure  1.  Polymetallic veins such as Latala and Chahmessi (shown with yellow pattern) surrounding intrusions and the Miduk porphyry modified after Jafari Rad and Busch (2011), Movagyar (2011) and Dimitrijevic et al. (1971); (c) Landsat-ETM7 of Shahre-Babak area, the study area "Latala" is shown by yellow box; (d) 3D map of the digital elevation model (DEM) of the study area, ore-bearing quartz veins and cores (shown with red line).
    Figure  2.  Stratigraphic sections of volcanic, volcanic-sedimentary and subvolcanic intrusions sequence of Bahre-Aseman, Razak and Hezar complexes (modified from Dimithrijevic, 1973).
    Figure  3.  Simplified geology and structure map of study area with geology map of Latala (modified after Jafari Rad and Busch, 2011; Movagyar, 2011, Dimitrijevic et al., 1971).

    The veins consist of quartz, calcite, pyrite, chalcopyrite, galena, sphalerite, bornite and minor sulfosalts, particularly enargite and mckinstryite (Ag, Cu)2S. The sulfides are oxidized at the surface and shallow depths to goethite, hematite, jarosite, malachite, azurite, cerussite and hemimorphite. The oxidation was associated with development of supergene argillic alteration. Hydrothermal alteration in the Miduk Deposit is distinguished by a proximal potassic assemblage, dominated by biotite and K-feldspar, grading outward and upward into a phyllic assemblage. A propylitic halo, marked by chlorite especially clinochlore, epidote, and carbonates, is well developed in the enclosing volcanic rocks. Strong alteration in the wall rocks varies from a proximal silicic to distal argillic/advanced argillic assemblage. McInnes et al. (2005) reported a crystallization age of 12.5±0.1 Ma (zircon U-Pb) for the Miduk porphyritic intrusion. The timing of mineralization in Miduk has been indicated by 40Ar/39Ar technique on hydrothermal biotite from potassic alteration zone, to be 11.3±0.5 Ma (Hassanzadeh, 1993). Isotope ratio 87Sr/86Sr=0.704 (Hassanzadeh, 1993) and geochemical results studied by Shahabpour (2007) and Agard et al. (2011) suggested that the Miduk Deposit was formed in the transition between an island-arc and continental margin-arc setting. According to the results of petrographic, geochemical data and isotopic values of sulfides from the Miduk porphyry Cu deposit and quartz-sulfide veins in the late epithermal base and precious metal deposit of Latala (Padyar, 2017), it indicated a subduction-related magmatic arc setting. According to geochemical studies such as negative Nb anomalies and high Sr contents, the shoshonite and the high-K calc-alkaline rocks can be formed by the partial melting of SCLM (subcontinental lithospheric mantle). Results of geochemical studies show contamination with crustal material (metasomatism) dominated during evolution of the parent magmas. During the successive injection of magma, water-rock interaction has a significant role in alteration of host rocks and mineralization in Latala area (Padyar, 2017). Mineralization in Latala epithermal base and precious metal vein type formed in three stages: Stage 1, quartz-sulfide veins contain pyrite±chalcopyrite± enargite. Mineralization occurs as open space fillings and show high-sulfidation epithermal environment. Stage 2, veins contain pyrite, chalcopyrite and zoned sphalerite, with quartz and hematite. Stage 3, quartz veins contain galena+sphalerite+chalcopyrite and quartz with overgrowth of calcite. Mineralization in this stage occurs as replacement bodies and contains Fe-poor sphalerite without zoning at the outer parts of the deposit. In these veins, euhedral quartz with sulfide mineralization occurs as open space fillings, minor replacement bodies and hydrothermal breccia (Padyar et al., 2017a, b). These quartz veins and veinlets contain copper and zinc mineralization. The lithology of Stage 2 contains tuff and limestone tuff and veinlet calcite and the tuff fragments. Cement contains quartz, little calcite, pyrite, chalcopyrite and galena (Fig. 4a). Drill-core "BH13" reached a depth of 80 m below ground level. The main range of mineralization is at depths of 65.40 to 76.25 m. Secondary mineralization is at depth of 76.80 to 78.45 m (Movagyar et al., 2011). Drill-core "BH14" has a depth down to 90 m below ground level. These samples of sphalerite were collected at depths of 30 to 36 m. Galena is generally more abundant than sphalerite in these samples and associated with quartz and little calcite (Figs. 4b, 4c). Lithology of the stratigraphic Stage 3 includes periodic tuff and limestone tuff and andesite (Fig. 4b).

    Figure  4.  Photographs showing (a) drill-core "BH13-77" with a vein in tuff fragments containing pyrite, chalcopyrite and zoned sphalerite; (b) drill-core "BH14-30" with a vein containing galena, sphalerite, pyrite and chalcopyrite; (c) drill-core "BH14-36" where galena is generally more abundant than sphalerite and associated with quartz and little calcite; (d) sphalerite minerals extracted by heavy-liquid separation from 10 samples of the deep drill core.

    The chemical compositions of the samples bearing mineralization are presented in Table 1 and their average compositions are plotted in the (Cu+Pb+Zn)-Au-Ag diagram of Fig. 5. The Ag/Au ratio in samples of Latala boreholes is higher than 20. The concentration of Ag is directly related to boiling process (Pirajno, 2009). Maps of the distribution of metals and the triangular diagram show distinct metal zoning patterns for base metals and priecious metals (Figs. 5a-5c). The high ratio of Zn/Pb is visible in the triangular diagrams. The triangular diagrams (Figs. 5a-5c) show the distribution of base metals and the ratio of these elements, in the 3 stages of mineralization in Latala epithermal base and precious metal vein type and the two stages of sphalerite mineralization. The ternary Cu-Pb-Zn metal ratios diagram of Latala Deposit is shown in Fig. 5a. Latala Deposit is characterized by Cu-Au, Zn-Pb-Cu and Zn-Pb groups according to relative proportions. The ternary Cu-Pb-Zn metal ratios diagram of sphalerite-quartz veins (Fig. 5b) shows the distribution of metal zoning and two stages 2-3. The ternary diagram of the Aggeneys-Gamsberg of SEDEX type (Pirajno, 2009) (Fig. 5c) compared with metal zoning from quartz veins in Latala Deposit shows two different directions of metal zoning for the two types of ores such as SEDEX deposit and the vein type, base metal deposit associated with porphyry systems.

    Table  1.  Chemical compositions (Au, Ag, Cu, Pb and Zn in ppm) of quartz+galena+sphalerite veins collected at various depths
    Drillcore Depth (m) Sample number Au Ag Cu Pb Zn
    BH13-B14-2 77.0-77.8 18 0.19 10.24 291.8 6 060 24 730
    BH13-B14-3 77.8-78.6 19 0.31 16.8 755.9 1 396.5 31 790
    BH14-B6-5 29.8-30.8 11 0.4 112 16 000 5 010 2 260
    BH14-B7-1 30.8-31.8 12 0.4 110 12 000 23 000 15 000
    BH14-B7-6 35.8-36.8 17 0.038 66 13 000 52 000 54 000
    BH14-B8-1 36.8-38.0 18 0.078 23 1 595 1 600 2 600
     | Show Table
    DownLoad: CSV
    Figure  5.  (a) Ternary diagram showing Cu-Pb-Zn metal ratios from quartz veins. Latala Deposit is divided into Cu-Au, Zn-Pb-Cu and Zn-Pb groups. (b) Ternary diagram showing Cu-Pb-Zn metal ratios from sphalerite-quartz veins. (c) Ternary diagram of metal zoning of the Aggeneys-Gamsberg SEDEX ore field as being related to the distance from the source of the mineralizing fluids (Pirajno, 2009) compared with distribution metal zoning from quartz veins in Latala Deposit.

    This study focuses on fluid inclusions in sphalerite-quartz veins. The veins of Stage-2 contain quartz-sphalerite associated with chalcopyrite. The sphalerite is zoned yellow to red-brown alternating with quartz+hematite (Figs. 4a, 6c, 6d). In Stage 3 the veins contain quartz-sphalerite associated with galena and chalcopyrite and quartz with overgrowth of calcite. Mineralization in this stage occurs as replacement bodies and contains Fe-poor sphalerite, a lack of zoning with dark, green color, which forms in the outer parts of the deposit (Figs. 4b, 4c, 6e-6g). A number of sphalerite crystals show exsolution and solid inclusions of sulfide minerals such as pyrite and chalcopyrite (Figs. 6a, 6b). Bortnikov et al. (1991) suggested chalcopyrite inclusions were produced by replacement as the result of interaction of sphalerite with solutions, which transported both copper and iron and coprecipitation of sphalerite and chalcopyrite is an alternative mechanism of formation of the chalcopyrite inclusions in some ore deposits. Bortnikov et al. (1991) suggested the following reactions

    Figure  6.  (a) Polished section of grains of sphalerite associated with sulfide mineral inclusions such as pyrite. (b) Polished section of sphalerite with exsolution of chalcopyrite. (c) Twinned sphalerite with relicts of zonation in sphalerite (brown-yellow). (d) Primary inclusions in sphalerite (brown-yellow). (e), (f), (g) Primary fluid inclusions and rhythmic growth of Fe-poor sphalerite. (h) A trail of secondary inclusions crosscutting the growth zones of sphalerite. (i) Trail of two-phase (liquid+vapor) and vapor- phase only pseudo-secondary fluid inclusions observed in zoned (brown-yellow) Fe-bearing sphalerite.
    Zn0.80Fe0.20S+0.10Cu++0.10H+0.8Zn0.9Fe0.1S+0.10CuFeS2+0.10Zn2++0.05H2 (1)

    and

    2Zn0.95Fe0.05S+0.90Fe2++Cu++H+CuFeS2+1.9Zn2++0.50H2 (2)

    Fe-poor sphalerite in Latala Deposit is euhedral and shows rhythmic growth zones (Figs. 6e-6g). Koziowski and Aorecka (1993) demonstrated such morphology formed during periodic changes in chemical composition and pH of the environment.

    The fluid inclusions formed along the cleavage and growth planes of sphalerite (Figs. 6e-6h). Primary inclusions in Fe-poor sphalerite contain rounded corners and edges and pseudooctahedral habit (Figs. 7d-7f). Bonev and Kouzmanov (2002) have shown that such a habit in sphalerite may result from their position within the crystal and the influence of growth defects.

    Figure  7.  (a) Quartz bearing overgrowth zones under plain polarized light. (b) Multiple quartz generations and overgrowth in single grains under CL. (c) Photomicrographs illustrating the petrographic characteristics of the different vein deposition stages. (d) Large primary fluid inclusion in dark and Fe-poor sphalerite. (e) Fluid inclusion with pseudo-octahedral habit. (f) Primary fluid inclusion associated with sulfide inclusions in sphalerite. (g) Trail of two-phase (liquid+vapor) pseudo-secondary fluid inclusions observed in zoned (brown-yellow) Fe-bearing sphalerite.

    Cathodoluminescence (CL) imaging indicates multiple quartz generations in single grains. In general, euhedral sphalerite grains are associated with quartz and galena in the core of the veins implying several events of circulating fluids (Figs. 7a-7c).

    Fluid inclusion studies have been performed on quartz samples from different veins at different depths in association with sphalerite minerals and chalcopyrite, pyrite and galena. Petrographic analyses of fluid inclusions from sphalerite and quartz have shown that the ore-related fluid inclusions are two phase liquid+gas inclusions (Figs. 7e-7h). The gas phase occupies 16%-24% of the total inclusion volume when observed at room temperature. Microthermometric results from sphalerite- hosted fluid inclusions are illustrated in Table 2. The final melting temperature of ice (Tm ice) in primary inclusions range between -0.1 and -4.9 ℃. All inclusions were homogenized to the liquid phase on heating. Halite-saturated brine inclusions were never found in quartz associated with the sphalerite minerals and chalcopyrite, pyrite and galena. Fluid inclusions in sphalerite consist of common aqueous-carbonic inclusions two (liquid H2O+CO2-rich supercritical fluid) or three (liquid H2O+liquid CO2+vapor CO2) phases. Dissociation of clathrate (Tm clathrate) occurs at temperatures 5.2 ℃. The number of primary two-phase inclusions suitable for measurement is significant in such samples. Homogenization temperatures exhibit a range from 232 to 250 ℃, for Fe-bearing sphalerite (quartz+ sphalerite+pyrite+chalcopyrite) and homogenization temperatures exhibit a range from 198 to 284 ℃ for Fe-poor sphalerite (quartz+galena+sphalerite+chalcopyrite veins) (Table 2). Homogenization temperatures for quartz associated in the paragenesis with sphalerite (vein BH13 with sphalerite+pyrite+ chalcopyrite) exhibit a range from 144 to 285 ℃. For quartz associated with (galena+sphalerite+chalcopyrite vein BH14). The homogenization temperatures are in the range of 157-247 ℃. Overall, the salinity of the inclusions observed in quartz range from 0.5 wt.% to 7.2 wt.% NaCl eq. (Table 2).

    Table  2.  Summary of fluid inclusion data for sphalerite bearing veins in the Latala vein-type deposit. Ø. Average; Qtz. quartz; Sp. sphalerite
    Sample No. Number analyses Stage Composition Host mineral Th (℃) Tm CO2 Tm clathrate Tm ice Salinity (NaCl%, wt.% eq.) Density (g/cm3)
    BH13-77 20 2 L+V Sp 144-285 (Ø214) (-0.1 to -4.9) 0.2-7.7 (Ø5.3) 0.8-1.0
    BH14-30-36 15 3 L+V Sp 157-247 (Ø219) 5 (-0.3 to -4.6) 0.5-7.2 (Ø4.0) 0.8-1.0
    BH13-77 5 2 L+V Qtz 232-250 (Ø237) (-1.7 to -3.8) 2.8-6.1 (Ø4.5) 0.8-0.9
    BH14-30-36 25 3 L+V, L+V+CO2 Qtz 198-284 (Ø235) -56.6 (-0.8 to -3.9) 1.3-6.2 (Ø3.7) 0.8-0.9
     | Show Table
    DownLoad: CSV

    We used microthermometry to determine the salinity of aqueous fluid inclusions. In some cases, we used Raman spectroscopy to recognize melt inclusions, fluid inclusions and to determine the salinity of aqueous fluid inclusions. The general method to obtain aqueous salinity by Raman spectroscopy is based on the decrease of the strength of the hydrogen bond of water by chloride. The intensity ratio I3425/I3260 at two positions on the stretching vibration band of liquid water was then calculated and plotted as a function of molality (mol NaCl per kg of H2O) and mass% NaCl (g NaCl per 100 g of solution) (Caumon et al., 2015, 2014; Tarantola and Caumon, 2015). Many gas phases that are common in fluid inclusions, including H2O, CO2, CH4, H2S, N2, etc., are also recognized by Raman spectroscopy and in some cases quantified using their Raman band intensities and/or positions (Frezzotti et al., 2012; Berkesi et al., 2009; Azbej et al., 2007; Burke, 2001; Dubessy et al., 1989, 1988; Pasterisv et al., 1986; Wopenka and Pasteris, 1986).

    Primarily, the detection of H2S species by Raman spectroscopy in fluid inclusions in sphalerite was difficult because of fluorescence due to sphalerite (Shepherd et al., 1985). The Raman analysis of the gas phase of fluid inclusions in sphalerite indicated a mixture of CO2 (1 285 and 1 388 cm-1), and H2 (4 126 and 4 156 cm-1). The gas phase composition calculated from gas peak area was CO2 (46%-97%) and H2 (65%-3%).

    The results of the Raman study show a high percentage of CO2 in the gas phase of fluid inclusions in sphalerites and indicate significant H2 (Padyar et al., 2017a). Keith et al. (2014) discussed that temperature, pressure, sulfur fugacity (fS2), and oxygen fugacity (fO2) influence the Fe content of sphalerite. On the basis of experimental and Raman spectroscopy investigations, the Fe, Mn and Cd substitution within sphalerite has been discussed (Bonnet et al., 2016; Buzatu et al., 2013; Osadchii and Gorbaty, 2010; Acero et al., 2007; Di Benedetto et al., 2005; Lepetit et al., 2003; Hope et al., 2001; Mernagh and Trudu, 1993). The results of the Raman study of various sphalerites in Latala Deposit show Fe-poor sphalerite and Fe-rich sphalerite (Fig. 9). In Fe-rich sphalerite, the intensities at 300 and 331 cm-1 increase and the intensity at 350 cm-1 decreases (Osadchii and Gorbaty, 2010).

    Figure  8.  (a) Homogenization temperature distribution of fluid inclusions from the sphalerite and quartz crystal in stages 2 and 3. (b) Salinity distribution of fluid inclusions from the sphalerite and quartz crystal. Sp. Sphalerite; Qtz. quartz.
    Figure  9.  Raman spectra of various sphalerite minerals of Latala Deposit compared with some of the spectra of (Fe, Zn)S sphalerites (solid solution) (Osadchii and Gorbaty, 2010).

    Sulphur isotope composition (δ34S) of sulfide minerals in sphalerite bearing veins of Latala Deposit is shown in Table 3. In this paper we used the method of Li and Liu (2006) for the calculation of sulfur isotope fractionation in sulfides. The δ34S ranged between -9.6‰ and -2.1‰ (n=4) for galena and sphalerite. These δ34S of H2S ranges after calculation of sulfur isotope fractionation in sulfide range from -7.1‰ to +0.6‰ (n=4). The δ34S of H2S has been calculated based on the homogenization temperatures obtained from fluid inclusions. This practice is important to understand source sulfur and formation condition of sulfide minerals as reviewed by Seal (2006), Rye(2005, 1993), Filed et al. (2005), Ohmoto (1972), and Sakai (1968). The various sulfur isotopic compositions suggest an igneous source with contamination of wall rock in the hydrothermal system of Latala.

    Table  3.  Sulphur isotope composition (δ34S) of galena from Latala area. Calculation of sulfur isotope fractionation between galena and H2S (the method suggested by Li and Liu, 2006).
    Sample No. Weight (mg) δ34S (x, CDT) mineral δ34S (x, CDT) H2S %S Comment
    BH5-36 0.940 -5.70 -3.30 22.20 Galena; ~30% sphalerite
    BH13-77 0.916 -2.13 +0.57 32.64 Galena; < 20% quartz
    BH14-30 0.925 -9.55 -7.05 19.33 Galena; < 20% quartz
    BH14-36 0.935 -6.12 -3.82 28.64 Galena; < 20% quartz
     | Show Table
    DownLoad: CSV

    The data provided in this paper make it possible to discuss the physicochemical conditions associated with the formation of Fe-poor sphalerite in volcanic-sedimentary sequences of Latala Deposit. Based on petrography and Raman spectrometry the concentration of iron in sphalerite varies on a weight percent level is reflected in the color of light to dark of the crystal. It is affected by the oxidation-reduction and pH and ƒH precipitation environment. Newton (2013) believed color sphalerite was useful to compare the iron concentration of a grain of sphalerite to the salinity of fluid inclusions phase composition. The sphalerite bearing iron shows brown to dark red color. Based on the data in the histograms (Figs. 8a, 8b), the complete range in temperature and salinity during the formation of the sphalerite crystal are known, but how these parameters varied during crystal growth cannot be inferred from the histograms such as cation ions change. The microthermometry study of more than 65 fluid inclusions in sphalerite and quartz samples showed a homogeneous condensation temperature from 144 to 285 ℃ and a salinity range from 0.2 wt.% to 7.6 wt.% (NaCl). H2S has a main role in the gas transport and in the deposition of the elements such as Cu-Pb-Zn-Ag and Au. We could not measure H2S species by Raman spectroscopy study of fluid inclusions because of the fluorescence of sphalerite. Secondary boiling of a CO2-bearing fluid at ~250 ℃ induced by faulting events can be responsible for Au, Ag, and associated base metal sulfide deposition in low- sulfidation epithermal deposits (Pokrovski et al., 2013). According to the results of field studies and fluid inclusion evidences, boiling in Latala Deposit resulted in breccia bearing mineralization, intergrowth of adularia and quartz, smoky quartz containing co-genetic CO2-rich inclusions, growth during boiling of low salinity—CO2-bearing fluid inclusions, natrocarbonate minerals such as dawsonite in fluid inclusions associated with distinct rim of liquid CO2 around vapor phase and coexisting two types (L-rich and V-rich) of fluid inclusions, are indicative of boiling process (Padyar, 2017; Padyar et al., 2017a, b). The results of Raman spectroscopy show a high percentage of CO2 in the gas phase of fluid inclusions. The role of boiling process in the distribution of base metal elements and Ag/Au ratios is important in mineralization of the Latala Deposit. Ag/Au ratios are higher than 20. In this region, there is metal zoning (distal zoning) and evolution of porphyry copper systems (Miduk) towards the epithermal mineralizing fluids of the Latala base and precious metal deposit (Padyar, 2017; Padyar et al., 2017c). Distribution and evolution mineralization model for the magmatic-hydrothermal system from Miduk to Latala is comparable to the model of Baumgartner et al. (2009). The δ34S values for sulfide minerals in galena and sphalerite of sphalerite bearing veins vary between -9.8‰ and -1.0‰, and the δ34S values calculated for H2S are between -7.1‰ and +0.6‰. These values correspond to values of magmatic sulfur and it is possible that magmatic fluid was contaminated by wall rocks during evolution (Ohmoto and Rye, 1979). Lack of reduced carbon species (methane) was confirmed using UV light and Raman spectroscopy. For calculation of the redox state of the fluid ƒO2, Huizenga(2005, 2001) and Martz et al. (2017) suggested two methods, one based on the CO2-CO-O2 equilibrium from fluid inclusion data and the other based on the H2O-H2-O2 equilibrium using ƒH2. High amounts of H2 in fluid inclusions of Fe-poor sphalerite can be the result of different processes during alteration. Mineralization of sphalerite in the Latala Deposit has occurred in shallow parts of sedimentary- volcanic sequence (Padyar, 2017; Padyar et al., 2017a). One of the proposed mechanisms for the generation of H2 attributes it to intense alteration including formation phyllosilicates involving redox reactions (Hrstka et al., 2011; Dubessy et al., 1988). During wall-rock reactions with fluid cooling in contact with intermediate-composition magmatic rocks, de-sulphidation of the fluid by iron in the wall rocks competes with the H+ metasomatism effect of feldspar-destructive alteration (Heinrich, 2005). A wide range of different gossans described in the Dehaj-Sarduyeh zone, Miduk Deposit and the surrounding areas (Atapour, 2007). Hematite-goethite and a little malachite and azurite gossans in Miduk as well as jarosite gossan in Latala deposits introduced by Atapour (2007). This reveals a hydrothermal fluid of magma, it is possible to carry iron to locations far away from porphyry body. Evolution of magmatichydrothermal fluids during cooling and successively dilution during continued magmatic fluid ascent would lead to variable amounts of potassic or propylitic alteration and the hydrogen diffusion into the inclusions based on equations 1 and 2 (Padyar et al., 2017a; Pirajno, 2009; Sirbescu and Nabelek, 2003; Hall and Bodnar, 1990). The hydrogen diffusion into fluid inclusions has been demonstrated (Li et al., 2018; Shang et al., 2009; Hall and Sterner, 1995; Mavrogenes and Bodnar, 1994; Hall and Bodnar, 1990). The diffusion of hydrogen should be considered during calculating the volume and pressure changes. High amounts of H2 in the gas phase fluid inclusions of Fe-poor sphalerites can be attributed coprecipitation of sphalerite and chalcopyrite and the formation of chalcopyrite inclusions in sphalerite based on reactions suggested by Bortnikov et al. (1991) and feldspar-destructive alteration and diffusion H2 into fluid inclusion. Fractionation processes tend to concentrate Cu, Zn, Pb, in the residual melts and the magmatic fluids and leaching processes of volcanic and volcano-sedimentary host rocks tend to concentration Pb and Zn. Samples of host rocks in Latala Deposit showed high concentration of Pb in normalizes of volcanic rocks and core samples.

    Raman spectroscopy and microthermometry of fluid inclusions and sulfur isotope analysis help to determine the evolution of the physico-chemical conditions in the precipitating fluid during crystal growth and ore deposition in Latala. The isotopic composition of galena and sphalerite suggests that the origin of the sulfide is magmatic and fluid inclusions show that Fe-poor sphalerite is composed of a high ƒH2 and ƒS2 and of a low temperature fluid in circulating in the volcanic-sedimentary sequence. Evolution of magmatic-hydrothermal fluids during cooling and subsequent dilution during continuing magmatic fluid ascent and secondary boiling would lead to variable amounts of potassic or prophylactic alteration and the hydrogen diffusion into the inclusions. Fractionation processes during evolution magma and leaching processes of volcanic and volcano-sedimentary host rocks tend to concentrate Cu, Zn and Pb.

    This study was supported by the Ministry of Science, Research and Technology of Iran and TRIGGER Program. We would like to thank Prof. Jean Dubessy who facilitates the visit to GeoRessources Laboratory. We would like to thank Prof. Olivier Vanderhaeghe and Dr. Saeed Alirezaei for their guidance in the PhD study and their collaboration. We would also like to thank Prof. Marie-Christine Boiron for fruitful discussions. We would like to thank Dr. Karine de Maury-Pistre for accompanying us. We would like to thank the Geological Survey & Mineral Exploration of Iran GSI-Department of Geology of the Shahid Beheshti University, Miduk Copper Mine of the French Embassy. Finally, we would like to thank the faculty, staff, and students of the Department of Geology- GeoResources of the University de Lorraine, for their collaboration. The final publication is available at Springer via https://doi.org/10.1007/s12583-019-1023-5.

  • Acero, P., Cama, J., Ayora, C., 2007. Sphalerite Dissolution Kinetics in Acidic Environment. Applied Geochemistry, 22(9):1872-1883. https://doi.org/10.1016/j.apgeochem.2007.03.051
    Agard, P., Omrani, J., Jolivet, L., et al., 2011. Zagros Orogeny:A Subduction-Dominated Process. Geological Magazine, 148(5/6):692-725. https://doi.org/10.1017/s001675681100046x
    Akaryali, E., 2016. Geochemical, Fluid Inclusion and Isotopic (O, H and S) Constraints on the Origin of Pb-Zn±Au Vein-Type Mineralizations in the Eastern Pontides Orogenic Belt (NE Turkey). Ore Geology Reviews, 74:1-14. https://doi.org/10.1016/j.oregeorev.2015.11.013
    Alirezaei, S., Modrek, H., Padyar, F., 2010. Chahmessi Epithermal Base and Precious Metal Deposit Kerman Copper Belt, South Iran: Investigation of Genetic Relation with Miduk Porphyry System. ACROFI-III, Novosibirsk, Russia. 6-7
    Atapour, H., 2007. Geochemical Evolution and Metallogeny of Potassic Igneous Rocks of Dehaj-Sarduieh Volcano-Plutonic Belt, Kerman Province, Iran, with Particular Reference to Special Elements: [Dissertation]. Shahid Bahonar University of Kerman, Kerman. 401 (in Persian with English Abstract)
    Azbej, T., Severs, M. J., Rusk, B. G., et al., 2007. In situ Quantitative Analysis of Individual H2O-CO2 Fluid Inclusions by Laser Raman Spectroscopy. Chemical Geology, 237(3/4):255-263. https://doi.org/10.1016/j.chemgeo.2006.06.025
    Baumgartner, R., Fontbote, L., Vennemann, T., 2009. Mineral Zoning and Geochemistry of Epithermal Polymetallic Zn-Pb-Ag-Cu-Bi Mineralization at Cerro de Pasco, Peru. Economic Geology, 103(3):493-537. https://doi.org/10.2113/gsecongeo.103.3.493
    Belissont, R., Boiron, M.-C., Luais, B., et al., 2014. LA-ICP-MS Analyses of Minor and Trace Elements and Bulk Ge Isotopes in Zoned Ge-Rich Sphalerites from the Noailhac-Saint-Salvy Deposit (France):Insights into Incorporation Mechanisms and Ore Deposition Processes. Geochimica et Cosmochimica Acta, 126:518-540. https://doi.org/10.1016/j.gca.2013.10.052
    Berkesi, M., Hidas, K., Guzmics, T., et al., 2009. Detection of Small Amounts of H2O in CO2-Rich Fluid Inclusions Using Raman Spectroscopy. Journal of Raman Spectroscopy, 40(11):1461-1463. https://doi.org/10.1002/jrs.2440
    Bonev, I. K., Kouzmanov, K., 2002. Fluid Inclusions in Sphalerite as Negative Crystals:A Case Study. European Journal of Mineralogy, 14(3):607-620. https://doi.org/10.1127/0935-1221/2002/0014-0607
    Bonnet, J., Mosser-Ruck, R., Caumon, M. C., et al., 2016. Trace Element Distribution (Cu, Ga, Ge, Cd, and Fe) in Sphalerite from the Tennessee MVT Deposits, USA, by Combined EMPA, LA-ICP-MS, Raman Spectroscopy, and Crystallography. The Canadian Mineralogist, 54(5):1261-1284. https://doi.org/10.3749/canmin.1500104
    Bortnikov, N. S., Genkin, A. D., Dobrovolʼskaya, M. G., et al., 1991. The Nature of Chalcopyrite Inclusionsin Sphalerite:Exsolution, Coprecipitation, or "Disease"?. Economic Geology, 86:1070-1082 doi: 10.2113/gsecongeo.86.5.1070
    Bozkaya, G., Bozkaya, O., Banks, D., et al., 2017. Fluid Evolution of Mixed Base-Metal Gold Mineralization in the Tethys Belt: Koru Deposit, Turkey. 14th Binennial Meeting of Society for Geology Applied to Mineral Deposits. Aug. 20-23, 2017, Quebec City, Canada
    Burke, E. A. J., 2001. Raman Microspectrometry of Fluid Inclusions. Lithos, 55(1/2/3/4):139-158. https://doi.org/10.1016/s0024-4937(00)00043-8
    Buzatu, A., Buzgar, N., Damian, G., et al., 2013. The Determination of the Fe Content in Natural Sphalerites by Means of Raman Spectroscopy. Vibrational Spectroscopy, 68:220-224. https://doi.org/10.1016/j.vibspec.2013.08.007
    Catchpole, H., Kouzmanov, K., Fontboté, L., et al., 2011. Fluid Evolution in Zoned Cordilleran Polymetallic Veins-Insights from Microthermometry and LA-ICP-MS of Fluid Inclusions. Chemical Geology, 281(3/4):293-304. https://doi.org/10.1016/j.chemgeo.2010.12.016
    Catchpole, H., Kouzmanov, K., Putlitz, B., et al., 2015. Zoned Base Metal Mineralization in a Porphyry System:Origin and Evolution of Mineralizing Fluids in the Morococha District, Peru. Economic Geology, 110(1):39-71. https://doi.org/10.2113/econgeo.110.1.39
    Caumon, M.-C., Dubessy, J., Robert, P., et al., 2014. Fused-Silica Capillary Capsules (FSCCs) as Reference Synthetic Aqueous Fluid Inclusions to Determine Chlorinity by Raman Spectroscopy. European Journal of Mineralogy, 25(5):755-763. https://doi.org/10.1127/0935-1221/2013/0025-2280
    Caumon, M.-C., Tarantola, A., Mosser-Ruck, R., 2015. Raman Spectra of Water in Fluid Inclusions:I. Effect of Host Mineral Birefringence on Salinity Measurement. Journal of Raman Spectroscopy, 46(10):969-976. https://doi.org/10.1002/jrs.4708
    Cook, N. J., Ciobanu, C. L., Pring, A., et al., 2009. Trace and Minor Elements in Sphalerite:A LA-ICPMS Study. Geochimica et Cosmochimica Acta, 73(16):4761-4791. https://doi.org/10.1016/j.gca.2009.05.045
    Cooke, D., Braxton, W. N., Rinne, M., 2015. Metal Transport and Ore Deposition in Porphyry Copper±Gold±Molybdenum Deposits-Contrasting Behaviour between Deep and Hallow Environments. SGA 50th Anniversary Meeting, Aug. 24-27, 2015, Nancy, France. 275-278
    Daliran, F., Bakker, R. J., 2011. Metastable Melting Behavior in Fluid Inclusions in Sphalerite from the Angouran Zn(Pb) Deposit (NW Iran). European Current Research on Fluid Inclusions (ECROFI-XXI). Montanuniversität Leoben
    Di Benedetto, F., Bernardini, G. P., Costagliola, P., et al., 2005, Compositional Zoning in Sphalerite Crystals. American Mineralogist, 90:1384-1392 doi: 10.2138/am.2005.1754
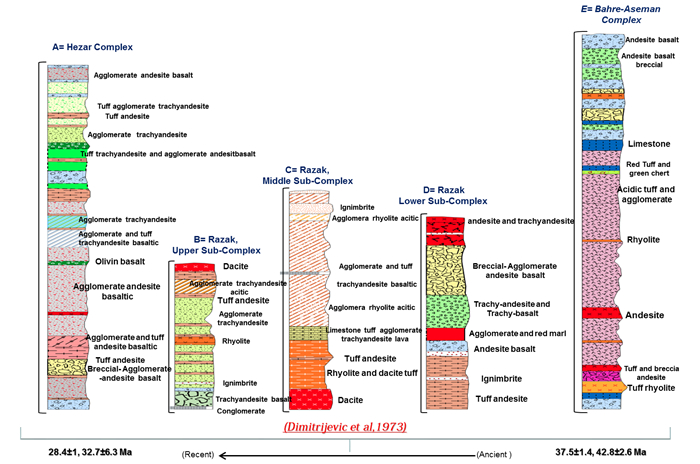
    Dimitrijevic, M. D., Dimitrijevic, M. N., Diordjevic, M., 1971. Geological Map of Shahr-E-Babak (30' Sheet No. 7050, Scale: 1: 100 000). Geological Survey of Iran, Tehran
    Dimitrijevic, M., 1973. Geology of Kerman Region. Institute for Geological and Mining Exploration and Institution of Nuclear and Other Mineral Raw Materials, Beograd-Yugoslavia. Geological Survey of Iran, Report No. Yu/52.334
    Dubessy, J., Pagel, M., Beny, J. M., et al., 1988. Radiolysis Evidenced by H2-O2 and H2-Bearing Fluid Inclusions in Three Uranium Deposits. Geochimica et Cosmochimica Acta, 52(5):1155-1167. https://doi.org/10.1016/0016-7037(88)90269-4
    Dubessy, J., Poty, B., Ramboz, C., 1989. Advances in C-O-H-N-S Fluid Geochemistry Based on Micro-Raman Spectrometric Analysis of Fluid Inclusions. European Journal of Mineralogy, 1(4):517-534. https://doi.org/10.1127/ejm/1/4/0517
    Field, C. W., Zhang, L., Dilles, J. H., et al., 2005. Sulfur and Oxygen Isotopic Record in Sulfate and Sulfide Minerals of Early, Deep, Pre-Main Stage Porphyry Cu-Mo and Late Main Stage Base-Metal Mineral Deposits, Butte District, Montana. Chemical Geology, 215(1/2/3/4):61-93. https://doi.org/10.1016/j.chemgeo.2004.06.049
    Frei, R., 1995. Evolution of Mineralizing Fluid in the Porphyry Copper System of the Skouries Deposit, Northeast Chalkidiki (Greece); Evidence from Combined Pb-Sr and Stable Isotope Data. Economic Geology, 90(4):746-762. https://doi.org/10.2113/gsecongeo.90.4.746
    Frezzotti, M. L., Tecce, F., Casagli, A., 2012. Raman Spectroscopy for Fluid Inclusion Analysis. Journal of Geochemical Exploration, 112:1-20. https://doi.org/10.1016/j.gexplo.2011.09.009
    Hall, D. L., Bodnar, R. J., 1990. Methane in Fluid Inclusions from Granulites:A Product of Hydrogen Diffusion?. Geochimica et Cosmochimica Acta, 54(3):641-651. https://doi.org/10.1016/0016-7037(90)90360-w
    Hall, D. L., Sterner, S. M., 1995. Experimental Diffusion of Hydrogen into Synthetic Fluid Inclusions in Quartz. Journal of Metamorphic Geology, 13(3):345-355. https://doi.org/10.1111/j.1525-1314.1995.tb00224.x
    Hassanzadeh, J., 1993. Metallogenic and Tectonic-Magmatic Events in the SE Sector of the Cenozoic Active Continental Margin of Iran (Shahr E Babak Area, Kerman Province): [Dissertation]. University of California, Los Angeles. 204
    Hedenquist., J. W., Claveria, R. J. R., Villafuerte, G. P., 2001. Types of Sulfide-Rich Epithermal Deposits, and Their Affiliation to Porphyry Systems: Lepanto-Victoria-Far Southeast Deposits, Philippines, as Examples. ProExplo Congreso, April 24-28, Lima, Perú. https://www.researchgate.net/publication/292437674
    Heinrich, C. A., 2005. The Physical and Chemical Evolution of Low- Salinity Magmatic Fluids at the Porphyry to Epithermal Transition:A Thermodynamic Study. Mineralium Deposita, 39(8):864-889. https://doi.org/10.1007/s00126-004-0461-9
    Hope, G. A., Woods, R., Munce, C. G., 2001. Raman Microprobe Mineral Identification. Minerals Engineering, 14(12):1565-1577. https://doi.org/10.1016/s0892-6875(01)00175-3
    Hrstka, T., Dubessy, J., Zachariáš, J., 2011. Bicarbonate-Rich Fluid Inclusions and Hydrogen Diffusion in Quartz from the Libčice Orogenic Gold Deposit, Bohemian Massif. Chemical Geology, 281(3/4):317-332. https://doi.org/10.1016/j.chemgeo.2010.12.018
    Huebner, J. S., 1962. Fluid Inclusion Studies on Sphalerite and Quartz from the Providence Lead and Zinc Deposits, Zacatecas, Mexico: [Dissertation]. Princeton University, Princeton
    Huizenga, J. M., 2001. Thermodynamic Modelling of C-O-H Fluids. Lithos, 55(1/2/3/4):101-114. https://doi.org/10.1016/s0024-4937(00)00040-2
    Huizenga, J. M., 2005. COH, an Excel Spreadsheet for Composition Calculations in the C-O-H Fluid System. Computers & Geosciences, 31(6):797-800. https://doi.org/10.1016/j.cageo.2005.03.003
    Imer, A., Richards, J. P., Muehlenbachs, K., 2016. Hydrothermal Evolution of the Çöpler Porphyry-Epithermal Au Deposit, Erzincan Province, Central Eastern Turkey. Economic Geology, 111(7):1619-1658. https://doi.org/10.2113/econgeo.111.7.1619
    Jafari Rad, A. R., Busch, W., 2011. Porphyry Copper Mineral Prospectivity Mapping Using Interval Valued Fuzzy Sets Topsis Method in Central Iran. Journal of Geographic Information System, 3(4):312-317. https://doi.org/10.4236/jgis.2011.34028
    Jamali, H., Dilek, Y., Daliran, F., et al., 2010. Metallogeny and Tectonic Evolution of the Cenozoic Ahar-Arasbaran Volcanic Belt, Northern Iran. International Geology Review, 52(4/5/6):608-630. https://doi.org/10.1080/00206810903416323
    Keith, M., Haase, K. M., Schwarz-Schampera, U., et al., 2014. Effects of Temperature, Sulfur, and Oxygen Fugacity on the Composition of Sphalerite from Submarine Hydrothermal Vents. Geology, 42(8):699-702. https://doi.org/10.1130/g35655.1
    Kouzmanov, K., Pokrovski, G. S., 2012. Hydrothermal Controls on Metal Distribution in (Cu-Au-Mo) Porphyry Systems. In: Special Publication of the Society of Economic Geologists, 16: 573-618. https://archive-ouverte.unige.ch/unige:27832
    Koziowski, A., Aorecka, E., 1993, Sphalerite Origin in the Olkusz Mining District a Fluid Inclusion Model. Geological Quarterly, 37(2):291-306
    Lepetit, P., Bente, K., Doering, T., et al., 2003. Crystal Chemistry of Fe-Containing Sphalerites. Physics and Chemistry of Minerals, 30(4):185-191. https://doi.org/10.1007/s00269-003-0306-6
    Li, L. F., Zhang, X., Luan, Z. D., et al., 2018. Raman Vibrational Spectral Characteristics and Quantitative Analysis of H2 up to 400 ℃ and 40 MPa. Journal of Raman Spectroscopy, 49(10):1722-1731. https://doi.org/10.1002/jrs.5420
    Li, Y. B., Liu, J. M., 2006. Calculation of Sulfur Isotope Fractionation in Sulfides. Geochimica et Cosmochimica Acta, 70(7):1789-1795. https://doi.org/10.1016/j.gca.2005.12.015
    Mao, J. W., Zhang, J. D., Pirajno, F., et al., 2011. Porphyry Cu-Au-Mo Epithermal Ag-Pb-Zn-Distal Hydrothermal Au Deposits in the Dexing Area, Jiangxi Province, East China-A Linked Ore System. Ore Geology Reviews, 43(1):203-216. https://doi.org/10.1016/j.oregeorev.2011.08.005
    Martz, P., Cathelineau, M., Mercadier, J., et al., 2017. C-O-H-N Fluids Circulations and Graphite Precipitation in Reactivated Hudsonian Shear Zones during Basement Uplift of the Wollaston-Mudjatik Transition Zone:Example of the Cigar Lake U Deposit. Lithos, 294/295:222-245. https://doi.org/10.1016/j.lithos.2017.10.001
    Mavrogenes, J. A., Bodnar, R. J., 1994. Hydrogen Movement into and out of Fluid Inclusions in Quartz:Experimental Evidence and Geologic Implications. Geochimica et Cosmochimica Acta, 58(1):141-148. https://doi.org/10.1016/0016-7037(94)90452-9
    McInnes, B. I. A., Evans, N. J., Fu, F. Q., et al., 2005. Thermal History Analysis of Selected Chilean, Indonesian and Iranian Porphyry Cu-Mo-Au Deposits. In: Porter, T. M., ed., Super Porphyry Copper and Gold Deposits: A Global Perspective. PGC Publishing, Adelaide, Ausstralia. 27-42
    Melcher, F., Oberthür, T., Rammlmair, D., 2006. Geochemical and Mineralogical Distribution of Germanium in the Khusib Springs Cu-Zn-Pb-Ag Sulfide Deposit, Otavi Mountain Land, Namibia. Ore Geology Reviews, 28(1):32-56. https://doi.org/10.1016/j.oregeorev.2005.04.006
    Melfos, V., Vavelidis, M., Christofides, G., et al., 2002. Origin and Evolution of the Tertiary Maronia Porphyry Copper-Molybdenum Deposit, Thrace, Greece. Mineralium Deposita, 37(6/7):648-668. https://doi.org/10.1007/s00126-002-0277-4
    Mernagh, T. P., Trudu, A. G., 1993. A Laser Raman Microprobe Study of some Geologically Important Sulphide Minerals. Chemical Geology, 103(1/2/3/4):113-127. https://doi.org/10.1016/0009-2541(93)90295-t
    Movaghar, Y., Abedian, N., Borna, B., et al., 2011. Final Report on Silver and Gold Prospecting in the Area Latla-City B. Geological Map of Shahrbabak. Geological Survey & Mineral Exploration of Iran, Tehran. 309
    Murciego, A. M., Ayuso, E. A., Sanchez, A., et al., 2010. The Occurrence of Cd and Tl in the Sphalerite from El Losar del Barco Mine (Ávila, Spain): A Potential Environmental Hazard, Resumen SEM.
    Newton, T., 2013. Geochemistry of the Timberville Zn-Pb District, Rockingham County, VA: [Dissertation]. University of Maryland, Maryland
    Oen, I. S., Kager, P., Kieft, C., 1980. Oscillatory Zoning of a Discontinuous Solid-Solution Series:Sphalerite-Stannite. American Mineralogist, 65:1220-1232
    Ohmoto, H., 1972. Systematics of Sulfur and Carbon Isotopes in Hydrothermal Ore Deposits. Economic Geology, 67(5):551-578. https://doi.org/10.2113/gsecongeo.67.5.551
    Ohmoto, H., Rye, R. O., 1979. Isotopes of Sulphur and Carbon. In: Barne, H. L., ed., Geochemistry of Hydrothermal Ore Deposits. Willey Interscience, New York. 509-567
    Osadchii, E. G., Gorbaty, Y. E., 2010. Raman Spectra and Unit Cell Parameters of Sphalerite Solid Solutions (FexZn1-xS). Geochimica et Cosmochimica Acta, 74(2):568-573. https://doi.org/10.1016/j.gca.2009.10.022
    Padyar, F., 2017. The Nature and Evolution of Magmas and Hydrothermal Fluids Associated With Miduk PCD and Latala Vein Type Deposits: [Dissertation]. University of Shahed Beheshti, Tehran. 220
    Padyar, F., Rahgoshay, M., Alirezaei, S., et al., 2017a. Evolution of the Mineralizing Fluids and Possible Genetic Links between Miduk Porphyry Copper and Latala Vein Type Deposits, Kerman Copper Belt, South Iran. Journal of the Geological Society of India, 90(5):558-568. https://doi.org/10.1007/s12594-017-0752-2
    Padyar, F., Rahgoshay, M., Tarantola, A., et al., 2017b. Cathodoluminescence, Microthermometry and Laser Raman Spectroscopy Study of Hydrothermal Quartz in Latala Deposit, Central Iran. Scientific Quarterly Journal of Geosciences, Iran, 26:39-56
    Padyar, F., Rahgoshay, M., Tarantola, S., et al., 2017c. Evidences of Boiling in Fluid Inclusions and Distribution Metals during Mineralization in Latala Epithermal Base and Precious Metal Deposit, Northern Miduk Copper Deposit, Iran. Iranian National Fluid Inclusion Conference. Nov. 16, 2017. University of Zanjan, Zanjan
    Pasteris, J. D., Kuehn, C. A., Bodnar, R. J., 1986. Applications of the Laser Raman Microprobe RAMANOR U-1000 to Hydrothermal Ore Deposits; Carlin as an Example. Economic Geology, 81(4):915-930. https://doi.org/10.2113/gsecongeo.81.4.915
    Pirajno, F., 2009. Hydrothermal Processes and Mineral Systems. Geological Survey of Western Australia. Geological Survey of Western Australia, Perth. 1250
    Pokrovski, G. S., Borisova, A. Y., Bychkov, A. Y., 2013. Speciation and Transport of Metals and Metalloids in Geological Vapors. Reviews in Mineralogy and Geochemistry, 76(1):165-218. https://doi.org/10.2138/rmg.2013.76.6
    Richards, J. P., 2009. Postsubduction Porphyry Cu-Au and Epithermal Au Deposits:Products of Remelting of Subduction-Modified Lithosphere. Geology, 37(3):247-250. https://doi.org/10.1130/g25451a.1
    Richards, J. P., Kerrich, R., 1993. The Porgera Gold Mine, Papua New Guinea; Magmatic Hydrothermal to Epithermal Evolution of an Alkalic-Type Precious Metal Deposit. Economic Geology, 88(5):1017-1052. https://doi.org/10.2113/gsecongeo.88.5.1017
    Richards, J. P., Razavi, A. M., Spell, T. L., et al., 2018. Magmatic Evolution and Porphyry-Epithermal Mineralization in the Taftan Volcanic Complex, Southeastern Iran. Ore Geology Reviews, 95:258-279. https://doi.org/10.1016/j.oregeorev.2018.02.018
    Rickard, D., Willden, M. Y., Marinder, N. E., et al., 1979. Studies of the Genesis of the Laisvall Sandstone Lead-Zinc Deposit, Sweden. Economic Geology, 74(5):1255-1285. https://doi.org/10.2113/gsecongeo.74.5.1255
    Roedder, E., 1977. Fluid Inclusion Studies of Ore Deposits in the Viburnum Trend, Southeast Missouri. Economic Geology, 72(3):474-479. https://doi.org/10.2113/gsecongeo.72.3.474
    Rye, R. O., 1993. The Evolution of Magmatic Fluids in the Epithermal Environment; The Stable Isotope Perspective. Economic Geology, 88(3):733-752. https://doi.org/10.2113/gsecongeo.88.3.733
    Rye, R. O., 2005. A Review of the Stable-Isotope Geochemistry of Sulfate Minerals in Selected Igneous Environments and Related Hydrothermal Systems. Chemical Geology, 215(1/2/3/4):5-36. https://doi.org/10.1016/j.chemgeo.2004.06.034
    Sakai, H., 1968. Isotopic Properties of Sulfur Compounds in Hydrothermal Processes. Geochemical Journal, 2(1):29-49. https://doi.org/10.2343/geochemj.2.29
    Sawkins, F. J., 1964. Lead-Zinc Ore Deposition in the Light of Fluid Inclusion Studies, Providence Mine, Zacatecas, Mexico. Economic Geology, 59(5):883-919. https://doi.org/10.2113/gsecongeo.59.5.883
    Seal, R. R., 2006. Sulfur Isotope Geochemistry of Sulfide Minerals. Reviews in Mineralogy and Geochemistry, 61(1):633-677. https://doi.org/10.2138/rmg.2006.61.12
    Seward, T. M., Barnes, H. L., 1997. Metal Transport by Hydrothermal Fluids. In: Barnes, H. L., ed., Geochemistry of Hydrothermal Ore Deposits. John Wiley and Sons Inc., New York. 235-285
    Shahabpour, J., 2007. Island-Arc Affinity of the Central Iranian Volcanic Belt. Journal of Asian Earth Sciences, 30(5/6):652-665. https://doi.org/10.1016/j.jseaes.2007.02.004
    Shang, L. B., Chou, I.-M., Lu, W. J., et al., 2009. Determination of Diffusion Coefficients of Hydrogen in Fused Silica between 296 and 523 K by Raman Spectroscopy and Application of Fused Silica Capillaries in Studying Redox Reactions. Geochimica et Cosmochimica Acta, 73(18):5435-5443. https://doi.org/10.1016/j.gca.2009.06.001
    Shepherd, T. J., Rankin, A. H., Alderton, D. H. M., 1985. A Practical Guide to Fluid Inclusion Studies. Blackie, London. 238
    Shikazono, N., 1973. Sphalerite-Carbonate-Pyrite Assemblage in Hydrothermal Veins and Its Bearing on Limiting the Environment of Their Deposition. Geochemical Journal, 7(2):97-114. https://doi.org/10.2343/geochemj.7.97
    Sillitoe, R. H., 2010. Porphyry Copper Systems. Economic Geology, 105:3-41. https://doi.org/10.2113/gsecongeo.105.1.3
    Sirbescu, M. L. C., Nabelek, P. I., 2003. Dawsonite:An Inclusion Mineral in Quartz from the Tin Mountain Pegmatite, Black Hills, South Dakota. American Mineralogist, 88(7):1055-1059. https://doi.org/10.2138/am-2003-0714
    Tarantola, A., Caumon, M. C., 2015. Raman Spectra of Water in Fluid Inclusions:II. Effect of Negative Pressure on Salinity Measurement. Journal of Raman Spectroscopy, 46(10):977-982. https://doi.org/10.1002/jrs.4668
    Tauson, V. L., Chernyshev, L. V., 1977. Phase Relationships and Structural Features of ZnS-CdS Mixed Crystals. Geochemistry International, 14:11-22
    Voudouris, P., Mavrogonatos, C., Rieck, B., et al., 2018. The Gersdorffite- Bismuthinite-Native Gold Association and the Skarn-Porphyry Mineralization in the Kamariza Mining District, Lavrion, Greece. Minerals, 8(11):531. https://doi.org/10.3390/min8110531
    Voudouris, P., Mavrogonatos, C., Spry, P. G., et al., 2019. Porphyry and Epithermal Deposits in Greece: An Overview, New Discoveries, and Mineralogical Constraints on Their Genesis. Ore Geology Reviews, 107: 654-691. https://doi.org/10.1016/j.oregeorev.2019.03.019
    Wang, G. G., Ni, P., Wang, R. C., et al., 2013. Geological, Fluid Inclusion and Isotopic Studies of the Yinshan Cu-Au-Pb-Zn-Ag Deposit, South China:Implications for Ore Genesis and Exploration. Journal of Asian Earth Sciences, 74:343-360. https://doi.org/10.1016/j.jseaes.2012.11.038
    Williams-Jones, A. E., Heinrich, C. A., 2005. Vapor Transport of Metals and the Formation of Magmatic-Hydrothermal Ore Deposits. Economic Geology, 100(7):1287-1312. https://doi.org/10.2113/100.7.1287
    Wopenka, B., Pasteris, J. D., 1986. Limitations to Quantitative Analysis of Fluid Inclusions in Geological Samples by Laser Raman Microprobe Spectroscopy. Applied Spectroscopy, 40(2):144-151. https://doi.org/10.1366/0003702864509592
    Yigit, O., 2009. Mineral Deposits of Turkey in Relation to Tethyan Metallogeny:Implications for Future Mineral Exploration. Economic Geology, 104(1):19-51. https://doi.org/10.2113/gsecongeo.104.1.19
  • Relative Articles

    [1]Lili Gui, Xuesong Lu, Shaobo Liu, Xiaowen Guo, Shihua Yao, Mengzhen Hao, Weiyan Chen, Li Yuan, Chunling Wang, Keyu Liu. Diagenesis and timing of hydrocarbon fluid charge in the Eocene reservoir of the SW Qaidam Basin, western China[J]. Journal of Earth Science. doi: 10.1007/s12583-025-0217-2
    [2]Cecilia Pavón Pivetta, Leonardo Benedini, Paulo Marcos, Ma. Agustina Cócola, Mercedes Virginia Barros, Daniel Gregori, Leonardo Strazzere, Anderson Costa dos Santos, Mauro C. Geraldes. Characterization of Arroyo Verde Epithermal Deposit: Paragenesis, Mineral Geochemistry, Geochronology and Fluid Inclusions in Lower Chon Aike Volcanism, Argentina[J]. Journal of Earth Science, 2024, 35(1): 62-84. doi: 10.1007/s12583-023-1823-5
    [3]Lin Liang, Guibin Zhang, Shengxuan Huang, Jingjing Niu, Dongzhou Zhang, Jingui Xu, Wen Liang, Shan Qin. High-Pressure Behavior of Ferromagnesite (Mg0.81Fe0.19)CO3 by Synchrotron X-Ray Diffraction and Raman Spectroscopy up to 53 GPa[J]. Journal of Earth Science, 2024, 35(2): 525-535. doi: 10.1007/s12583-021-1495-y
    [4]Javad Sharifi, Seyed Naser Raisossadat, Maryam Mortazavi Mehrizi, Maryam Motamedalshariati. Carbon Isotope Stratigraphy of the Uppermost Aptian–Lower Cenomanian Strata from the Lut Block, East Iran[J]. Journal of Earth Science, 2023, 34(6): 1793-1799. doi: 10.1007/s12583-023-1911-4
    [5]Fazilat Yousefi, Ryan D. Mills, Mahmoud Sadeghian, David R. Lentz, Christina Wanhainen, Habibollah Ghasemi, Laicheng Miao. Geochemical and Nd-Sr Isotopic Compositions of Hypabyssal Adakites in the Torud-Ahmad Abad Magmatic Belt, Northern Central Iran Zone: Analysis of Petrogenesis and Geodynamic Implications[J]. Journal of Earth Science, 2021, 32(6): 1428-1444. doi: 10.1007/s12583-020-1378-7
    [6]Girish Kumar Mayachar, Subhasish Ghosh. Fluid Inclusion Characteristics of Tungsten Mineralization in the Agargaon Area of Sakoli Fold Belt, Central India[J]. Journal of Earth Science, 2020, 31(3): 559-570. doi: 10.1007/s12583-019-1271-4
    [7]He Yang, Wanli Ma, Rui Wang, Xueli Ma, Keyong Wang. Factors Controlling Deposition of Metallic Minerals in the Meng'entaolegai Ag-Pb-Zn Deposit, Inner Mongolia, China: Evidence from Fluid Inclusions, Isotope Systematics, and Thermodynamic Model[J]. Journal of Earth Science, 2020, 31(2): 271-286. doi: 10.1007/s12583-019-1273-2
    [8]Lei Shu, Kun Shen, Renchao Yang, Yingxin Song, Yuqin Sun, Wei Shan, Yuxin Xiong. SEM-CL Study of Quartz Containing Fluid Inclusions in Wangjiazhuang Porphyry Copper (-Molybdenum) Deposit, Western Shandong, China[J]. Journal of Earth Science, 2020, 31(2): 330-341. doi: 10.1007/s12583-019-1025-3
    [9]Abdolreza Partabian, Ahmad Nourbakhsh, Khalil Sarkarinejad. Folded Radiolarite Unit as a Kinematic Indicator of the Zagros Collision Processes, Southwestern Iran[J]. Journal of Earth Science, 2018, 29(1): 210-222. doi: 10.1007/s12583-017-0820-y
    [10]Rong-Guo Hu, Xiu-Juan Bai, Jan Wijbrans, Fraukje Brouwer, Yi-Lai Zhao, Hua-Ning Qiu. Occurrence of Excess 40Ar in Amphibole: Implications of 40Ar/39Ar Dating by Laser Stepwise Heating and in vacuo Crushing[J]. Journal of Earth Science, 2018, 29(2): 416-426. doi: 10.1007/s12583-017-0947-x
    [11]Rahim Mahari, Somaieh Sadigh Janbehan. Cretaceous Carbonate Deposits of Neotethys Ocean in the Northwest of Iran[J]. Journal of Earth Science, 2017, 28(3): 555-562. doi: 10.1007/s12583-017-0685-0
    [12]Fatemeh Sepidbar, Hassan Mirnejad. Mineralogy, geochemistry and geotectonic of plagiogranites from Shahre-Babak ophiolite, Zagros zone, Iran[J]. Journal of Earth Science, 2016, 27(3): 507-518. doi: 10.1007/s12583-016-0668-6
    [13]Yingying Liu, Liang Qi, Jianfeng Gao, Lin Ye, Zhilong Huang, Jiaxi Zhou. Re-Os dating of galena and sphalerite from lead-zinc sulfide deposits in Yunnan Province, SW China[J]. Journal of Earth Science, 2015, 26(3): 343-351. doi: 10.1007/s12583-015-0539-6
    [14]Solmaz Arzaghi, Massih Afghah. Diagenetic Aspects of the Lower Paleocene Sachun Formation Carbonates, Zagros Basin, Southwestern Iran[J]. Journal of Earth Science, 2014, 25(5): 884-894. doi: 10.1007/s12583-014-0480-0
    [15]Babak Samani. Tectonic Setting of the Barm Firuz Lake, Zagros Mountains, Iran: Inferred from Structural and Karstic Evidence[J]. Journal of Earth Science, 2014, 25(5): 932-938. doi: 10.1007/s12583-014-0474-y
    [16]Pouran Behnia, Lorence G Collins, Bahram A Samani. K- and Si-Metasomatism, Mineral Transformation and Formation of Granitoids from Basic Rocks in Qooshchi Area, NW Iran: A Mineralogical Context[J]. Journal of Earth Science, 2003, 14(1): 34-41.
    [17]Lu Wang, Zhenmin Jin, Mouchun He. Raman Spectrum Study on Quartz Exsolution in Omphacite of Eclogite and Its Tectonic Significances[J]. Journal of Earth Science, 2003, 14(2): 119-126.
    [18]Yazdi Mehdi, Shirani Manizheh. First Research on Marine and Nonmarine Sedimentary Sequences and Micropaleontologic Significance across Permian/Triassic Boundary in Iran (Isfahan and Abadeh)[J]. Journal of Earth Science, 2002, 13(2): 172-176.
    [19]Javad Moghaddasi Seyed, Shuzhen Yao, Xinbiao Lü. Determination of Salinity in Fluid Inclusions with Laser Raman Spectroscopy Technique[J]. Journal of Earth Science, 2000, 11(4): 406-409.
    [20]V. N. Golubev, I. V. Chernyshev, B. T. Kochkin, N. N. Tarasov, G. V. Ochirova, A. V. Chugaev. Uranium Isotope Variations (234U/238U and 238U/235U) and Behavior of U-Pb Isotope System in the Vershinnoe SandstoneType Uranium Deposit, Vitim Uranium Ore District, Russia[J]. Journal of Earth Science. doi: doi.org/10.1007/s12583-021-1436-9
  • Created with Highcharts 5.0.7Amount of accessChart context menuAbstract Views, HTML Views, PDF Downloads StatisticsAbstract ViewsHTML ViewsPDF Downloads2024-052024-062024-072024-082024-092024-102024-112024-122025-012025-022025-032025-0402.557.51012.515
    Created with Highcharts 5.0.7Chart context menuAccess Class DistributionFULLTEXT: 38.0 %FULLTEXT: 38.0 %META: 58.6 %META: 58.6 %PDF: 3.4 %PDF: 3.4 %FULLTEXTMETAPDF
    Created with Highcharts 5.0.7Chart context menuAccess Area Distribution其他: 1.0 %其他: 1.0 %Argentina: 0.4 %Argentina: 0.4 %Australia: 0.4 %Australia: 0.4 %Brazil: 1.2 %Brazil: 1.2 %Canada: 1.1 %Canada: 1.1 %Chile: 0.3 %Chile: 0.3 %China: 39.0 %China: 39.0 %Colombia: 0.5 %Colombia: 0.5 %Estonia: 0.2 %Estonia: 0.2 %Ethiopia: 0.2 %Ethiopia: 0.2 %Finland: 0.6 %Finland: 0.6 %France: 0.7 %France: 0.7 %Germany: 0.7 %Germany: 0.7 %Greece: 0.6 %Greece: 0.6 %India: 2.0 %India: 2.0 %Indonesia: 1.1 %Indonesia: 1.1 %Iran (ISLAMIC Republic Of): 9.0 %Iran (ISLAMIC Republic Of): 9.0 %Italy: 0.4 %Italy: 0.4 %Japan: 0.5 %Japan: 0.5 %Lao People's Democratic Republic: 0.3 %Lao People's Democratic Republic: 0.3 %Morocco: 0.3 %Morocco: 0.3 %Other: 0.2 %Other: 0.2 %Reserved: 2.6 %Reserved: 2.6 %Romania: 0.9 %Romania: 0.9 %Russian Federation: 5.8 %Russian Federation: 5.8 %Slovenia: 0.5 %Slovenia: 0.5 %South Africa: 0.3 %South Africa: 0.3 %Switzerland: 0.5 %Switzerland: 0.5 %Turkey: 0.3 %Turkey: 0.3 %United Kingdom: 1.0 %United Kingdom: 1.0 %United States: 27.4 %United States: 27.4 %罗奥尔凯埃: 0.2 %罗奥尔凯埃: 0.2 %其他ArgentinaAustraliaBrazilCanadaChileChinaColombiaEstoniaEthiopiaFinlandFranceGermanyGreeceIndiaIndonesiaIran (ISLAMIC Republic Of)ItalyJapanLao People's Democratic RepublicMoroccoOtherReservedRomaniaRussian FederationSloveniaSouth AfricaSwitzerlandTurkeyUnited KingdomUnited States罗奥尔凯埃

Catalog

    通讯作者: 陈斌, bchen63@163.com
    • 1. 

      沈阳化工大学材料科学与工程学院 沈阳 110142

    1. 本站搜索
    2. 百度学术搜索
    3. 万方数据库搜索
    4. CNKI搜索

    Figures(9)  / Tables(3)

    Article Metrics

    Article views(588) PDF downloads(33) Cited by()
    Proportional views
    Related

    /

    DownLoad:  Full-Size Img  PowerPoint
    Return
    Return