
Citation: | Heng Peng, Jianqiang Wang, Chiyang Liu, Shaohua Zhang, Yazhuo Niu, Tianbing Zhang, Bo Song, Wei Han. Mesozoic Tectonothermal Evolution of the Southern Central Asian Orogenic Belt: Evidence from Apatite Fission-Track Thermochronology in Shalazha Mountain, Inner Mongolia. Journal of Earth Science, 2023, 34(1): 37-53. doi: 10.1007/s12583-020-1053-z |
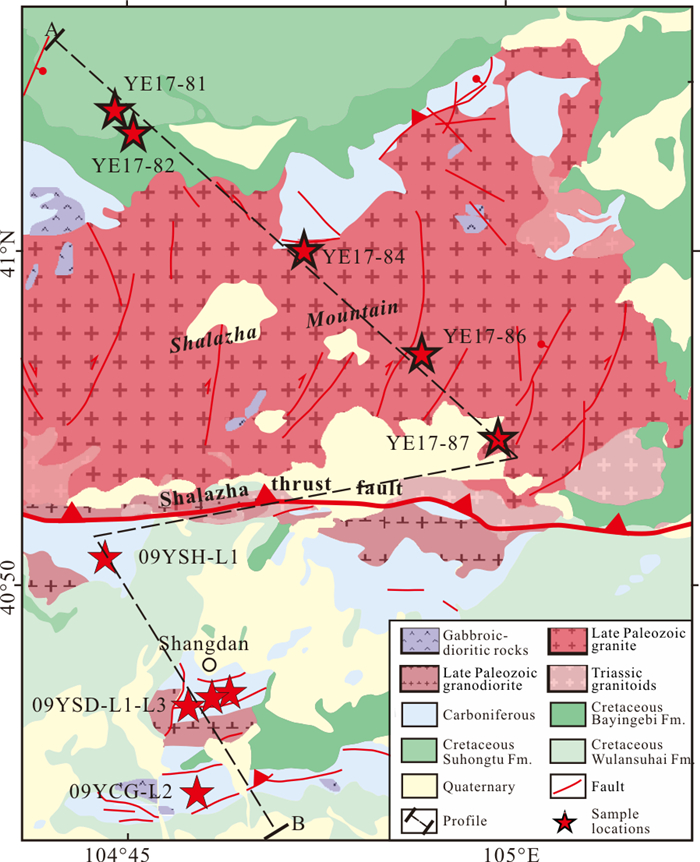
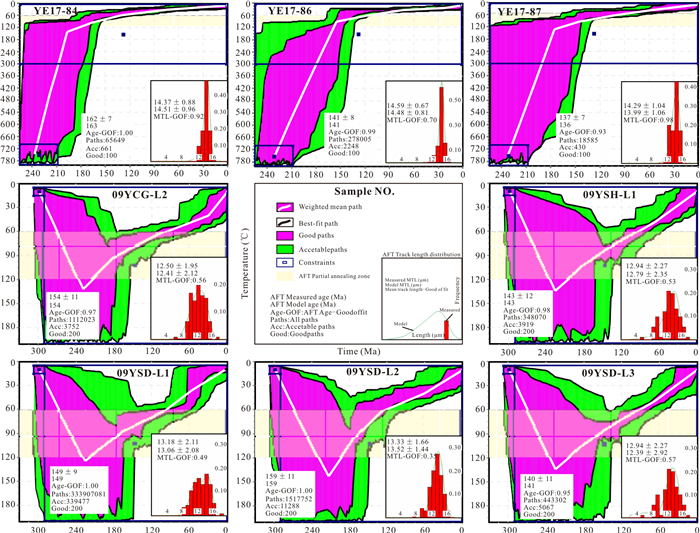
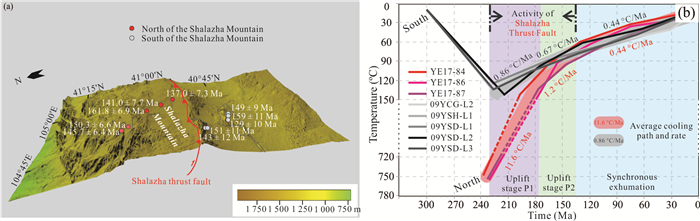
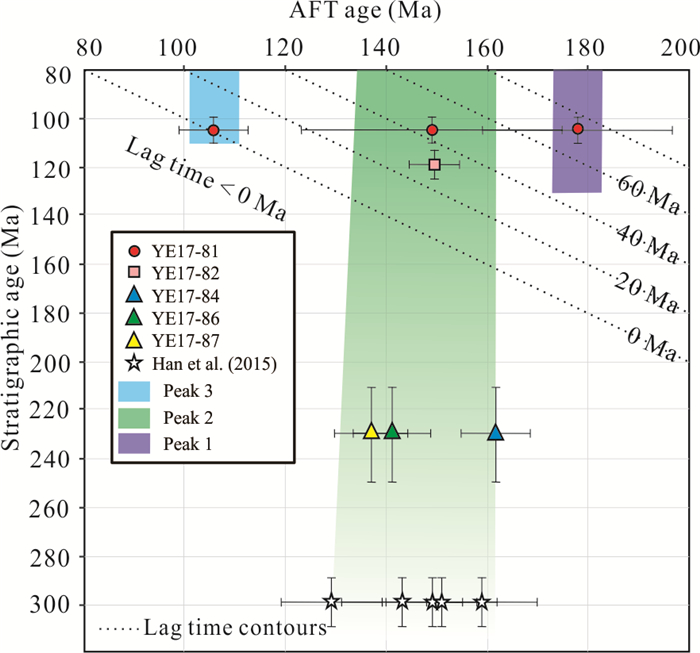
Mesozoic intracontinental orogeny and deformation were widespread within the southern Central Asian Orogenic Belt (CAOB). Chronological constraints remain unclear when assessing the Mesozoic evolution of the central segment of this region. The tectonic belt of Shalazha Mountain located in the center of this region is an ideal place to decode the deformation process. Apatite fission-track (AFT) thermochronology in Shalazha Mountain is applied to constrain the Mesozoic tectonothermal evolution of the central segment of southern CAOB. The bedrock AFT ages range from 161.8 ± 6.9 to 137.0 ± 7.3 Ma, and the first reported detrital AFT obtained from Lower Cretaceous strata shows three age peaks: P1 (ca. 178 Ma), P2 (ca. 149 Ma) and P3 (ca. 105.6 Ma). Bedrock thermal history modeling indicates that Shalazha Mountain have experienced three stages of differential cooling: Late Triassic–Early Jurassic (~230–174 Ma), Late Jurassic–Earliest Cretaceous (~174–135 Ma) and later (~135 Ma). The first two cooling stages are well preserved by the detrital AFT thermochronological result (P1, P2) from the adjacent Lower Cretaceous strata, while P3 (ca. 105.6 Ma) records coeval volcanic activity. Furthermore, our data uncover that hanging wall samples cooled faster between the Late Triassic and the Early Cretaceous than those from the footwall of Shalazha thrust fault, which synchronizes with the cooling of the Shalazha Mountain and implies significant two-stage thrust fault activation between ca. 230 and 135 Ma. These new low-temperature thermochronological results from the Shalazha Mountain region and nearby reveal three main phases of differential tectonothermal events representing the Mesozoic reactivation of the central segment of the southern CAOB. In our interpretations, the initial rapid uplift in the Late Triassic was possibly associated with intracontinental orogenesis of the CAOB. Subsequent Middle Jurassic–Earliest Cretaceous cooling is highly consistent with the Mesozoic intense intraplate compression that occurred in the southern CAOB, and is interpreted as a record of closure of the Mongol-Okhotsk Ocean. Then widespread Cretaceous denudation and burial in the adjacent fault basin could be linked with the oblique subduction of the Izanagi Plate along the eastern Eurasian Plate, creating a northeast-trending normal fault and synchronous extension. However, our AFT thermochronometry detects no intense Cenozoic reactivation information of Shalazha Mountain region.
The Central Asian Orogenic Belt (CAOB) is the largest tectonic collage known to be present between the Siberian and Karakum-North China-Tarim cratons (Fig. 1a). This tectonic belt developed via multiple subductions and collisional processes alongside closure of the Paleo-Asian Ocean (Zhao X C et al., 2020a; Xiao et al., 2018, 2003; Zhao G C et al., 2018; Shi et al., 2014; Zhang et al., 2009; Windley et al., 2007). Subsequent to southern Paleo-Asian Ocean closure, four main tectonic events are known to have occurred along the margins of the Meso-Cenozoic Eurasian Continent: The Mesozoic closure of the Paleo- and Meso-Tethys Oceans that span the southern Eurasian margin. Siberia then collided with the amalgamated North China-Mongolia Block along the Mongol-Okhotsk suture between the Middle and Late Jurassic, before Cretaceous oblique subduction of the Izanagi Plate along the eastern Eurasian Continent. Collision between India and Eurasia then took place in the Cenozoic (Zhao et al., 2020b; Jiang et al., 2019; Tao et al., 2019; Song et al., 2018; Gillespie et al., 2017; Glorie and Grave, 2016; Yang et al., 2015; Yin, 2010; Vassallo et al., 2007; Meng, 2003; Ren et al., 2002; Tapponnier et al., 1982), the event which can be attributed to Mesozoic orogeny and intracontinental deformation. This kind of deformation seems to have been generally widespread across the southern CAOB, occurring at a regional scale under the background of plate convergence across East Asia (Liu et al., 2019; Shi et al., 2019; Zhang, 2019; Dong et al., 2018; Xu et al., 2018; Gillespie et al., 2017; Zuo et al., 2015). This contrasts with uplift during the Late Cretaceous–Cenozoic, which appears to have been strongly localized and weak (Gillespie et al., 2017).
The Yingen-Ejinaqi Basin is located between the central segment of the southern CAOB and northern Alxa (Fig. 1b). The Paleo-Asian Ocean final closed in the Early–Middle Permian along the northern Alxa Block (Zhang, 2019; Hu et al., 2015; Zhang et al., 2013). Thermal and tectonic subsidence histories of the Chagan sag (Zuo et al., 2015), Shuhongtu sag (Han, 2017), and Juyanhai sag (Guan, 2019; Han, 2017) in the northern Yingen-Ejinaqi Basin within the southern CAOB were subjected to multiple-stage exhumation during Early Triassic, Middle Jurassic–Late Jurassic and at end of the Late Cretaceous, while subsidence throughout the Early Cretaceous–Early Late Cretaceous can be inferred via the vitrinite reflectance (Ro) of borehole samples and the interpretation of seismic profiles (Guan, 2019; Zhang, 2019; Han, 2017). Shalazha Mountain comprises an uplift region within the eastern Yingen-Ejinaqi Basin, mainly composed of pre-Triassic rocks (Bureau of Geology and Mineral Resources of Inner Mongolia Autonomous Region, 2001). Inferred time periods for these exhumations remain inexact due to a lack of sedimentary records, especially from Triassic and Jurassic strata. In addition, the southern CAOB formed from the aggregation of several microplates and involves multiple suture (fault) units (Xiao et al., 2018); weak zone within this structure has the potential to be activated as they are controlled by faulting (Tapponnier et al., 1982). Shalazha Mountain lies between the Quaganqulu and Enger Us suture belts (Figs. 1b and 1c); fault activity in this area has been strong since the Mesozoic (Zhang, 2019). Geological features show that Jurassic thrust and fold (Zheng et al., 1996), Cretaceous rift (Meng, 2003), and Cenozoic strike-slip and normal faults (Yue and Liou, 1999) developed in surrounding areas adjacent to Shalazha Mountain even though active-fault times remain uncertain. In contrast to the four main tectonothermal events recorded in the Tianshan throughout the Triassic, Late Jurassic–Cretaceous, Late Cretaceous–Paleogene and Neogene (Yin et al., 2018; Glorie and Grave, 2016; Wang et al., 2009), three distinct phases of fold and fast exhumation occurred within the Beishan at ca. 225–180, ca. 130–95 and ca. 75–60 Ma (Gillespie et al., 2017; Tian et al., 2016). Similarly, two stages of uplift were seen in the Gobi-Altay during the Late Triassic–Cretaceous and lasted ca. 5 ± 3 Ma (Jolivet et al., 2007; Vassallo et al., 2007; Dumitru and Hendrix, 2001), while five stages of cooling were seen within the Langshan at ca. 220–100, ca. 160–100, ca. 90–70, ca. 50–45, and ca. 20–10 Ma (Cui et al., 2018; Feng et al., 2017). Although three periods of exhumation within mentioned several sags are seen in the inner Yingen-Ejinaqi Basin (Liu X et al., 2017; Han et al., 2015, 2014; Zuo et al., 2015), the uplift and exhumation history of the Shalazha Mountain is poorly understood because of the absence of chronology constraints and sedimentary records due to harsh natural conditions.
As the Shalazha Mountain region generally lacks sedimentary records and is characterized by extensive historical stratigraphic gaps, thermochronology is one potentially useful method that can furnish effective constraints on regional evolution by sampling old rocks for modeling analysis (Yu et al., 2019; Yang et al., 2017; Gallagher, 2012; Ketcham, 2005). Younger sedimentary strata can be used for detrital analysis as they may contain thermal information regarding provenance (Bernet and Garver, 2005; Zattin et al., 2003). Additionally, the timing of hanging wall exhumation is synchronous with the onset of rapid cooling, while the cooling rate of the hanging wall is faster than that of the footwall in a thrust fault (Metcalf et al., 2009). Thermochronology can also be used to ascertain the epoch of thrust fault activity because of age distribution and differing thermal history across the fault (Zattin and Wang, 2019; Malusà and Fitzgerald, 2018; Metcalf et al., 2009).
In this study, we conducted field observations as well as detrital and bedrock apatite fission-track (AFT) analyses on both sediment and bedrock samples, respectively, in order to elucidate the Mesozoic cooling history of Shalazha Mountain in the southern CAOB region. The picture generated regarding uplift, cooling history, and fault activation within Shalazha Mountain in the southern CAOB region can be linked to interactions amongst Asian plates. This research therefore provides new insights into tectonothermal evolution and intracontinental deformation of the central segment of the southern CAOB.
Shalazha Mountain is located in the southern margin of the CAOB (Fig. 1b). Numerous active strike-slip, thrust, and normal faults contribute to the continuing growth of Shalazha Mountain; the EW-trending Shalazha thrust fault separates this mountain into two part, north and south. Ancient strata that make-up Shalazha Mountain mainly comprise Carboniferous–Permian strata (Bureau of Geology and Mineral Resources of Inner Mongolia Autonomous Region, 2001) and are considered to be subduction-related, volcanic-sedimentary unity (Xiao et al., 2003), most of which are exposed to the south of Shalazha Mountain. Shalazha Mountain sequences are mainly composed of magmatic rocks which formed predominantly in three major pulses represented by Caledonian, Variscan, and Indosinian granitoids (Liu Q et al., 2017). Caledonian and Variscan plutonic rocks were formed by subduction while the Indosinian granitoids were emplaced in a post-collisional setting (Zheng et al., 2014). Subsequent to the closure of the Paleo-Asian Ocean, this region developed to an intracontinental evolutionary phase as a result of intense compression and thrust (Shi et al., 2019; Dumitru and Hendrix, 2001). The Triassic and Jurassic strata in this region are limited in extent and unconformable overlie the Carboniferous–Permian units. A wide extensional basin system developed in the China-Mongolia border region during the Early Cretaceous–earliest Late Cretaceous prior to rifting, as evidenced by a thick sedimentary succession (Meng et al., 2003). This was then subsequently uplifted and received sediments throughout the Quaternary to form the well-known present-day Alxa Desert (Wang, 1990).
In order to explore the Mesozoic tectonothermal evolution of the southern CAOB, we collected ten samples along a ca.30 km long transect, trending roughly NW-SE and transecting Shalazha Mountain (Fig. 2). Three granite bedrock samples (YE17-84, YE17-86, and YE17-87) from Oliji Pluton were collected within the north of the Shalazha Mountain area, including the hanging wall of Shalazha thrust fault. These samples have crystallization ages that range between ca. 254 and 208 Ma (Liu Q et al., 2017; Zhao et al., 2016; Shi et al., 2014), while two detrital samples (YE17-81, YE17-82) were collected from the Lower Cretaceous pebbly sandstone intercalated in conglomerate layers. In addition, five published Carboniferous–Permian Amushan Formation sedimentary samples within the footwall of the Shalazha thrust fault from the south of Shalazha Mountain were extracted from data published by Han et al. (2015). The fusulinids assemblages from Amushan Formation suggest that it should be assigned to the Late Carboniferous–Early Permian period (Bu et al., 2012). Detailed lithological and locational information for each sample can be found in Table 1 and Figs. 2 and 3.
Sample No. | Era | Lithology | Coordinate (N/E) | Elevation (m) | Dating method | |
YE17-81 | K1s | Pebbly sandstone | 41º03′55″ | 104º44′47″ | 1 260 | AFT |
YE17-82 | K1b2 | Pebbly sandstone | 41º03′15″ | 104º45′41″ | 1 380 | AFT |
YE17-84 | P–T | Biotite granite | 40º59′53″ | 104º53′24″ | 1 380 | AFT |
YE17-86 | P–T | Biotite granite | 40º56′39″ | 104º56′18″ | 1 360 | AFT |
YE17-87 | P–T | Monzonitic granite | 40º54′21″ | 104º59′16″ | 1 380 | AFT |
09YSH-L1 | C2–P1 | Sandstone | 40º49′29.7″ | 104º44′50.9″ | 1 430 | AFT* |
09YSD-L1 | C2–P1 | Sandstone | 40º46′30.0″ | 104º50′15.4″ | 1 380 | AFT* |
09YSD-L2 | C2–P1 | Sandstone | 40º46′30.0″ | 104º50′15.4″ | 1 380 | AFT* |
09YSD-L3 | C2–P1 | Sandstone | 40º46′30.0″ | 104º50′15.4″ | 1 380 | AFT* |
09YCG-L2 | C2–P1 | Sandstone | 40º43′14.1″ | 104º48′00.2″ | 1 270 | AFT* |
*Data from Han et al. (2015). |
Apatite grains were extracted from samples using standard heavy liquid, magnetic, and handpicking approaches at the Mineral Separation Center of the Bureau of Geology and Mineral Resources of Langfang, China. A series of steps for sample preparation and analysis were then undertaken at the Fission-Track Laboratory, Department of Geology, Northwest University, China, using the external-detector and zeta (ζ)-calibration approach (Hurford and Green, 1983) based on International Union of Geological Sciences age standards (Hurford, 1990). Thus, in the first place, apatite mounts in epoxy resin were ground and polished to expose maximum grain internal surfaces which were then etched with 5.5N HNO3 at 20 ℃ for 20 s to reveal the spontaneous tracks. Low-uranium muscovite was then used as the external detector while standard uranium glass IRRM540 was used as the dosimeter to detect irradiation neutron fluence. Samples were then irradiated with thermal neutrons in the reactor at the Radiation Center of Oregon State University, United States, using stable nominal neutron fluence. Induced fission-tracks in the muscovite detector were revealed by etching with 40% HF at 20 ℃ for 40 min. Counting the number of spontaneous, induced tracks within a fixed area, the lengths of the spontaneous confined tracks and corresponding Dpar values were ascertained using transmitted light microscopy of Zeiss Axioplan2.
Zeta values were obtained by dating standard Durango and Fish Canyon tuff apatite. All ages were calculated using the software TrackKey v 4.2 (Dunkl, 2002) with a weighted mean Zeta value of 233.74 ± 6.18 a/cm2. The software Radial Plotter 8.0 (Vermeesch, 2009) was then applied to dating results to produce a radial plot that clearly reveals single-grain age distributions and corresponding Dpar values. The chemical composition of grains can make their annealing properties more diverse (Ketcham et al., 2007a, b) and can also influence the AFT ages and lengths (Donelick et al., 2005; Barbarand et al., 2003; Carlson et al., 1999); Dpar values were therefore measured to represent grains chemical composition and constrain annealing kinetics. A χ2 test (Galbraith, 1981) was then performed on AFT age data to detect the presence of extra-Poissonian error. A probability of less than 5% denotes a mixed distribution, while a χ2 probability greater than, or equal to, 5% is indicative of a homogeneous population. The measured lengths of spontaneous confined tracks and ages with Dpar values were then used to inverse the thermal history of each sample based on geologic information.
Thermal history modeling provides a method to utilize the geological significance of AFT data (Ketcham, 2005). In this study, thermal history modeling is performed by software HeFTy 1.9.1 using a Monte-Carlo approach to simulate possible paths (Ketcham et al., 2007a; Ketcham, 2005). Thermal history modeling paths were calculated in tandem with existing geological information; thus, the constraints used for inversion modeling in this analysis include an initial magma emplacement age between ca. 254 and ca. 208 Ma at temperatures between 800 and 700 ℃ for YE-84, YE-86, and YE-87 (Liu Q et al., 2017; Zhao et al., 2016; Shi et al., 2014), a deposit age between ca. 307 and ca. 290 Ma for the five southern samples extracted from Bu et al. (2012), and a wide box and final current average surface temperature of 10 ± 5 ℃ for each sample. No further inserted constraints were applied. Inverse modeling was then performed randomly until 100 good paths were obtained; this resulted in more than 18 000 paths in total of which more than 400 were acceptable paths. Goodness-of-fit (GOF) values were then calculated to assess the relationship between measured and modeled data; these should be higher than 0.05 if results are to be considered credible.
At least 30 apatite grains were dated for each sample in this analysis. Central AFT ages define a narrow range between 161.8 ± 6.9 (YE17-84) and 137.0 ± 7.3 Ma (YE17-87), while mean confined track lengths range from 13.99 ± 1.06 (YE17-87) to 14.37 ± 0.88 μm (YE17-84). Result also show that AFT mean Dpar values vary slightly from 1.54 to 1.64 μm (Table 2). The Dpar value of single grain, measured range from 1.32–1.91 (YE17-84), 1.28–1.79 (YE17-86), and 1.32–1.72 μm (YE17-87) (Fig. 5). Data show that AFT ages of bedrock samples are all younger than their crystallization ages and pass the χ2-test (P(χ2) ≥ 5%); this implies that a single age population is present in these sample, which resulted from a cooling process after magma emplacement. Compared with northern samples, those collected from the south all have similar AFT ages that range between 159 ± 11 (09YSD-L2) and 140 ± 11 Ma (09YSD-L1) as well as shorter mean confined track lengths which range from 12.5 ± 2.0 (09YCG-L2) to 13.3 ± 1.7 μm (09YSG-L2) (Han et al., 2015). Details of the data are presented in Table 2.
Sample No. | N | ρs(Ns) | ρi(Ni) | ρd(Nd) | Chi-sq. P (%) | Central age (±1σ) (Ma) | Pooled age (±1σ) (Ma) | MTL (±1σ) (μm) (n) |
Dpar (μm) |
P3 (Ma) (%) | P2 (Ma) (%) | P1 (Ma) (%) |
YE17-81 | 106 | 13.614 (10 942) | 4.483 (3 603) | 4.165 (3 006) | 0 | 145.7 ± 6.4 | 146.2 ± 5.5 | 14.38 ± 0.83 (153) | 1.55 | 105.6 ± 6.9 (25.5%) | 149 ± 26 (33%) | 178 ± 19 (41%) |
YE17-82 | 78 | 11.945 (5 341) | 4.048 (1 810) | 4.380 (3 162) | 67.55 | 150.3 ± 6.6 | 149.3 ± 6.3 | 14.03 ± 1.22 (106) | 1.60 | 149.3 ± 5.8 (100%) | ||
YE17-84 | 62 | 9.293 (5 845) | 2.682 (1 687) | 4.047 (2 919) | 86.66 | 161.8 ± 6.9 | 161.8 ± 6.9 | 14.37 ± 0.88 (117) | 1.64 | 161.8 ± 45 (100%) | ||
YE17-86 | 43 | 6.437 (1 935) | 2.262 (680) | 4.285 (3 094) | 99.64 | 141.0 ± 7.7 | 141.0 ± 7.7 | 14.36 ± 0.81 (119) | 1.54 | 141 ± 6.3 (100%) | ||
YE17-87 | 30 | 12.02 (2 144) | 4.166 (743) | 4.106 (2 963) | 90.3 | 137.0 ± 7.3 | 137.0 ± 7.3 | 13.99 ± 1.06 (35) | 1.55 | 137 ± 6.9 (100%) | ||
09YSH-L1* | 28 | 4.896 (476) | 5.441 (529) | 8.239 (6 817) | 92.6 | 143 ± 12 | 143 ± 12 | 12.9 ± 2.3 (91) | n.d. | 143 ± 12 (100%) | ||
09YSD-L1* | 28 | 10.353 (1 722) | 11.021 (1 833) | 8.239 (6 817) | 46.6 | 149 ± 9 | 149 ± 9 | 13.2 ± 2.1 (112) | n.d. | 149 ± 9 (100%) | ||
09YSD-L2* | 28 | 7.056 (1 082) | 6.873 (1 054) | 8.072 (6 817) | 97.4 | 159 ± 11 | 159 ± 11 | 13.3 ± 1.7 (99) | n.d. | 159 ± 11 (100%) | ||
09YSD-L3* | 28 | 9.874 (2 210) | 11.379(2 547) | 8.072 (6 817) | 0 | 129 ± 10 | 135 ± 8 | 12.7 ± 1.7 (102) | n.d. | 129 ± 10 (100%) | ||
09YCG-L2* | 28 | 6.341 (857) | 6.659 (900) | 8.407 (6 817) | 45.1 | 154 ± 11 | 154 ± 11 | 12.5 ± 2.0 (106) | n.d. | 154 ± 11 (100%) | ||
Central ages calculated using dosimeter glass IRM540 and ξ‐IRRM540 = 233.74 ± 6.18 (analyst PH). ρs(Ns). spontaneous track densities (105 cm-2) and numbers measured in internal mineral surfaces; ρi(Ni). induced dosimeter track densities (105·cm-2) and numbers on external mica detectors; ρd(Nd). dosimeter track densities (105 cm-2) and numbers on external mica detectors; Chi-sq. P (%). probability of obtaining χ2‐test value, a probability > 5% is indicative of a homogenous population. Data were calculated using Track Key v 4.2 software (Dunkl, 2002). Radial Plotter automatically performs a χ2-test for statistical homogeneity of fission track data. For populations that have failed this test, Radial Plotter program implements the mixture modelling algorithm (Vermeesch, 2009). Data marked "*" cited from Han et al. (2015). |
Two Lower Cretaceous samples yield central AFT ages ranging narrowly from 145.7 ± 6.4 (YE17-81) to 150.3 ± 6.6 Ma (YE17-82) as well as mean confined track lengths of 14.38 ± 0.83 (YE17-81) and 14.03 ± 1.22 μm (YE17-82), respectively. Although their mean Dpar values for these samples fall within a narrow range between 1.55 (YE17-81) and 1.60 μm (YE17-82), two records range between 1.12 and 2.03 μm (YE17-81) and 1.20 and 2.16 μm (YE17-82), respectively, revealing a mixture of chemical compositions. At least 50 measured grains are required for most AFT detrital samples in order to obtain the main grain-age population (Garver et al., 1999); thus, to ensure a robust result, over 78 apatite grains were dated for each sample in this analysis. Detrital single grain AFT ages show a wide range; it is clear that the central AFT ages for two Lower Cretaceous samples are older than the stratigraphic ages with a lower χ2-test values. Dating results were then decomposed into three different grain-age populations (peaks) using the software Radial Plotter 8.0 (Vermeesch, 2009), an approach which yielded a similar distribution to use of the software Binomfit 1.2.63 (Brandon, 2002). These peaks included P1 (ca. 178 Ma), P2 (ca. 149 Ma), and P3 (ca. 105.6 Ma) (Fig. 4). All decomposed peaks recovered here were considered statistically reliable because each involves five or more grain-ages (Stewart and Brandon, 2004). Grain-age distributions with radial plots are shown in Fig. 4. Combining with bedrock AFT results, most grain ages fall within three age groups, P1 (ca. 178 Ma), P2 (161.8–137 Ma), and P3 (ca. 105.6 Ma) (Table 2).
Mean Dpar values for samples narrowly range between 1.54 and 1.64 μm (Table 2); indeed, both AFT ages and AFT lengths do not show obvious correlations with Dpar (Figs. 4 and 5), suggesting a minor (if any) contribution of chemical composition to large age spread.
Data show that AFT ages and mean track length GOF values of the modeling results for all eight samples are higher than 0.05 and close to 1, meaning they can be considered credible. Inverse thermal history models are presented in Fig. 6.
Modeling results suggest that every sample encapsulates two or three significant cooling stages; data also show that the cooling rate has decreased since the Late Triassic and that this rate in the north has been quite different to that seen in the south. Three northern granite samples continued to fast-cool after magma emplacement; on the basis of weighted mean path, YE17-84 cooled from 238 to 197 Ma at an average cooling rate of 14.9 ℃/Ma, then cooled from 197 to 130 Ma at an average cooling rate of 1.3 ℃/Ma, by passing the AFT partial annealing zone. Similarly, sample YE17-86 cooled from 230 to 156 Ma at an average cooling rate of 8.8 ℃/Ma, and then cooled again from 156 to 117 Ma at an average cooling rate of 0.85 ℃/Ma, by low to 60 ℃. YE17-87 cooled at three stages: rapid cooling between 232 and 177 Ma at an average cooling rate of 11.2 ℃/Ma, subsequent slower cooling from 177 to 143 Ma at an average cooling rate of 1.17 ℃/Ma, and then final cooling between 143 and 97 Ma at an average cooling rate of 0.72 ℃/Ma. This sample passed the AFT partial annealing zone within this final period. Although all northern samples then slowly cooled to the surface by ca.135 Ma, weighted mean paths for five southern samples show that they all experienced a similar cooling stage. These samples were heated and buried until approximately 230 Ma and then subsequently cooled slowly from ca. 230 to ca. 180–170 Ma. These samples then cooled much slower, and passed the AFT partial annealing zone at average cooling rates between 0.48 (09YSD-L1) and 0.88 ℃/Ma (09YSD-L2).
Thermal history modeling data obtained via bedrock AFT enable an enhanced understanding of the Shalazha Mountain exhumation history. A summarized thermal history model reveals entire mountain uplift since the Late Triassic as well as two periods of differential cooling at ~230–174 (T3–J1) and ~174–135 Ma (J2–K1) (Fig. 7.b). These two stages of cooling are clearly delineated by two groups of single grain zircon (U-Th)/He ages of 254–220 and 195–163 Ma recovered from the west of Shalazha Mountain (Zhang, 2019). More specifically, according to the average cooling path, the T3–J1 (uplift stage P1) cooled very fast at an average rate of 11.6 ℃/Ma in the north and an average rate of 0.86 ℃/Ma in the south, while the J2–K1 (uplift stage P2) cooled slowly with an average cooling rate of 1.2 ℃/Ma in the north and 0.67 ℃/Ma in the south. Converting cooling rates to denudation rates requires estimation of the geothermal gradient during exhumation. We therefore applied geothermal gradients of ca. 34–48 ℃/km since the Jurassic, deduced by measuring the vitrinite reflectance of samples taken from the well of the Yingen-Ejinaqi Basin (Han, 2017; Zuo et al., 2015). This means that, in terms of cooling rate, we were able to calculate average denudation rates of 290 (P1) and 30 m/Ma (P2) for a corresponding cooling period to the north of Shalazha Mountain, while these rates were 22 (P1) and 17 m/Ma (P2) in the south. On the basis of modeling results and the paleo geothermal gradient, it is calculated that ca. 20 km of crust was removed from the north of Shalazha Mountain and just 1.5 km of sediment was denudated from the south over the period between the Late Triassic and Early Cretaceous.
The two sides of the Shalazha thrust fault had cooled to the same temperature or elevation by ca. 135 Ma. Indeed, subsequent to the Early Cretaceous, the whole of Shalazha Mountain cooled more slowly at the same rate (ca. 0.44 ℃/Ma; Fig. 7); this indicates that the whole region experienced synchronous exhumation at a very low rate. In particular, northern bedrock AFT ages (> 130 Ma) are only a few million years younger than corresponding detrital AFT age peaks and both have similar track lengths. Modeling results show that Shalazha Mountain cooled to below 60 ℃ in the Late Cretaceous, followed by very slow subsequent cooling in the Cenozoic (although available thermochronological constraints are not lower at this time; Fig. 7). These results imply that denudation thickness or vertical movement of crust in the Shalazha Mountain region was limited and that there were no further important cooling events in the Cenozoic.
Unannealed detrital AFT analysis can provide robust cooling ages of provenance and reveal the thermal history of the closed source area (Bernet and Garver, 2005). It is fortunate that almost all AFT ages for the Lower Cretaceous detrital grains are older than their stratigraphic ages while erosion thicknesses obtained using vitrinite reflectance and acoustic times are all about 1 400 m (Qi et al., 2018). This means that post-Cretaceous strata are not thick enough to bury the samples to AFT partial annealing depths as their temperatures were not higher than 60 ℃ or samples remained for just short times at 120–60 ℃. Result show that detrital AFT ages fall within three age groups (Fig. 8), including P1 (ca. 178 Ma), P2 (ca. 149 Ma), and P3 (ca. 105.6 Ma). Confined track length distributions of detrital sediments show a long and unimodal character (with a mean track length of 14.03–14.38 μm), implying that these samples experienced a monotonic exhumation process. The distribution of AFT age populations in Lower Cretaceous sediments also suggest that apatite was derived from different resources; some of these might provide a diagnostic signal for sediment provenance compared with surrounding bedrock AFT ages.
The age peak of P2 revealed here is highly consistent with east Shalazha Mountain bedrock AFT ages as these falls between 162 and 129 Ma (Figs. 4 and 8) and west Shalazha Mountain bedrock AFT ages as these falls between 162.9 and 142.5 Ma (Zhang, 2019). Indeed, the AFT ages of 195.4–174.7 Ma similar to peak P1 was documented from the west of Shalazha Mountain (Zhang, 2019). The bulk of detrital apatite grains are characterized by self-forming, angular and wavy microstructural shapes (supplementary Fig. S1) indicative of short transport distances. A small proportion of grains are rounded, however, indicating that they may have been recycled from sedimentary strata. Field outcrops reveal two classes of Lower Cretaceous strata containing pebbly sandstones and some conglomerates, indicating a proximal source, while the gravel evidenced by sample YE17-82 is mainly granitic (Fig. 3). This means that most P1 grains were probably eroded from the west of Shalazha Mountain bedrock; and P2 grains were probably eroded from east and/or west of Shalazha Mountain bedrock as most AFT ages in this area are similar proximal to Lower Cretaceous detrital sediments. Combining with the Shalazha Mountain two stage cooling since Late Triassic–Early Cretaceous revealed by bedrock thermal history modeling, thus, we interpret that detrital AFT age peaks P1 and P2 record two-stage exhumation of the Shalazha Mountain.
Sample YE17-81 reveals another age peak ca.105.6 Ma (P3). A published AFT age of ca. 105 Ma has been reported from the Ejina Banner region (Han et al., 2014), far from this study area based on paleogeographic setting as a rift basin was present between Ejina Banner and Shalazha Mountain. Data show that the AFT lengths from Ejina Banner are shorter and so it is not possible that this region furnished material into the Shalazha region. Indeed, existing credible AFT data recorded from Shalazha Mountain region and its surroundings do not show an age lower or similar to ca. 105 Ma; we therefore believe that additional, as yet unknown, sources must have supplied material to this region. Grains are euhedral in shape under the microscope and exhibit a low degree of roundness while apatite grains have P3 lag-times around 0 Ma (Fig. 8); this indicates that these grains underwent rapid cooling over a very short time. These grains of P3 are therefore probably derived from contemporaneous paleo-volcanic material or the adjacent Shalazha Mountain magma as they exhibit a high denudation rate. The above discussion has ruled out near-object magma as a potential source, confirmed via the deposition of volcanic material and absence of similar AFT age. Field observations show that the sample site for YE17-81 contains a higher proportion of black basaltic gravel than is the case for YE17-82 (Fig. 3). Paleo-volcanic vents in Early Cretaceous strata to the north of Shalazha Mountain (Fig. 9d), combined with high geothermal gradients increasing to 50–60 ℃/km in the late Early Cretaceous (Chen et al., 2019; Zuo et al., 2015) indicates contemporaneous thermal fluid activity. There was indeed a good deal of volcanic activity during the Early Cretaceous Shuhongtu Formation period. Borehole data suggest that these deposits formed between 119 and 104 Ma (Zhong et al., 2014; Zhang, 2003), corresponding with outcrop ages between 116.7 and 106.5 Ma (Zhong et al., 2014). The P3 AFT age peak reported here is consistent with these ages and suggests that it may derive from contemporaneous paleo-volcanic material.
In short, detrital thermochronology analysis of the Lower Cretaceous suggest that the detrital AFT age peaks P1 and P2 represent two-stage exhumation of the Shalazha Mountain, while the P3 record at ca 105.6 Ma likely records coeval volcanic activity.
Several different fault systems developed within the Shalazha Mountain region (Figs. 9 and 10). Firstly, EW- and NEE-trending thrust faults as well as NNE- and NNW-trending X-shape dyke swarms developed within the magmatic rocks of this region (Figs. 9b and 9c). Secondly, the NWW-trending right lateral compressional fault crosscuts the NE-trending Late Permian–Early Triassic dyke swarm and the NWW-trend fault; this means that all right lateral compressional faults exposed in the Shalazha Mountain bedrock (i.e., within Carboniferous strata and Late Permian–Early Triassic granitoids) do not crosscut the Cretaceous strata (Fig. 9c) and therefore implies that the faults were active over the period between the Late Triassic and Earliest Cretaceous. Finally, NNE- and NE-trending extensional faults (Fig. 9d) accompany a multi-phase rift of the Cretaceous Yingen-Ejinaqi Basin (Bureau of Geology and Mineral Resources of Inner Mongolia Autonomous Region, 2001).
Although the Shalazha Mountain experienced deformation as a result of multiphase fault activity, Mesozoic fault deformation has rarely been reported to date. The eight bedrock samples collected here are important because they derive from across the Shalazha thrust fault (Fig. 3). Soft Upper Paleozoic strata in the footwall of the Shalazha thrust fault are strongly deformed in outcrop (Fig. 10a), characterized by regional fold superimposition (Zhang, 2019), while outcrops of rigid magma in the hanging wall are characterized by shear deformation (Fig. 9c). Thermal history modeling shows that the hanging wall to the north of the fault cooled faster than the footwall to the south during the Late Triassic to the Early Cretaceous (Fig. 7). We consider that this cooling difference corresponds with rapid movement of the Shalazha thrust fault between ca. 230 and ca. 174 Ma before it started moving more slowly until ca. 135 Ma. This result is consistent with the observation presented by Zhang (2019) who reported two distinct zircon U-Th/He age populations from hanging wall bedrocks dated to between ca. 195 and 163 Ma as well as from footwall bedrocks dated to between ca. 254 and 220 Ma all from the Shalazha thrust fault to the west of Shalazha Mountain. These data suggest that the Shalazha thrust fault underwent initial motion throughout the Late Triassic to Early–Middle Jurassic. Thus, analysis of these bedrock modeling results reveals significant two-stage thrust fault activation between ca. 230 and 135 Ma synchronized with uplift of Shalazha Mountain.
The southern CAOB was formed by the aggregation of several microplates (Xiao et al., 2018) and has potential to reactivate. Field observations shows that this study area has experienced three or more different phases of deformation since the Mesozoic (Figs. 9 and 10). An enhanced understanding of the East Asia deformation record means that it is increasingly apparent that multiple pulses of regional activity can be correlate with the far-field effect of several plates docking (Guo et al., 2018; Peng et al., 2018; Dong et al., 2015; Yang et al., 2013; Darby and Ritts, 2002). Meso-Cenozoic deformation and its geodynamic implications of such processes across the southern CAOB and nearby regions have been discussed in earlier works, including within the Langshan (Zhang et al., 2014), the Solonker belt (Shi et al., 2019), Alxa (Song et al., 2018), Beishan (Gillespie et al., 2017), Tianshan (Yin et al., 2018; Glorie and Grave, 2016) and etc. These data augment our understanding of tectonothermal events and the geomorphologic evolution of the Shalazha region (Fig. 11).
Major emplacement of Shalazha Mounatin granitoids took place during the Late Permian–Middle Triassic (Liu Q et al., 2017; Shi et al., 2014; Zhang et al., 2013), a significant post-collisional period (Zhang et al., 2013). At the same time, an EW-directed thrust fault (Figs. 9b and 10b) alongside folds almost parallel to the collision zone also formed (Tian et al., 2016). The AFT modeling results of this study reveal that subsequent to emplacement of the these granitoids, Shalazha Mountain was rapidly uplifted in the Late Triassic–Early Jurassic, and ca. 20 km crust was exhumated. We therefore interpret the obtained Late Triassic–Early Jurassic tectonothermal event P1 as indicative of a post-magmatic cooling and orogenic period. This cooling event is consistent with intense intraplate N-S directed compression and fast exhumation that has occurred across the Tianshan range since the Triassic (Yin et al., 2018; Glorie and Grave, 2016; de Grave et al., 2011) as well as in southern Mongolia during the Middle Mesozoic (Lamb et al., 2008), and within the Beishan orogenic belt at ca. 225–180 Ma (Tian et al., 2016). This means that Late Triassic–Early Jurassic compressional deformation and uplift of Shalazha Mountain might be related to this major pulse of orogenesis in the southern CAOB (Tian et al., 2016; Wilde and Zhou, 2015; Jahn, 2004).
A further subsequent cooling impulse was also seen in the Middle Jurassic–earliest Early Cretaceous (P2) (Figs. 7, 8 and 10), but the cooling rate here (P2) was slower than that seen during P1. This event is also recorded by thermochronology data from southern Mongolia (Dumitru and Hendrix, 2001) and Beishan (Gillespie et al., 2017; Tian et al., 2016) across the southern CAOB. Intense intraplate NS-NNW compression took place at this time across the central segment of the southern CAOB, including regional-scale thrust and folding encompassing several kilometers in strike length and absence of the sedimentary (Cunningham, 2017; Lamb et al., 2008; Zheng et al., 1996). Contemporaneous tectonothermal events have also been documented in the Langshan region and along the northern margin of the North China Carton (Feng et al., 2017). These observations are in agreement with the presence of a contractional period encompassing the whole Langshan-Yinshan-Yanshan Orogenic Belt as well as the southern CAOB during the Middle Jurassic to Early Cretaceous, the first stage of the "Yanshan Orogeny" (Dong et al., 2018). Closure of the Mongol-Okhotsk oceans or/and the Jurassic Tethys have been interpreted as responsible for these Middle Jurassic–Earliest Early Cretaceous tectonothermal event (Yang et al., 2015; Zheng et al., 1996).
Although the Yingen-Ejinaqi Basin experienced a break between Jurassic–Earliest Cretaceous uplift and Cretaceous extension, denudation continued in the Shalazha region as a rift shoulder (Fig. 11c). Across this study area, intense volcanic eruption occurred along NNE-trending extensional faults and within Cretaceous strata (clearly see on Google Earth, Fig. 9d). Cretaceous sediments in front of Shalazha Mountain, unconformable with underlayer Paleozoic rocks, contain several conglomerates including granite and basaltic gravels (Fig. 3). Northern China and southern Mongolia region contains numerous Cretaceous NE-trending extensional graben basins that together constitute a regionally extensive system (Li et al., 2013; Meng et al., 2003). Indeed, coeval N-S or NE-SW-trending fault basins developed in large numbers and cooled rapidly in in adjacent parts of eastern Asia (Zhang et al., 2010; Hu et al., 2006; Ren et al., 2002). These are correlated with widespread lithospheric extension and thinning across eastern Asia at this time (Dong et al., 2018, 2015) and simultaneity with the subduction of the Izanagi Plate along the eastern Eurasian Plate (Ren et al., 2002). These correlations imply that the synchronous exhumation of the Shalazha Mountain region at this stage is one far-field consequence of Izanagi Plate subduction.
Rapid Cenozoic cooling was not detected within the Shalazha Mountain region using AFT thermochronology, even though this was detected in nearby eastern Qilianshan-western Qinling (Li et al., 2019; Pang et al., 2019; Wang et al., 2013), Haiyuan-Liupanshan (Peng et al., 2019), Hexi Corridor (Zhang et al., 2017), Helanshan (Liu et al., 2010; Zhao et al., 2007) and Langshan (Cui et al., 2018). Outcrops also reveal the absence or weak deformation within these strata (Fig. 10d). Shalazha Mountain and surrounding regions are characterized by a series of accreted arcs, including numerous ENE-trending faults and suture zones which all had the potential to be reactivated in the Cenozoic (Xiao et al., 2018; Gillespie et al., 2017). However, the far-field effect of the India-Eurasia collision occurred mostly in the northeast, encompassing the East Kunlunshan, Altyn Tagh, Qilianshan, Haiyuan-Liupanshan, and Helanshan to Langshan (e.g., Duvall et al. (2013), Yuan et al. (2013)). We therefore interpret this weaker boundary fault zone to have likely protected the relatively stable Shalazha Mountain belt as a stress shadow and soft deformation. This is similar to the situation known to have occurred in Beishan (Gillespie et al., 2017); Late Cenozoic rapid exhumation is not present in this region but is seen in the surrounding Altyn Tagh(Li et al., 2018, 2017; Sobel et al., 2001), western Qilianshan(George et al., 2001, Jolivet et al., 2001), Tianshan (Glorie and Grave, 2016) and Gobi-Altay (Vassallo et al., 2007). It is thought that northward propagation of transpressional deformation from the Himalayan front to the north, even arriving at the Siberian Craton (Vassallo et al., 2007) and in surrounding fault systems, provided protection for the central segment of the southern CAOB. This region therefore remained relatively stable inside a stress shadow (Gillespie et al., 2017). Thus, the region encompassing Shalazha Mountain to Beishan, the central segment of the southern CAOB, was then exhumated slowly throughout the Cenozoic (Fig. 11d).
The Shalazha Mountain AFT data presented in this study provides a constraint on tectonothermal evolution of the southern CAOB. Detrital AFT data obtained from Lower Cretaceous strata reveal the presence of three age peaks, P1 (ca. 178 Ma), P2 (ca. 149 Ma), and P3 (ca. 105 Ma). Combining with the exist bedrock AFT results of the southern Shalazha Mountain region confirms the following: two-stage Shalazha thrust fault activation at ca. 230–135 Ma and three dominant stages differential tectonothermal events, including in the Late Triassic–Early Jurassic, Middle Jurassic–Earliest Cretaceous, and the Cretaceous. The detrital age peaks of P1 and P2 are thus interpreted to represent two-stage exhumation of the Shalazha Mountain.
Geologic evidence and thermochronological data show that Late Triassic–Early Jurassic rapid cooling events can be associated with the initial intense deformation and orogenesis of the southern CAOB. Subsequent Middle Jurassic–Early Cretaceous cooling is therefore consistent with the Mesozoic intense intraplate compression which took place in the southern CAOB and is interpreted as a record of the closure of the Mongol-Okhotsk Ocean, the first stage of "Yanshan Orogeny". Widespread Cretaceous denudation of Shalazha Mountain and burial of the Yingen-Ejinaqi Basin rift can thus be linked to the oblique subduction of the Izanagi Plate along the eastern Eurasian Plate. This created a NE-trending normal fault and synchronous extension. The first reported ca. 105.6 Ma age peak (P3) in Cretaceous detrital AFT might therefore also record coeval volcanic activity. No visible thermochronological evidence has been found to date in the Shalazha Mountain region for any strong Cenozoic cooling in response to the far-field effect of the India-Asia collision.
ACKNOWLEDGMENTS: This research was supported by the National Natural Science Foundation of China (No. 41972153), the Geological Survey Project of China Geological Survey (No. DD20160172), and the Science and Technology Department of China National Petroleum Corporation (No. 2018A-0104). Apatite fission-track data are presented in supplementary Table S1 while the pictures of measured grains are listed in supplemental Fig. S1. We thank Xiaochen Zhao and Yuzhao Guan for their assistance with fieldwork and experiments. The authors acknowledge editorial support from the Journal of Earth Science and thank Bing Li as well as three anonymous reviewers for helpful reviews and constructive suggestions. The final publication is available at Springer via https://doi.org/10.1007/s12583-020-1053-z.Barbarand, J., Carter, A., Wood, I., et al., 2003. Compositional and Structural Control of Fission-Track Annealing in Apatite. Chemical Geology, 198(1/2): 107–137. https://doi.org/10.1016/S0009-2541(02)00424-2 |
Bernet, M., Garver, J. I., 2005. Fission-Track Analysis of Detrital Zircon. Reviews in Mineralogy and Geochemistry, 58(1): 205–237. https://doi.org/10.2138/rmg.2005.58.8 |
Brandon, M. T., 2002. Decomposition of Mixed Grain Age Distributions Using Binomfit. On Track, 24(8): 13–18 |
Bu, J. J., Niu, Z. J., Wu, J., et al., 2012. Sedimentary Characteristics and Age of Amushan Formation in Ejin Banner and Its Adjacent Areas, Western Inner Mongolia. Geological Bulletin of China, 31(10): 1669–1683 (in Chinese with English Abstract) doi: 10.3969/j.issn.1671-2552.2012.10.012 |
Bureau of Geology and Mineral Resources of Inner Mongolia Autonomous Region, 2001. Geological Map and Report of the Olji Area, Scale 1 : 200 000 (in Chinese) |
Carlson, W. D., Donelick, R. A., Ketcham, R. A., 1999. Variability of Apatite Fission-Track Annealing Kinetics; I, Experimental Results. American Mineralogist, 84(9): 1213–1223. https://doi.org/10.2138/am-1999-0901 |
Chen, Z. P., Ren, Z. L., Qi, K., et al., 2019. Zircon U-Pb Chronology and Geochemistry of Volcanic Rocks of Early Cretaceous Bayingebi Formation in Suhongtu Depression of the Ying'e Basin, and Their Tectonic Implications. Acta Geologica Sinica, 93(2): 353–367. https://doi.org/10.19762/j.cnki.dizhixuebao.2019020 (in Chinese with English Abstract) |
Cui, X. Y., Zhao, Q. H., Zhang, J., et al., 2018. Late Cretaceous–Cenozoic Multi-Stage Denudation at the Western Ordos Block: Constraints by the Apatite Fission Track Dating on the Langshan. Acta Geologica Sinica (English Edition), 92(2): 536–555. http://doi.org/10.1111/1755-6724.13541 |
Cunningham, D., 2017. Folded Basinal Compartments of the Southern Mongolian Borderland: A Structural Archive of the Final Consolidation of the Central Asian Orogenic Belt. Geosciences, 7(1): 2. https://doi.org/10.3390/geosciences7010002 |
Darby, B. J., Ritts, B. D., 2002. Mesozoic Contractional Deformation in the Middle of the Asian Tectonic Collage: The Intraplate Western Ordos Fold-Thrust Belt, China. Earth and Planetary Science Letters, 205(1/2): 13–24. https://doi.org/10.1016/S0012-821X(02)01026-9 |
de Grave, J., Glorie, S., Buslov, M. M., et al., 2011. The Thermo-Tectonic History of the Song-Kul Plateau, Kyrgyz Tien Shan: Constraints by Apatite and Titanite Thermochronometry and Zircon U/Pb Dating. Gondwana Research, 20(4): 745–763. https://doi.org/10.1016/j.gr.2011.03.011 |
Donelick, R. A., O'Sullivan, P. B., Ketcham, R. A., 2005. Apatite Fission-Track Analysis. Reviews in Mineralogy and Geochemistry, 58(1): 49–94. https://doi.org/10.2138/rmg.2005.58.3 |
Dong, S. W., Zhang, Y. Q., Li, H. L., et al., 2018. The Yanshan Orogeny and Late Mesozoic Multi-Plate Convergence in East Asia—Commemorating 90th Years of the "Yanshan Orogeny". Science China Earth Sciences, 61(12): 1888–1909. https://doi.org/10.1007/s11430-017-9297-y |
Dong, S. W., Zhang, Y., Zhang, F., et al., 2015. Late Jurassic–Early Cretaceous Continental Convergence and Intracontinental Orogenesis in East Asia: a Synthesis of the Yanshan Revolution. Journal of Asian Earth Sciences, 114: 750–770. https://doi.org/10.1016/j.jseaes.2015.08.011 |
Dumitru, T. A., Hendrix, M. S., 2001. Fission-Track Constraints on Jurassic Folding and Thrusting in Southern Mongolia and Their Relationship to the Beishan Thrust Belt of Northern China. Memoir of the Geological Society of America, 194: 215–229. https://doi.org/10.1130/0-8137-1194-0.215 |
Dunkl, I., 2002. Trackkey: A Windows Program for Calculation and Graphical Presentation of Fission Track Data. Computers & Geosciences, 28(1): 3–12. https://doi.org/10.1016/S0098-3004(01)00024-3 |
Duvall, A. R., Clark, M. K., Kirby, E., et al., 2013. Low-Temperature Thermochronometry along the Kunlun and Haiyuan Faults, NE Tibetan Plateau: Evidence for Kinematic Change during Late-Stage Orogenesis. Tectonics, 32(5): 1190–1211. https://doi.org/10.1002/tect.20072 |
Feng, L. X., Brown, R. W., Han, B. F., et al., 2017. Thrusting and Exhumation of the Southern Mongolian Plateau: Joint Thermochronological Constraints from the Langshan Mountains, Western Inner Mongolia, China. Journal of Asian Earth Sciences, 144: 287–302. https://doi.org/10.1016/j.jseaes.2017.01.001 |
Galbraith, R. F., 1981. On Statistical Models for Fission Track Counts. Journal of the International Association for Mathematical Geology, 13(6): 471–478. https://doi.org/10.1007/BF01034498 |
Gallagher, K., 2012. Transdimensional Inverse Thermal History Modeling for Quantitative Thermochronology. Journal of Geophysical Research: Solid Earth, 117(B2): B02408. https://doi.org/10.1029/2011jb008825 |
Garver, J. I., Brandon, M. T., Roden-Tice, M., et al., 1999. Exhumation History of Orogenic Highlands Determined by Detrital Fission-Track Thermochronology. Geological Society, London, Special Publications, 154(1): 283–304. https://doi.org/10.1144/gsl.sp.1999.154.01.13 |
George, A. D., Marshallsea, S. J., Wyrwoll, K. H., et al., 2001. Miocene Cooling in the Northern Qilian Shan, Northeastern Margin of the Tibetan Plateau, Revealed by Apatite Fission-Track and Vitrinite-Reflectance Analysis. Geology, 29(10): 939–942. https://doi.org/10.1130/0091-7613(2001)029<0939:mcitnq>2.0.co;2 doi: 10.1130/0091-7613(2001)029<0939:mcitnq>2.0.co;2 |
Gillespie, J., Glorie, S., Xiao, W. J., et al., 2017. Mesozoic Reactivation of the Beishan, Southern Central Asian Orogenic Belt: Insights from Low-Temperature Thermochronology. Gondwana Research, 43: 107–122. https://doi.org/10.1016/j.gr.2015.10.004 |
Glorie, S., Grave, J. D., 2016. Exhuming the Meso-Cenozoic Kyrgyz Tianshan and Siberian Altai-Sayan: A Review Based on Low-Temperature Thermochronology. Geoscience Frontiers, 7(2): 155–170. https://doi.org/10.1016/j.gsf.2015.04.003 |
Guan, Y., 2019. Late Reformation and Hydrocarbon Preservation of Carboniferous–Permian System in the Juyanhai Depression of Yin'E Basin: [Dissertation]. Northwest University, Xi'an (in Chinese with English Abstract) |
Guo, P., Liu, C. Y., Wang, J. Q., et al., 2018. Detrital Zircon Geochronology of the Jurassic Strata in the Western Ordos Basin, North China: Constraints on the Provenance and Its Tectonic Implication. Geological Journal, 53(4): 1482–1499. https://doi.org/10.1002/gj.2968 |
Han, W., 2017. Study of Sedimentary-Tectonic Evolution since Late Paleozoic and Its Impacts on Oil and Gas Geological Conditions of Yin-E Basin: [Dissertation]. Northwest University, Xi'an (in Chinese with English Abstract) |
Han, W., Lu, J. C., Wei, J. S., et al., 2015. Apatite Fission Track Constraints on the Mesozoic Tectonic Activities in Shangdan Depression, Yin'e Basin, Inner Mongolia. Acta Geologica Sinica, 89(12): 2277–2285. https://doi.org/10.3969/j.issn.0001-5717.2015.12.007 |
Han, W., Lu, J. C., Zhang, Y. P., et al., 2014. Apatite Fission Track and Its Petroleum Geological Significance of the Ejina Area and Its Vicinity, Western Inner Mongolia. Geotectonica et Metallogenia, 38(3): 647–655. https://doi.org/10.16539/j.ddgzyckx.2014.03.013 (in Chinese with English Abstract) |
Hu, C. S., Li, W. B., Xu, C., et al., 2015. Geochemistry and Petrogenesis of Permian Granitoids in the Northwestern Margin of the North China Craton: Insights from the Dongshengmiao Pluton, Inner Mongolia. International Geology Review, 57(14): 1843–1860. https://doi.org/10.1080/00206814.2015.1039087 |
Hu, S., Kohn, B. P., Raza, A., et al., 2006. Cretaceous and Cenozoic Cooling History across the Ultrahigh Pressure Tongbai-Dabie Belt, Central China, from Apatite Fission-Track Thermochronology. Tectonophysics, 420(3/4): 409–429. https://doi.org/10.1016/j.tecto.2006.03.027 |
Hurford, A. J., Green, P. F., 1983. The Zeta Age Calibration of Fission-Track Dating. Chemical Geology, 41: 285–317. https://doi.org/10.1016/S0009-2541(83)80026-6 |
Hurford, A. J., 1990. Standardization of Fission Track Dating Calibration: Recommendation by the Fission Track Working Group of the I. U. G. S. Subcommission on Geochronology. Chemical Geology: Isotope Geoscience Section, 80(2): 171–178. https://doi.org/10.1016/0168-9622(90)90025-8 |
Jahn, B. M., 2004. The Central Asian Orogenic Belt and Growth of the Continental Crust in the Phanerozoic. Geological Society, London, Special Publications, 226(1): 73–100. https://doi.org/10.1144/gsl.sp.2004.226.01.05 |
Jiang, S. Y., Jiang, H., Zhao, K. D., 2019. Mesozoic Metallogeny of Southeast Asia: A Preface. Journal of Earth Science, 30(1): 5–8. https://doi.org/10.1007/s12583-018-0871-8 |
Jolivet, M., Brunel, M., Seward, D., et al., 2001. Mesozoic and Cenozoic Tectonics of the Northern Edge of the Tibetan Plateau: Fission-Track Constraints. Tectonophysics, 343(1/2): 111–134. https://doi.org/10.1016/S0040-1951(01)00196-2 |
Jolivet, M., Ritz, J. F., Vassallo, R., et al., 2007. Mongolian Summits: an Uplifted, Flat, Old but still Preserved Erosion Surface. Geology, 35(10): 871–874. https://doi.org/10.1130/g23758a.1 |
Ketcham, R. A., 2005. Forward and Inverse Modeling of Low-Temperature Thermochronometry Data. Reviews in Mineralogy and Geochemistry, 58(1): 275–314. https://doi.org/10.2138/rmg.2005.58.11 |
Ketcham, R. A., Carter, A., Donelick, R. A., et al., 2007a. Improved Modeling of Fission-Track Annealing in Apatite. American Mineralogist, 92(5/6): 799–810. https://doi.org/10.2138/am.2007.2281 |
Ketcham, R. A., Carter, A., Donelick, R. A., et al., 2007b. Improved Measurement of Fission-Track Annealing in Apatite Using C-Axis Projection. American Mineralogist, 92(5/6): 789–798. https://doi.org/10.2138/am.2007.2280 |
Lamb, M. A., Badarch, G., Navratil, T., et al., 2008. Structural and Geochronologic Data from the Shin Jinst Area, Eastern Gobi Altai, Mongolia: Implications for Phanerozoic Intracontinental Deformation in Asia. Tectonophysics, 451(1/2/3/4): 312–330. https://doi.org/10.1016/j.tecto.2007.11.061 |
Li, B., Chen, X., Zuza, A. V., et al., 2019. Cenozoic Cooling History of the North Qilian Shan, Northern Tibetan Plateau, and the Initiation of the Haiyuan Fault: Constraints from Apatite- and Zircon-Fission Track Thermochronology. Tectonophysics, 751: 109–124. https://doi.org/10.1016/j.tecto.2018.12.005 |
Li, B. S., Yan, M. D., Zhang, W. L., et al., 2017. New Paleomagnetic Constraints on Middle Miocene Strike-Slip Faulting along the Middle Altyn Tagh Fault: Mid-Miocene Faulting of Altyn Tagh Fault. Journal of Geophysical Research: Solid Earth, 122(6): 4106–4122. https://doi.org/10.1002/2017JB014058 |
Li, B. S., Yan, M. D., Zhang, W. L., et al., 2018. Paleomagnetic Rotation Constraints on the Deformation of the Northern Qaidam Marginal Thrust Belt and Implications for Strike-Slip Faulting along the Altyn Tagh Fault. Journal of Geophysical Research: Solid Earth, 123(9): 7207–7224. https://doi.org/10.1029/2018JB015753 |
Li, S. Z., Suo, Y. H., Santosh, M., et al., 2013. Mesozoic to Cenozoic Intracontinental Dynamics of the North China Block. Geological Journal, 48(5): 543–560. https://doi.org/10.1002/gj.2500 |
Liu, J. H., Zhang, P. Z., Zheng, D. W., et al., 2010. Pattern and Timing of Late Cenozoic Rapid Exhumation and Uplift of the Helan Mountain, China. Science China Earth Sciences, 53(3): 345–355. https://doi.org/10.1007/s11430-010-0016-0 |
Liu, M., Lai, S. C., Zhang, D., et al., 2019. Early–Middle Triassic Intrusions in Western Inner Mongolia, China: Implications for the Final Orogenic Evolution in Southwestern Xing-Meng Orogenic Belt. Journal of Earth Science, 30(5): 977–995 doi: 10.1007/s12583-019-1015-5 |
Liu, Q., Zhao, G. C., Han, Y. G., et al., 2017. Geochronology and Geochemistry of Permian to Early Triassic Granitoids in the Alxa Terrane: Constraints on the Final Closure of the Paleo-Asian Ocean. Lithosphere, 9(4): 665–680. https://doi.org/10.1130/L646.1 |
Liu, X., Han, W., Wei, J. S., et al., 2017. Constraints of Apatite Fission Track on the Mesozoic Tectonic Activities in Xirehada Region, Yin'e Basin, Inner Mongolia. Acta Geologica Sinica, 91(10): 2185–2195. https://doi.org/10.3969/j.issn.0001-5717.2017.10.003 (in Chinese with English Abstract) |
Malusà, M. G., Fitzgerald, P. G., 2018. Fission-Track Thermochronology and Its Application to Geology. Springer |
Meng, Q. R., 2003. What Drove Late Mesozoic Extension of the Northern China-Mongolia Tract? Tectonophysics, 369(3/4): 155–174. https://doi.org/10.1016/S0040-1951(03)00195-1 |
Meng, Q. R., Hu, J. M., Jin, J. Q., et al., 2003. Tectonics of the Late Mesozoic Wide Extensional Basin System in the China-Mongolia Border Region. Basin Research, 15(3): 397–415. https://doi.org/10.1046/j.1365-2117.2003.00209.x |
Metcalf, J. R., Fitzgerald, P. G., Baldwin, S. L., et al., 2009. Thermochronology of a Convergent Orogen: Constraints on the Timing of Thrust Faulting and Subsequent Exhumation of the Maladeta Pluton in the Central Pyrenean Axial Zone. Earth and Planetary Science Letters, 287(3/4): 488–503. https://doi.org/10.1016/j.epsl.2009.08.036 |
Pang, J. Z., Yu, J., Zheng, D., et al., 2019. Constraints of New Apatite Fission-Track Ages on the Tectonic Pattern and Geomorphic Development of the Northern Margin of the Tibetan Plateau. Journal of Asian Earth Sciences, 181: 103909. https://doi.org/10.1016/j.jseaes.2019.103909 |
Peng, H., Wang, J. Q., Liu, C. Y., et al., 2019. Thermochronological Constraints on the Meso-Cenozoic Tectonic Evolution of the Haiyuan-Liupanshan Region, Northeastern Tibetan Plateau. Journal of Asian Earth Sciences, 183: 103966. https://doi.org/10.1016/j.jseaes.2019.103966 |
Peng, H., Wang, J. Q., Zattin, M., et al., 2018. Late Triassic-Early Jurassic Uplifting in Eastern Qilian Mountain and Its Geological Significance: Evidence from Apatite Fission Track Thermochronology. Earth Science, 43(6): 1983–1996. https://doi.org/10.3799/dqkx.2018.608 (in Chinese with English Abstract) |
Qi, K., Ren, Z. L., Cui, J. P., et al., 2018. Thermal History Reconstruction of Mesozoic Source Rock in Western of Suhongtu Depression, Inner Mongolia, Northern China. Earth Science, 43(06): 1957–1971. https://doi.org/10.3799/dqkx.2018.594 (in Chinese with English Abstract) |
Ren, J. Y., Tamaki, K., Li, S., et al., 2002. Late Mesozoic and Cenozoic Rifting and Its Dynamic Setting in Eastern China and Adjacent Areas. Tectonophysics, 344(3/4): 175–205. https://doi.org/10.1016/S0040-1951(01)00271-2 |
Shi, G. Z., Liang, C., Wang, H., et al., 2019. Superimposed Deformation of the Solonker Belt and nearby Regions in Western Inner Mongolia, China. Geological Magazine, 156(5): 811–832. https://doi.org/10.1017/S0016756818000183 |
Shi, X. J., Wang, T., Zhang, L., et al., 2014. Timing, Petrogenesis and Tectonic Setting of the Late Paleozoic Gabbro-Granodiorite-Granite Intrusions in the Shalazhashan of Northern Alxa: Constraints on the Southernmost Boundary of the Central Asian Orogenic Belt. Lithos, 208/209: 158–177. https://doi.org/10.1016/j.lithos.2014.08.024 |
Sobel, E. R., Arnaud, N., Jolivet, M., et al., 2001. Jurassic to Cenozoic Exhumation History of the Altyn Tagh Range, Northwest China, Constrained by 40Ar/39Ar and Apatite Fission Track Thermochronology. Memoir of the Geological Society of America, 194: 247–267. https://doi.org/10.1130/0-8137-1194-0.247 |
Song, D. F., Glorie, S., Xiao, W. J., et al., 2018. Song, D. F., et al., 2018. Tectono-Thermal Evolution of the Southwestern Alxa Tectonic Belt, NW China: Constrained by Apatite U-Pb and Fission Track Thermochronology. Tectonophysics, 722: 577–594. https://doi.org/10.1016/j.tecto.2017.11.029 |
Stewart, R. J., Brandon, M. T., 2004. Detrital-Zircon Fission-Track Ages for the "Hoh Formation": Implications for Late Cenozoic Evolution of the Cascadia Subduction Wedge. Geological Society of America Bulletin, 116(1): 60–75. https://doi.org/10.1130/b22101.1 |
Tao, N., Li, Z. X., Danišík, M., et al., 2019. Post-250 Ma Thermal Evolution of the Central Cathaysia Block (SE China) in Response to Flat-Slab Subduction at the Proto-Western Pacific Margin. Gondwana Research, 75: 1–15. https://doi.org/10.1016/j.gr.2019.03.019 |
Tapponnier, P., Peltzer, G., Le Dain, A. Y., et al., 1982. Propagating Extrusion Tectonics in Asia: New Insights from Simple Experiments with Plasticine. Geology, 10(12): 611. https://doi.org/10.1130/0091-7613(1982)10611:petian>2.0.co;2 doi: 10.1130/0091-7613(1982)10611:petian>2.0.co;2 |
Tian, Z. H., Xiao, W. J., Zhang, Z. Y., et al., 2016. Fisson-Track Constrains on Superposed Folding in the Beishan Orogenic Belt, Southernmost Altaids. Geoscience Frontiers, 7(2): 181–196. https://doi.org/10.1016/j.gsf.2015.11.007 |
Vassallo, R., Jolivet, M., Ritz, J. F., et al., 2007. Uplift Age and Rates of the Gurvan Bogd System (Gobi-Altay) by Apatite Fission Track Analysis. Earth and Planetary Science Letters, 259(3/4): 333–346. https://doi.org/10.1016/j.epsl.2007.04.047 |
Vermeesch, P., 2009. RadialPlotter: A Java Application for Fission Track, Luminescence and Other Radial Plots. Radiation Measurements, 44(4): 409–410. https://doi.org/10.1016/j.radmeas.2009.05.003 |
Wang, Q. C., Li, S. J., Du, Z. L., 2009. Differential Uplift of the Chinese Tianshan since the Cretaceous: Constraints from Sedimentary Petrography and Apatite Fission-Track Dating. International Journal of Earth Sciences, 98(6): 1341–1363. https://doi.org/10.1007/s00531-009-0436-2 |
Wang, T., 1990. Formation and Evolution of Badain Jirin Sandy Desert, China. Journal of Desert Research, 10(1): 29–40 (in Chinese with English Abstract) |
Wang, X., Zattin, M., Li, J., et al., 2013. Cenozoic Tectonic Uplift History of Western Qinling: Evidence from Sedimentary and Fission-Track Data. Journal of Earth Science, 24(4): 491–505. https://doi.org/10.1007/s12583-013-0345-y |
Wilde, S. A., Zhou, J. B., 2015. The Late Paleozoic to Mesozoic Evolution of the Eastern Margin of the Central Asian Orogenic Belt in China. Journal of Asian Earth Sciences, 113: 909–921. https://doi.org/10.1016/j.jseaes.2015.05.005 |
Windley, B. F., Alexeiev, D., Xiao, W. J., et al., 2007. Tectonic Models for Accretion of the Central Asian Orogenic Belt. Journal of the Geological Society, 164(1): 31–47. https://doi.org/10.1144/0016-76492006-022 |
Xiao, W. J., Windley, B. F., Allen, M. B., et al., 2013. Paleozoic Multiple Accretionary and Collisional Tectonics of the Chinese Tianshan Orogenic Collage. Gondwana Research, 23(4): 1316–1341. https://doi.org/10.1016/j.gr.2012.01.012 |
Xiao, W. J., Windley, B. F., Han, C., et al., 2018. Late Paleozoic to Early Triassic Multiple Roll-Back and Oroclinal Bending of the Mongolia Collage in Central Asia. Earth-Science Reviews, 186: 94–128. https://doi.org/10.1016/j.earscirev.2017.09.020 |
Xiao, W. J., Windley, B. F., Hao, J., et al., 2003. Accretion Leading to Collision and the Permian Solonker Suture, Inner Mongolia, China: Termination of the Central Asian Orogenic Belt. Tectonics, 22(6): 1069. https://doi.org/10.1029/2002TC001484 |
Xu, W., Wei, J., Han, W., et al., 2018. A Preliminary Study of the Structure and Reformation of the Permian and Carboniferous Strata in Yingen-Ejin Basin and Its Periphery. Geological Bulletin of China, 37(1): 132–143. https://doi.org/10.3969/j.issn.1671-2552.2018.01.014 (in Chinese with English Abstract) |
Yang, Y. T., Guo, Z. X., Song, C. C., et al., 2015. A Short-Lived but Significant Mongol-Okhotsk Collisional Orogeny in Latest Jurassic-Earliest Cretaceous. Gondwana Research, 28(3): 1096–1116. https://doi.org/10.1016/j.gr.2014.09.010 |
Yang, Z., Ratschbacher, L., Jonckheere, R., et al., 2013. Late-Stage Foreland Growth of China's Largest Orogens (Qinling, Tibet): Evidence from the Hannan-Micang Crystalline Massifs and the Northern Sichuan Basin, Central China. Lithosphere, 5(4): 420–437. https://doi.org/10.1130/L260.1 |
Yang, Z., Shen, C. B., Ratschbacher, L., et al., 2017. Sichuan Basin and Beyond: Eastward Foreland Growth of the Tibetan Plateau from an Integration of Late Cretaceous–Cenozoic Fission Track and (U-Th)/He Ages of the Eastern Tibetan Plateau, Qinling, and Daba Shan. Journal of Geophysical Research: Solid Earth, 122(6): 4712–4740. https://doi.org/10.1002/2016jb013751 |
Yin, A., 2010. Cenozoic Tectonic Evolution of Asia: A Preliminary Synthesis. Tectonophysics, 488(1/2/3/4): 293–325. https://doi.org/10.1016/j.tecto.2009.06.002 |
Yin, J. Y., Wen, C., Hodges, K. V., et al., 2018. The Thermal Evolution of Chinese Central Tianshan and Its Implications: Insights from Multi-Method Chronometry. Tectonophysics, 722: 536–548. https://doi.org/10.1016/j.tecto.2017.11.037 |
Yu, Q., Ren, Z. L., Li, R. X., et al., 2019. Meso-Cenozoic Tectonothermal History of Permian Strata, Southwestern Weibei Uplift: Insights from Thermochronology and Geothermometry. Acta Geologica Sinica (English Edition), 93(6): 1647–1661. https://doi.org/10.1111/1755-6724.14367 |
Yuan, D. Y., Ge, W. P., Chen, Z. W., et al., 2013. The Growth of Northeastern Tibet and Its Relevance to Large-Scale Continental Geodynamics: A Review of Recent Studies. Tectonics, 32(5): 1358–1370. https://doi.org/10.1002/tect.20081 |
Yue, Y. J., Liou, J. G., 1999. Two-Stage Evolution Model for the Altyn Tagh Fault, China. Geology, 27(3): 227. https://doi.org/10.1130/0091-7613(1999)0270227:tsemft>2.3.co;2 doi: 10.1130/0091-7613(1999)0270227:tsemft>2.3.co;2 |
Zattin, M., Stefani, C., Martin, S., 2003. Detrital Fission-Track Analysis and Sedimentary Petrofacies as Keys of Alpine Exhumation: The Example of the Venetian Foreland (European Southern Alps, Italy). Journal of Sedimentary Research, 73(6): 1051–1061. https://doi.org/10.1306/051403731051 |
Zattin, M., Wang, X. X., 2019. Exhumation of the Western Qinling Mountain Range and the Building of the Northeastern Margin of the Tibetan Plateau. Journal of Asian Earth Sciences, 177: 307–313. https://doi.org/10.1016/j.jseaes.2019.04.002 |
Zhang, A., 2003. Structural Characteristics and Relation with the Petroleum and Gas in Chagan Depression of Yin-E Basin of Inner Mongolia, Beijing: [Dissertation]. China University of Geosciences, Beijing (in Chinese with English Abstract) |
Zhang, B. H., Zhang, J., Wang, Y. N., et al., 2017. Late Mesozoic–Cenozoic Exhumation of the Northern Hexi Corridor: Constrained by Apatite Fission Track Ages of the Longshoushan. Acta Geologica Sinica (English Edition), 91(5): 1624–1643. https://doi.org/10.1111/1755-6724.13402 |
Zhang, J., Dickson, C., Cheng, H. Y., 2010. Sedimentary Characteristics of Cenozoic Strata in Central-Southern Ningxia, NW China: Implications for the Evolution of the NE Qinghai-Tibetan Plateau. Journal of Asian Earth Sciences, 39(6): 740–759. https://doi.org/10.1016/j.jseaes.2010.05.008 |
Zhang, J., Li, J., Li, Y., et al., 2014. Mesozoic–Cenozoic Multi-Stage Intraplate Deformation Events in the Langshan Region and Their Tectonic Implications. Acta Geologica Sinica (English Edition), 88(1): 78–102. http://10.3969/j.issn.1000-9515.2014.01.010 doi: 10.3969/j.issn.1000-9515.2014.01.010 |
Zhang, S. H., Zhao, Y., Kröner, A., et al., 2009. Early Permian Plutons from the Northern North China Block: Constraints on Continental Arc Evolution and Convergent Margin Magmatism Related to the Central Asian Orogenic Belt. International Journal of Earth Sciences, 98(6): 1441–1467. https://doi.org/10.1007/s00531-008-0368-2 |
Zhang, S., 2019. Geological Characteristics and Later Reformation of the Carboniferous–Permian Basin in Yingen-Ejina Area, NW China: [Dissertation]. Northwest University, Xi'an (in Chinese with English Abstract) |
Zhang, W., Wu, T. R., Feng, J. C., et al., 2013. Time Constraints for the Closing of the Paleo-Asian Ocean in the Northern Alxa Region: Evidence from Wuliji Granites. Science China Earth Sciences, 56(1): 153–164. https://doi.org/10.1007/s11430-012-4435-y |
Zhao, G. C., Wang, Y. J., Huang, B. C., et al., 2018. Geological Reconstructions of the East Asian Blocks: From the Breakup of Rodinia to the Assembly of Pangea. Earth-Science Reviews, 186: 262–286. https://doi.org/10.1016/j.earscirev.2018.10.003 |
Zhao, H. G., Liu, C. Y., Wang, F., et al., 2007. Uplift and Evolution of Helan Mountain. Science in China Series D: Earth Sciences, 50(2): 217–226. https://doi.org/10.1007/s11430-007-6010-5 |
Zhao, X. C., Liu, C. Y., Wang, J. Q., et al., 2020a. Geochemistry, Geochronology and Hf Isotope of Granitoids in the Northern Alxa Region: Implications for the Late Paleozoic Tectonic Evolution of the Central Asian Orogenic Belt. Geoscience Frontiers, 11(5): 1711–1725. https://doi.org/10.1016/j.gsf.2020.01.009 |
Zhao, X. C., Liu, C. Y., Wang, J. Q., et al., 2020b. Provenance Analyses of Lower Cretaceous Strata in the Liupanshan Basin: From Paleocurrents Indicators, Conglomerate Clast Compositions, and Zircon U-Pb Geochronology. Journal of Earth Science, 31(4): 757–771. https://doi.org/10.1007/s12583-020-1324-8 |
Zhao, Z., Li, J., Dang, Z., et al., 2016. TIMS zircon U-Pb isotopic dating of Salazha Mountain granites from the North Margin of Alxa, Inner Mongolia, and Its tectonic implications. Geological Bulletin of China, 35(4): 599-604. https://doi.org/10.3969/j.issn.1671-2552.2016.04.016 (in Chinese with English Abstract) |
Zheng, R. G., Wu, T. R., Zhang, W., et al., 2014. Late Paleozoic Subduction System in the Northern Margin of the Alxa Block, Altaids: Geochronological and Geochemical Evidences from Ophiolites. Gondwana Research, 25(2): 842–858. https://doi.org/10.1016/j.gr.2013.05.011 |
Zheng, Y., Zhang, Q., Wang, Y., et al., 1996. Great Jurassic Thrust Sheets in Beishan (North Mountains)—Gobi Areas of China and Southern Mongolia. Journal of Structural Geology, 18(9): 1111–1126. https://doi.org/10.1016/0191-8141(96)00038-7 |
Zhong, F., Zhong, J., Wang, Y., et al., 2014. Geochemistry Characteristics and Origin of Early Cretaceous Volcanic Rocks in Suhongtu Depression, Inner Mongolia, China. Acta Mineralogica Sinica, 34(01): 107–116 (in Chinese with English Abstract) |
Zuo, Y., Qiu, N. S., Hao, Q. Q., et al., 2015. Geothermal Regime and Source Rock Thermal Evolution in the Chagan Sag, Inner Mongolia, Northern China. Marine and Petroleum Geology, 59: 245–267. https://doi.org/10.1016/j.marpetgeo.2014.09.001 |
1. | Xiao Bian, Yuping Su, Jianping Zheng, et al. Multistage melt/fluid modification of lithospheric mantle beneath the circum-cratonic orogenic belt: Evidence from the Tuoyun peridotite xenoliths. Geological Society of America Bulletin, 2025, 137(1-2): 220. doi:10.1130/B37552.1 | |
2. | Nan Jia, Chiyang Liu, Jianqiang Wang, et al. New insights into Cenozoic evolution of the Shijiutuo uplift, Bohai Bay basin, China: Constraints from apatite fission track analysis and seismic data. Marine and Petroleum Geology, 2024, 164: 106808. doi:10.1016/j.marpetgeo.2024.106808 | |
3. | Qinlong TONG, Mingkuan QIN, Fawang YE. Apatite Fission‐Track Thermochronology in the Tamusu Area, Bayingobi Basin, NW China, and its Geological Significance. Acta Geologica Sinica - English Edition, 2024, 98(3): 585. doi:10.1111/1755-6724.15181 | |
4. | Chen Yu, Zhenhong Li, Chuang Song, et al. Fault structure and slip mechanics of the 2022 Mw 6.7 Menyuan earthquake revealed by coseismic rupture observations. Tectonophysics, 2024, 872: 230192. doi:10.1016/j.tecto.2023.230192 | |
5. | Zheren Zhao, Shichao Li, Lingyu Zhang. Depositional Responses to the Mongol-Okhotsk Ocean Closure in the Central Area of the Great Xing’an Range: Insights into Thrust Faults and Foreland Basins. Journal of Earth Science, 2024, 35(3): 797. doi:10.1007/s12583-023-1934-x | |
6. | Yiming Liu, Chao Chen, Qing Liang, et al. Crust and Upper Mantle Density Structures beneath the Eastern Tianshan Region and Its Tectonic Implications. Journal of Earth Science, 2024, 35(3): 828. doi:10.1007/s12583-021-1599-4 | |
7. | Yamei Wang, Jiyuan Yin, Stuart N. Thomson, et al. Meso—Cenozoic Exhumation of the Altai-Sayan Region: Constrained by Available Low-Temperature Thermochronology. Journal of Earth Science, 2024, 35(6): 2138. doi:10.1007/s12583-024-2016-6 | |
8. | Fangpeng Du, Furong Tan, Shiming Liu, et al. First Discovery of Late Triassic Tuffs in the South Qilian Basin: Geochemical Characteristics, Zircon LA-ICP-MS U-Pb Ages and Potential Source Regions. Journal of Earth Science, 2023, 34(6): 1692. doi:10.1007/s12583-021-1446-7 | |
9. | Ruiqin Liu, Chao Chen, Xinbiao Lv, et al. Petrogenesis and geological implications of the qiyishan triassic granitoids in east Beishan orogen, inner Mongolia, NW China: evidence from geochronology, geochemistry and Nd-Hf isotopes. Frontiers in Earth Science, 2023, 11 doi:10.3389/feart.2023.1260852 |
Sample No. | Era | Lithology | Coordinate (N/E) | Elevation (m) | Dating method | |
YE17-81 | K1s | Pebbly sandstone | 41º03′55″ | 104º44′47″ | 1 260 | AFT |
YE17-82 | K1b2 | Pebbly sandstone | 41º03′15″ | 104º45′41″ | 1 380 | AFT |
YE17-84 | P–T | Biotite granite | 40º59′53″ | 104º53′24″ | 1 380 | AFT |
YE17-86 | P–T | Biotite granite | 40º56′39″ | 104º56′18″ | 1 360 | AFT |
YE17-87 | P–T | Monzonitic granite | 40º54′21″ | 104º59′16″ | 1 380 | AFT |
09YSH-L1 | C2–P1 | Sandstone | 40º49′29.7″ | 104º44′50.9″ | 1 430 | AFT* |
09YSD-L1 | C2–P1 | Sandstone | 40º46′30.0″ | 104º50′15.4″ | 1 380 | AFT* |
09YSD-L2 | C2–P1 | Sandstone | 40º46′30.0″ | 104º50′15.4″ | 1 380 | AFT* |
09YSD-L3 | C2–P1 | Sandstone | 40º46′30.0″ | 104º50′15.4″ | 1 380 | AFT* |
09YCG-L2 | C2–P1 | Sandstone | 40º43′14.1″ | 104º48′00.2″ | 1 270 | AFT* |
*Data from Han et al. (2015). |
Sample No. | N | ρs(Ns) | ρi(Ni) | ρd(Nd) | Chi-sq. P (%) | Central age (±1σ) (Ma) | Pooled age (±1σ) (Ma) | MTL (±1σ) (μm) (n) |
Dpar (μm) |
P3 (Ma) (%) | P2 (Ma) (%) | P1 (Ma) (%) |
YE17-81 | 106 | 13.614 (10 942) | 4.483 (3 603) | 4.165 (3 006) | 0 | 145.7 ± 6.4 | 146.2 ± 5.5 | 14.38 ± 0.83 (153) | 1.55 | 105.6 ± 6.9 (25.5%) | 149 ± 26 (33%) | 178 ± 19 (41%) |
YE17-82 | 78 | 11.945 (5 341) | 4.048 (1 810) | 4.380 (3 162) | 67.55 | 150.3 ± 6.6 | 149.3 ± 6.3 | 14.03 ± 1.22 (106) | 1.60 | 149.3 ± 5.8 (100%) | ||
YE17-84 | 62 | 9.293 (5 845) | 2.682 (1 687) | 4.047 (2 919) | 86.66 | 161.8 ± 6.9 | 161.8 ± 6.9 | 14.37 ± 0.88 (117) | 1.64 | 161.8 ± 45 (100%) | ||
YE17-86 | 43 | 6.437 (1 935) | 2.262 (680) | 4.285 (3 094) | 99.64 | 141.0 ± 7.7 | 141.0 ± 7.7 | 14.36 ± 0.81 (119) | 1.54 | 141 ± 6.3 (100%) | ||
YE17-87 | 30 | 12.02 (2 144) | 4.166 (743) | 4.106 (2 963) | 90.3 | 137.0 ± 7.3 | 137.0 ± 7.3 | 13.99 ± 1.06 (35) | 1.55 | 137 ± 6.9 (100%) | ||
09YSH-L1* | 28 | 4.896 (476) | 5.441 (529) | 8.239 (6 817) | 92.6 | 143 ± 12 | 143 ± 12 | 12.9 ± 2.3 (91) | n.d. | 143 ± 12 (100%) | ||
09YSD-L1* | 28 | 10.353 (1 722) | 11.021 (1 833) | 8.239 (6 817) | 46.6 | 149 ± 9 | 149 ± 9 | 13.2 ± 2.1 (112) | n.d. | 149 ± 9 (100%) | ||
09YSD-L2* | 28 | 7.056 (1 082) | 6.873 (1 054) | 8.072 (6 817) | 97.4 | 159 ± 11 | 159 ± 11 | 13.3 ± 1.7 (99) | n.d. | 159 ± 11 (100%) | ||
09YSD-L3* | 28 | 9.874 (2 210) | 11.379(2 547) | 8.072 (6 817) | 0 | 129 ± 10 | 135 ± 8 | 12.7 ± 1.7 (102) | n.d. | 129 ± 10 (100%) | ||
09YCG-L2* | 28 | 6.341 (857) | 6.659 (900) | 8.407 (6 817) | 45.1 | 154 ± 11 | 154 ± 11 | 12.5 ± 2.0 (106) | n.d. | 154 ± 11 (100%) | ||
Central ages calculated using dosimeter glass IRM540 and ξ‐IRRM540 = 233.74 ± 6.18 (analyst PH). ρs(Ns). spontaneous track densities (105 cm-2) and numbers measured in internal mineral surfaces; ρi(Ni). induced dosimeter track densities (105·cm-2) and numbers on external mica detectors; ρd(Nd). dosimeter track densities (105 cm-2) and numbers on external mica detectors; Chi-sq. P (%). probability of obtaining χ2‐test value, a probability > 5% is indicative of a homogenous population. Data were calculated using Track Key v 4.2 software (Dunkl, 2002). Radial Plotter automatically performs a χ2-test for statistical homogeneity of fission track data. For populations that have failed this test, Radial Plotter program implements the mixture modelling algorithm (Vermeesch, 2009). Data marked "*" cited from Han et al. (2015). |