
Citation: | Jiyu Chen, Qiang Li, Qiufang He, Heinz C. Schröder, Zujun Lu, Daoxian Yuan. Influence of CO2/HCO3- on Microbial Communities in Two Karst Caves with High CO2. Journal of Earth Science, 2023, 34(1): 145-155. doi: 10.1007/s12583-020-1368-9 |
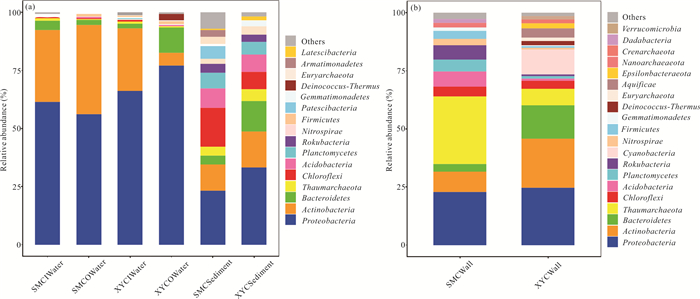
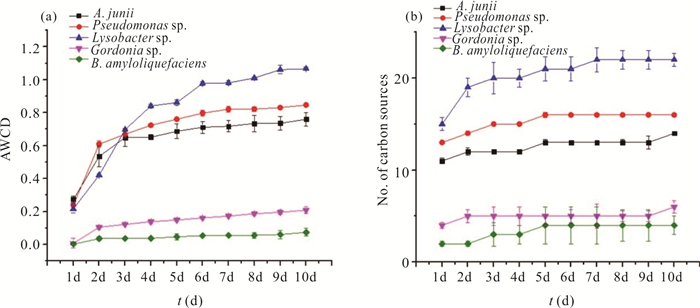
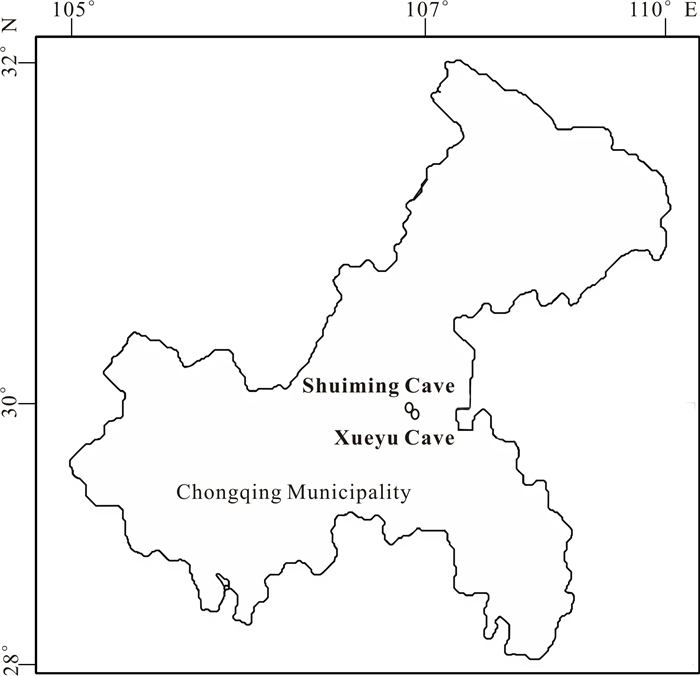
There is limited knowledge about microbial communities and their ecological functions in karst caves with high CO2 concentrations. Here, we studied the microbial community compositions and functions in Shuiming Cave ("SMC", CO2 concentration 3 303 ppm) and Xueyu Cave ("XYC", CO2 concentration 8 753 ppm) using Illumina MiSeq high-throughput sequencing in combination with BIOLOG test. The results showed that
The increase in the atmospheric CO2 concentration has an impact on the carbon cycle of terrestrial ecosystems (Paerl et al., 2016; Willis and MacDonald, 2011; Ebersberger et al., 2003). As the main life form of terrestrial ecosystem, microbes are involved in element cycling of ecosystems, which produces feedbacks to environment and climate. Therefore, studying microbial community compositions and functions is of utmost importance to understanding of the biogeochemical cycling of carbon in ecosystems (Fuhrman, 2009; Rothschild and Mancinelli, 2001). Previous studies have showed the influence of CO2 concentration on microorganisms in terrestrial ecosystems. For example, elevated CO2 concentration will change the structure and functions composition of soil microbial community (Yang et al., 2019). CO2 concentration enhancement can lead to decrease of Gram-positive bacteria in grass soil (Fu et al., 2019) and to decrease of the content of phospholipid-derived fatty acids in bacteria, fungi, and Gram-negative bacteria in forest soil (Deng et al., 2016). However, the atmospheric CO2 concentration mainly has an indirect effect on soil bacteria via plant root system in grassland and woodland (Wang et al., 2017). Caves are one of the most important terrestrial ecosystems, in which CO2 can directly affect microbial growth and ecological functions. Therefore, the study of microbial diversity and function and their response to environmental factors (particularly, different CO2 concentrations) in caves can provide a data basis for assessing the impact of CO2 concentration on terrestrial ecosystems and for improving our understanding of interactions between microorganisms and environment.
The karst area accounts for 15% of the global ice-free land area (Palmer, 2017). Karst caves are formed mainly by geological processes such as dissolution, physical weathering and volcanic activity. Karst caves are dark, lacking organic matter from photosynthesis, and geographically relatively isolated. Therefore, they are considered as terrestrial oligotrophic environments under extreme conditions (Chen et al., 2016; Deininger et al., 2016; Wong and Breecker, 2015; Zhao et al., 2012). However, caves host high diverse microbes (Pedersen, 2000). In the meanwhile, the cave entrances mostly directly connected to the outside and is more easily accessible than other subsurface environment (Barton et al., 2007), thus karst caves are an ideal sites to study microbial diversity and function of the subsurface biosphere (Barton et al., 2004).
In the past, a lot of researches have been performed on cave microbial community. For example, approximately 350 Actinomycetes species were retrieved from rock walls in the Altamira Cave, northern Spain (Groth et al., 1999). Fifty-one different bacterial and archaeal species were discovered in the Wind Cave, the United States (Chelius et al., 2009). Cave microbial communities showed a great diversity and many ecological functions, among which bacteria were mainly involved in biogeochemical cycle in cave environments. For example, bacterial genes were involved in carbon degradation, carbon fixation, methane metabolism, nitrification, nitrate reduction and ammonia assimilation in five caves in Mizoram State, northeastern India (de Mandal et al., 2017). The functional genes involved in sulfur oxidation and CO2 fixation could be detected in Acidithiobacillus thiooxidans, the dominant species in the bacterial biofilm of the sulfide-rich Frasassi Cave, Italy, indicating bacterial involvement in carbon cycle in this cave (Bauermeister et al., 2012). The metabolic functions of the bacterial community in drip water of the Buddhist Monk Cave in Hubei, China, were mainly affected by temperature and pH, and carbon-fixing bacteria increased with increasing CO2 concentration in microcosm experiments (Yun et al., 2018). Therefore, the CO2 concentration is an important factor affecting the bacterial community and function in caves. However, the effect of high CO2 concentration on bacterial community remains elusive. It is even more difficult to compare the impact of CO2 concentration with other environmental factors on the bacterial community, which directly limits understanding of the carbon cycle in caves.
The concentration of CO2 in karst caves is high and can reach several thousand ppm due to dripping and degassing (Baldini et al., 2008). Therefore, karst caves are a natural laboratory for studying microbial response to elevated atmospheric CO2 concentrations. The CO2 concentration in Xueyu Cave (XYC) in southwestern China is as high as 8 751 ppm. Previous studies showed that variations of CO2 concentration inside the XYC were derived from groundwater degassing. Rainfall is an important factor that controls the partial pressure of CO2 in the overlying soil, and gas exchange because temperature changes is an important reason for sudden changes in the partial pressure of atmospheric CO2 in the cave (Lü et al., 2019). Lü et al. (2019) found that the microbial diversity in the XYC exhibited temporal and spatial variations and bacteria, fungi and Actinobacteria show different changes, and that natural conditions (such as precipitation) had an important effect on the microorganisms in the groundwater of the cave. However, it is unclear how CO2 affects the microbial community. This also limits our understanding of element cycle in karst caves with various CO2 concentrations. Therefore, further research is urgently needed in this field. In order to fill the above knowledge gaps, XYC and Shuiming Cave (SMC, an undeveloped cave near the Xueyu Cave, was a simple, stable and relatively closed cave system with CO2 concentration of 3 303 ppm.) were selected as research objects in the present study. The purposes of this study were to explore microbial community structure and its relationship to CO2 concentration and other related environmental factors, and to predict microbial functions at different locations (cave rock walls, sediments and groundwater) and their response to high CO2.
The XYC (29º47′00″N, 107º47′13″E) is located in downstream of the Longhe River, a tributary on the South Bank of the Yangtze River, Fengdu County, Chongqing (Fig. 1). The temperature is 16–18 ºC, and the humidity is always more than 95% inside the XYC. The XYC area is dominated by subtropical humid monsoon climate and is affected by the southwestern Indian Monsoon and southeastern Asian Monsoon. Precipitation is mainly concentrated from April to October every year, and the average annual precipitation is 1 072 mm. The vegetation mainly consists of evergreen broad-leaved forests and thickets. The XYC is 1 643.97 m long, and can be divided into three layers: upper, middle, and bottom. Underground rivers exist all year round, with an accessible length of about 1.2 km. The entrance of the XYC is 55.5 m higher than the level of the Long River, and the elevation is 233 m (Chen et al., 2020). The CO2 concentration of the XYC (8 751 ppm) is similar to that in the atmosphere of the primitive Earth.
The SMC (29º47′00″N, 107º47′00″E) is not undeveloped. CO2 concentration is 3 303 ppm inside the SMC. The SMC entrance is ten meters higher than the Longhe River water surface. Its underground river water flow is greater than that in the XYC, and there is a spring accumulation platform at the entrance. Near the entrance is a larger cavern, where groundwater converges into a pool and eventually flows into the Longhe River. The microbial ecosystem is simple and less disturbed by human activities.
The XYC (29º47′00″N, 107º47′13″E) is located in downstream of the Longhe River, a tributary on the south bank of the Yangtze River, Fengdu.
Sampling cruise was performed in October 2018. The water temperature (T), dissolved oxygen (DO), and pH value were measured using the ODEON multi-parameter water quality monitor produced by Ponsel, France. The accuracy was 0.1 ℃, 0.01 mg·L-1, and 0.01 pH unit, respectively. For CO2 and CH4 concentration measurements, gas samples at the entrance and in the interior of the XYC and SMC were collected into gas bags. For measuring the contents of anions and cations, water samples were collected into 60-mL polyethylene plastic bottles and were stored in a dark box at 4 ℃. Inside the two caves, sediments and rock wall surface soils were collected into sterile bags for geochemistry measurement and microbial analyses, and they were marked as SMCSediment, SMCWall, XYCSediment, and XYCWall respectively. Water samples inside the caves ("IWater") or at the entrance of the caves ("OWater") were collected with the use of a glass suction filter fixed with one filter membrane (pore size 0.22 μm), and they were marked as SMCIWater, SMCOWater, XYCIWater and XYCOWater, respectively. The resulting biomass-contained filters were collected into sterilized centrifuge tube. Both sediments/soils and biomass-contained filters for microbial analyses were stored on dry ice in the field and during transportation. The samples were transported to the laboratory and stored at -80 ℃ until analyzed.
In laboratory, anions (HCO3- and NO3-) were determined by an ion chromatograph (861 Advanced Compact IC Metrohm, Switzerland), and cations (Ca2+ and Mg2+) were measured using an ICP-OES spectrometer (IRIS Intrepid II XSP, Thermo Fisher Scientific, USA). The accuracy of both methods was 0.01 mg·L-1. Total organic carbon (TOC) was measured by the Multi-N/C3100 carbon and nitrogen analyzer (Jena Company, German). CO2 (ppm) and CH4 (ppm) contents were measured using gas chromatography (GC) Agilent 8890. Sulfuric acid accelerator digestion and Kjeldahl method were used to measure the soil total nitrogen (TN) content (Bremner, 1960). Nitric acid-hydrogen peroxide-hydrofluoric acid digestion was used to measure the content of total phosphorus (TP) and total calcium in soil by ICP-AES (Tian and Shao, 2013).
Genomic DNA was extracted using the Fast DNA SPIN kit (MP Biomedical, Solon, OH, USA). 16S rRNA gene was amplified from the extracted DNA using a universal primer set of 515F (5'-GTGYCAGCMGCCGCGGTA-3') / 806R (5'-GGACTACVSGGGTATCTAAT-3'). The DNA gel extraction kit from Axygen (Union City, CA, USA) was used to purify the successful PCR products. Sequencing was performed in an Illumina MiSeq platform at Guangdong Magigene Biotechnology Co. Ltd., Guangzhou, China.
Data analysis followed the UPARSE process (Edgar, 2013). FLASH was used to stitch and trim paired samples (Magoč and Salzberg, 2011). The forward and reverse primer sequences were removed, and QIIME v1.8.0 was then used for mass filtering (Caporaso et al., 2012). Sequence reads were removed when theycontained (1) three consecutive low-quality (Phred quality scores < 30) bases, (2) ambiguous bases, and (3) less than 75% of continuous read length. Uchime module and de novo method in USEARCH1 were used for chimera inspection (Edgar et al., 2011). Qualified reads were clustered using USEARCH. All eligible fragments were truncated to 235 nt, and all singletons and fragments shorter than 235 nt were removed. The UPARSE-OTU algorithm (Edgar, 2013) was used to classify the operating classification unit (OTU) according to 97% cutoff, and then selected the representative OTU sequences to compare in silvav132 database. Alpha diversity (i.e., Simpson, Shannon, Equitability, and Observed OTU) was calculated through QIIME v1.8.0.
SPSS 25 software (SPSS Inc., Chicago, IL, USA) was used to analyze microbial difference among samples (Louca et al., 2016). The number of OTUs exceeding 0.5% of the total OTUs was defined as the dominant OTUs, and a heat map of the dominant OTUs was drawn (Luo, 2009). In the meanwhile, Pearson correlation was performed to analyze the correlation between geochemical parameters and dominant OTUs. The weighted UniFrac distance algorithm of Bray-curtis and PCoA were used to analyze the similarity of OTUs among samples (Team, 2009). In order to predict the potential microbial ecological function in the cave, the obtained OTUs were compared with the FAPROTAX 1.1 database (Anderson and Willis, 2003).
Biolog ECO plates (Biolog, America) containing 31 different carbon sources were used to test the carbon source utilization of the selected strains retrieved from the wall and sediment samples (Chen et al., 2020). For each of the selected strains, 150 μL of bacterial culture was inoculated per well of the ECO plate, followed by incubation at 28 ºC. During cultivation, readings were taken at a wavelength of 590 nm at regular intervals (24 h) using a microplate reader. The average of the optical density (OD) values of 3 replicates of each substrate minus the OD value of the negative control was taken and used for data analysis. The average color change rate (AWCD) was considered as an indicator for evaluation of the carbon source utilization capacity of each tested strain (Jiang et al., 2006). The R language was used to draw a heat map based on the color change of the carbon source to show the carbon source utilization preferences and the capabilities of the tested strains.
The sequences retrieved in this study were deposited in the National Center for Biotechnology Information under the BioProject accession numbers SRR12328005-SRR12328012 and GenBank accession numbers of MT378306-MT3783010.
The geochemical characteristics of the samples were shown in Table S1. The HCO3- concentrations of inside XYC, inside SMC, XYC entrance, and SMC entrance were in a descending order. The CO2 concentration was the highest of inside XYC and the lowest at the XYC entrance. The CH4 content in the SMC was significantly lower than that in the XYC. The TOC content of the solid sample was lower and the total P content and total Ca content were higher in the XYC than that in the other cave. The XYC water samples had higher pH, Ca2+, NO3- and HCO3-, but lower Mg2+ content than the SMC water samples. Almost no difference in temperature was observed between the XYC and SMC. And, there was less difference of DO in the underground river water.
The microbial distribution differed at the phylum level among samples (Fig. 2). The dominant phyla in the studied water samples inside the two caves and at the entrance of the two caves were Proteobacteria, Actinobacteria and Bacteroidetes (Fig. 2a). The proportions of the three dominant bacteria in water samples were 96.41% (relative frequency, hereinafter unless stated otherwise) inside the SMC, 96.76% at the entrance of SMC, 95.14% inside the XYC and 93.44% at the entrance of XYC. Bacteroidetes accounted for a higher proportion and Actinobacteria accounted for a lower proportion in the studied water samples at the entrance of XYC than that from the three other sampling sites. In the sediment samples, the dominant phyla of SMC were Proteobacteria (23.24%), Chloroflexi (16.90%) and Actinobacteria (11.23%); and the dominant phyla of XYC were Proteobacteria (33.34%), Actinobacteria (15.37%) and Bacteroidetes (13.16%). In the studied rock wall samples (Fig. 2b), the dominant phyla of SMC were Thaumarchaeota (29.24%), Proteobacteria (22.85%), Actinobacteria (8.80 %), Acidobacteria (6.70%) and Rokubacteria (6.15%); and the dominant phyla of XYC were Proteobacteria (24.77%), Actinobacteria (20.96%), Bacteroidetes (13.16%), Thaumarchaeota (7.05%) and Cyanobacteria (10.74%).
The heatmap showed the distribution of dominant OTUs among samples (Fig. S1). Among the water samples, the water sample inside SMC was dominated by OTUs affiliated with Acinetobacter, Aeromonas, Micrococcaceae, and Micrococcaceae (2 396, 2 444, 996, 2 652, and 1 054, respectively) (Fig. S1a); the water sample at theentrance of SMC was dominated by OTUs affiliated with Glutamicibacter, Micrococcaceae, Enterobacteriaceae, Vogesella, and Micrococcaceae (336, 2 067, 3 167, 809, and 996, respectively); the water sample inside XYC was dominated by OTUs affiliated with Massilia, Acinetobacter lwoffii, and Comamonas (647, 2 942, and 2 897, respectively); the water sample at the entrance of XYC was dominated by OTUs affiliated with Acinetobacter, Flavobacterium, and Thermomonas (705, 3 109, and 2 742, respectively) (Fig. S1a). The sediment inside SMC was dominated by OTUs affiliated with Nitrosomonadaceae and Flavobacterium (1 000 and 20, respectively) (Fig. S1b); the sediment inside XYC was dominated by OTUs affiliated with Acinetobacter, Flavobacterium, Nitrospira, and Gaiella (955, 20, 1 248, and 2 146, respectively). The SMC rock wall sample was dominated by OTUs affiliated with Nitrososphaeraceae, Micrococcaceae, and Acinetobacter (1 640, 2 652, 198 and 705 respectively); the XYC rock wall sample was dominated by OTUs affiliated with Micrococcaceae and Psychroflexus (2 652 and 1 087, respectively) (Fig. S1b).
The microbial alpha diversity varied among the studied samples (Table 1). The observed OTUs, Shannon, Simpson, and Equitability ranged 450–976, 3.191–5.445, 0.861–0.989, and 0.519–0.817, respectively (Table 1). The microbial diversity of the water samples was higher at the entrance of the two caves than that inside the caves. However, the microbial diversity of the water samples inside XYC was higher than that inside SMC. The microbial diversity of the sediment samples did not show significant difference between the two caves, while the microbial diversity of the rock wall samples was more diverse in XYC than that in SMC.
Sample ID | Observed_OTUs | Shannon | Simpson | Equitability |
SMCIWater | 470 | 3.191 | 0.861 | 0.519 |
SMCOWater | 450 | 3.599 | 0.920 | 0.589 |
XYCIWater | 570 | 3.648 | 0.914 | 0.575 |
XYCOWater | 602 | 3.769 | 0.869 | 0.589 |
SMCSediment | 787 | 5.445 | 0.989 | 0.817 |
XYCSediment | 976 | 5.443 | 0.980 | 0.791 |
SMCWall | 787 | 5.378 | 0.978 | 0.806 |
XYCWall | 721 | 5.144 | 0.975 | 0.782 |
PCoA was plotted to show the effect of HCO3- concentration on microbial communities of water samples and of CO2 on microbial communities of rock wall samples (Fig. 3). The water samples inside the two caves and at the entrance of the SMC were grouped together, indicating that their microbial community structures were similar. The water samples at the entrance were separated from the sediments and the rock wall samples, and microbial difference between the sediment and rock wall samples of one cave was smaller than that between caves, suggesting that the HCO3-/CO2 concentration had greater influence on the microbial communities in the studied cave sediment and rock wall samples.
Most dominant OTUs in the studied water and sediment samples were significantly correlated with T, DO, Mg2+, NO3-, pH, HCO3-, and Ca2+ (Fig. 4a). Most dominant OTUs of the rock wall samples were significantly correlated with TOC, N, CO2, P and Ca (Fig. 4b). In the water and sediment samples, OTUs belonging to Micrococcaceae and Aeromonas (2 652 and 2 444, respectively) were significantly correlated with NO3- and Mg2+. OTUs belonging to Micrococcaceae and Enterobacteriaceae (2 067 and 3 167, respectively) were significantly correlated with DO. OTU955 belonging to Acinetobacter was significantly correlated with pH, temperature and HCO3-. OTUs belonging to Flavobacterium, Nitrospira, and Gaiella (20, 1 248, and 2 146, respectively) were significantly correlated with pH, temperature, DO, HCO3- and Ca2+. OTU647 affiliated with Massilia was significantly correlated with NO3-, pH, T, DO, Ca2+ and Mg2+. OTU1559 affiliated with Pseudomonas was significantly correlated with pH and T. OTU996 affiliated with Micrococcaceae was significantly correlated with NO3-, T, DO, HCO3-, Ca2+ and Mg2+. OTU336 affiliated with Glutamicibacter was significantly correlated with DO, HCO3- and Ca2+. OTU809 affiliated with Vogesella was significantly correlated with NO3-, DO and Mg2+. In the rock wall samples, OTUs belonging to Psychroflexus, Thermosynechococcus, Hydrogenobacter, Beijerinckiaceae, Chloroplast, Microbacteriaceae, Ralstonia, Synechococcus and Sulfurimonas (1 087, 2 437, 648, 1 544, 1 573, 1 175, 763 305, and 2 817, respectively) were significantly positively correlated with CO2 concentration, P and Ca, and significantly negatively correlated with TOC and N (Fig. 4b). While an opposite trend was observed for the other OTUs except those affiliated with Micrococcaceae, Acinetobacter, Paeniglutamicibacter, Pirellulaceae Mitochondria, Woesearchaeia, Micrococcaceae and Woesearchaeia (2 652, 2 396, 1 054, 533, 1 367, 2 965, 2 067 and 629, respectively).
There were different microbial ecological functions in the studied samples of different types. Among the studied samples, a total of twenty microbial functions were identified as dominant (relative abundance > 1%), and they were aerobic ammonia oxidation, aerobic nitrite oxidation, nitrification, induction of sulfur compounds, knallgas bacteria, dark hydrogen oxidation, dark sulfide oxidation, dark thiosulfate oxidation, dark oxidation of sulfur compounds, fermentation, aerobic chemoheterotrophy, animal parasites or symbionts, aromatic compound degradation, nitrate respiration, nitrate reduction, chloroplasts, cyanobacteria, oxygenic photoautotrophy, photoautotrophy, phototrophy and chemoheterotrophy. In the water and sediment samples shared six common microbial metabolic functions: aerobic chemoheterotrophy, animal parasites or symbionts, aromatic compound degradation, nitrate reduction, and chemoheterotrophy. The sediment samples shared aerobic nitrite oxidation and nitrification. Aerobic ammonia oxidation was found in the rock wall sample of SMC. These abovementioned 21 microbial functions (except aerobic nitrite oxidation) were found in the rock wall of XYC.
Among them, there were six different microbial functions with evident differences in various points, thus methanogenesis, methylotrophy, nitrification, aromatic compound degradation, photoautotrophy, and chemoheterotrophy were selected from the studied samples (Fig. 5). It was found that methanogenesis and methylotrophy functions were exclusively co-existing in the sediments of SMC. The nitrification function was present in the rock wall samples of SMC and XYC with low abundance. Aromatic compound degradation function was present in all the studied samples regardless of sample types, with being more abundant in the water samples than that in the sediment samples. Chemoheterotrophy function was present in all the studied samples, with being more abundant in the water samples of the two caves and in the sediment samples of XYC than the other samples. Photoautotrophy function was more abundant in the rock wall of XYC and less abundant in the sediment of SMC (about 0.1%–0.15%) than that in the other samples.
These six different microbial functions had significant correlations with the measured geochemical parameters (Figs. S2 and S3). Specifically, the methanogenesis and methylotrophy functions were positively correlated with TOC and N, and was negatively correlated with CO2, P and Ca. Nitrification function was positively correlated with HCO3-, pH, Ca2+, TOC and N, and was negatively correlated with T, DO, CO2, P, and Ca. The function of aromatic compound degradation was positively correlated with TOC, N, and was negatively correlated with CO2, P and Ca. Photoautotrophy was positively correlated with CO2, P, and Ca, and was negatively correlated with TOC, and N. Chemoheterotrophy was positively correlated with NO3- and was negatively correlated with Mg2+.
In one of our previous studies, a total of 244 bacterial strains were obtained from the same batch of studied samples (Chen et al., 2020). In this study, five strains (representing different species present in different types of samples and in samples of different caves, as shown in Table 2) were selected for BIOLOG test for their carbon source utilization. These bacterial strains showed different carbon source utilization preferences (Fig. S4). Among them, Gordonia sp. preferred esters and alcohol carbon sources. Bacillus amyloliquefaciens preferred amino acids, amines and carbohydrate carbon sources, and Acinetobacter junii preferred carbohydrates, esters and amino acids. Pseudomonas sp. prefers amino acids and ester carbon sources. Lysobacter sp. preferred ester and acid carbon sources. Overall, strain XYC_W_90 from the cave samples with higher CO2/HCO3- concentration exhibited lower AWCD and lower number of utilized carbon sources (S) than the other strains (e.g., SMC_S_097, SMC_S_234, SMC_W_131, SMC_S_312) (Fig. 6). Strain SMC_W_131 retrieved from the rock wall samples of SMC had the highest AWCD and S values.
ID of Isolates | Isolation source | The closest reference strains (GenBank Accession no.) | Identity |
SMC_S_097 | More abundant in SMC and less abundant in XYC | Acinetobacter junii (MK053916) | 100% |
SMC_S_234 | More abundant in SMC and less abundant in XYC | Pseudomonas sp. (HE614849) | 99% |
SMC_W_131 | Present in the sediment (SMC and XYC) and rock wall (SMC) | Lysobacter sp. (JX415443) | 99% |
SMC_S_312 | Present in the sediment (SMC and XYC) | Gordonia sp. (MH101280) | 100% |
XYC_W_90 | Present in the rock wall (SMC and XYC) | Bacillus amyloliquefaciens (MK336717) | 100% |
Microbial community in the water samples at the entrance was more diverse than the other samples inside the SMC and XYC (Table 1), suggesting that high CO2 may depress microbial diversity in caves. This finding was consistent with previous studies that CO2 decreases bacterial diversity in the western Pacific Ocean (Xie et al., 2016). Microbial community in the XYC water samples (pH 8.75) was more diverse than that in the SMC (pH 7.63) (Table S1), indicating that high pH may enhance microbial diversity in caves. This finding was also consistent with previous studies on microbial diversity in cave drip water of Monk Cave (Yun et al., 2018). Therefore, it is reasonable to speculate that pH may be one main factor affecting the microbial diversity of the water samples from the two caves. The microbial diversity in the XYC rock wall samples was lower than that in SMC, suggesting CO2 concentration may be important in shaping microbial community in rock wall samples in caves considering that the CO2 concentration in XYC was about three times that of XYC (8 751 ppm vs 3 303 ppm). This finding was in agreement with previous results in soil and seawater (Zhao et al., 2014). Taken together, high CO2 concentrations can inhibit microbial diversity in the rock wall of caves.
In addition, the community composition in the sediment and rock wall samples was quite different between the two caves. The proportion of Thaumarchaeota was higher than that of Proteobacteria in the SMC rock wall samples, while the trend was opposite in the XYC. Previous studies had shown that the soil microbial community structure changes significantly with increasing CO2 concentration. For example, the abundance of Bacteroidetes and Proteobacteria (Könneke et al., 2005) increased with increasing CO2 concentration. We speculated that the higher proportion of Proteobacteria than that of Thaumarchaeota in XYC was caused by the high concentration of CO2/HCO3-. Accordingly, a high concentration of CO2/HCO3- can affect the microbial community structure of karst cave walls and sediments.
The dominant OTUs in the cave samples showed different correlations with environmental factors. For example, the above mentioned Thaumarchaeota was dominant in the rock wall samples of the two caves with a high concentration of CO2. Previous studies showed that Thaumarchaeota was independent of photosynthesis but only relying on ammonia oxidation in the salt water of the cave to generate energy, and thus thrived in dark caves (Pearson et al., 2001). Thaumarchaeota could obtain energy supplement by fixing CO2 (Zhang and He, 2012; Wuchter et al., 2003). Therefore it is reasonable to observe the high abundance of Thaumarchaeota in the rock wall samples.
In addition, high CO2 can inhibit the growth of most bacteria. For example, in the cave wall samples, 23.9% of the dominant OTUs were positively correlated with the CO2 concentration, and 76% of the dominant OTUs were negatively correlated with CO2. Microorganisms that tolerate high CO2 or even prefer CO2 were often mixotrophic such as Rhodoferax and Chloroflexi. The former had chlorophyll-a and carotene, and the latter contained green pigments, but their photosynthesis did not produce oxygen (Garrity et al., 2001; Hiraishi et al., 1991). The autotrophic growth of mixotrophic bacteria relied on nutrients in caves. For example, Hyphomicrobium, the closest relative of OTU 557, can exhibit aerobic growth by using one-carbon compounds such as methanol and methylamine as the only carbon source and energy source, and anaerobic growth with the use of nitrate (Zhang et al., 2012). Hyphomicrobium can use CO2 instead of methane (Jeong and Kim, 2019). The presence of Hyphomicrobium-related sequences suggested that cave bacteria were involved in carbon cycle. So it is reasonable to observe more Hyphomicrobium-related sequences inside the cave with higher CO2.
It is notable that high CO2/HCO3- concentration inhibited microbial diversity and abundance in the studied caves. The reasons may be explained by the effect of CO2 on bacterial metabolism (Chen et al., 2020). Moreover, high CO2 reduced pH in the environment, resulting in affecting microbial growth (Pierce and Sjögersten, 2009). Besides that, high CO2 affected the enzyme activity of soil (Zhang et al., 2016). Therefore, it is reasonable to observe the effect of high CO2/HCO3- concentration on the cave microbial community.
Potential microbial metabolic functions differed among the studied samples of different types. Among the identified microbial functions, degradation of aromatic compounds and chemoheterotrophy were found in each of the studied samples. However, the abundance of the aromatic compound degradation was the lowest in the XYC rock wall. This may be due to the fact that most bacteria mediating aromatic compound degradation are capable of growing on organic matter instead of inorganic carbon (He et al., 2016). XYC had the lowest TOC and the highest CO2 concentration (Table S1), which suppresses the abundance of bacteria involving aromatic compound degradation. It is notable that bacteria with chemoheterotrophy potential were abnormally higher in XYC than that in SMC, considering that this type of bacteria require organic matter for growth and that the TOC content of XYC was low. This could be explained by the presence of a large quantity of bacteria with photoautotrophy potential in XYC, which may be caused by the presence of light in XYC. Autotrophic bacteria could produce enough organic matter for the growth of bacteria of chemoheterotrophy potential. In contrast, no visible light was present in the SMC, so that the sediment samples contained much less (about 0.1%–0.15%) bacteria with photoautotrophy function. For example, there was weak-band biokarstification near the entrances of dark cave in Guangxi, Guizhou and other places in China (Wang et al., 1998); eleven typical bryophyte communities were discovered among three karst caves in the Rhone-Alps region of France, and diverse bryophytes (8 families 12 genera 15 species) were widely distributed in caves in Europe and worldwide; in addition, two kinds of fluorescent bryophytes (Cyathodium cavernarum and C. smaragdium) were discovered in one karst cave of Guangxi, China, and green light was found to be emitted in dark caves from these two variants (Zhang et al., 2004). C. cavernarum was found at the entrance of the cave, while C. smaragdium grew 0.5 to 22 m away from the entrance inside the cave. Therefore, we assume that the presence of bacteria with photoautotrophy function in the SMC sediment may be caused by fluorescence and/or other invisible light.
Furthermore, it is remarkable that sequences related to Sphingomonas sp., aerobic anoxygenic phototrophic bacteria (AAPB), were in the two caves. AAPB are a type of heterotrophs that can supplement organic carbon deficiency through CO2 fixation. So more organic carbon might have been detained because of AAPB, which extends the period of karst carbon cycle (Li et al., 2017) Therefore, AAPB-like bacteria might play an important role influencing element cycle in the studied caves. In addition, the high abundance of Cyanobacteria in XYC is reasonable because a proper amount of CO2 can promote cyanobacterial growth and photosynthetic rate (Gao and Yu, 2000).
In addition, the strains from XYC had a lower carbon source utilization rate than different carbon source utilization preference from SMC (Figs. 6 and S4). Previous studies had found that microorganisms with different phylogenetic categories showed different preferences for carbon substrates (Goldfarb et al., 2011; Vanfossen et al., 2009; Kramer and Gleixner, 2008). For example, addition of sucrose can promote the growth of Actinobacteria, β-Proteobacteria (Burkholderiales and Rhodocyclales) and some other Proteobacteria. Addition of glycine can stimulate the growth of certain γ-Proteobacteria (Enterobacteriales and Alteromonadalaes) (Goldfarb et al., 2011). Different types of microorganisms in one ecosystem prefer different carbon sources, which alleviates nutrition competition pressure among species and maintains microbial genetic, functional diversity, and stability of one ecosystem (McCann, 2000). Therefore, different carbon utilization preferences may affect microbial functional diversity and stability of one ecosystem. Microorganisms tended to use different carbon sources (amino acids vs. sugar) under different CO2 concentrations (350 ± 50 ppm vs. 750 ± 50 ppm) (Liu et al., 2015). It can be speculated that high CO2 may affect microbial growth in caves through changing their preference for different carbon sources, and thus affect the entire cave ecosystem.
It is notable that microbes with methanogenesis potential were dominant in the sediment of SMC and were significantly negatively correlated with CO2 (Fig. S2), and bacteria with methanotrophy function were more abundant in SMC than that in XYC (Fig. S5). In the meanwhile, microbes with syntrophic methanogenesis potential, i.e., a bacterium that symbiotically coexists with methanogens (Dubbs and Whalen, 2010), existed in XYC and SMC, which was also negatively correlated with the CO2 concentration (Figs. S3 and S6). These results indicated that high CO2 can inhibit the growth of methanogenesis and syntrophic methanogenesis. The CH4 gas concentration at the entrances of the two caves was higher than that inside caves, indicating that XYC may be a sink of atmospheric methane, which is consistent with previous studies (McDonough et al., 2016). Interestingly, it was surprising to find that although microbes with methanogenesis potential in XYC was in relatively low abundance, the methane content in XYC was significantly higher than that in SMC (Table S1). Such high concentration of CH4 could be of biological origin due to the following reason: air in soil and caves could be involved in methanogenesis (McDonough et al., 2016), and the use of CO2 to produce methane is the most common metabolic pathway known in methanogens (Liu and Whitman, 2008); the high concentration of CO2 (i.e., substrate for methanogenesis) in XYC might provide basis for high methane through methanogenesis. In addition, high concentration of CH4 was ever found to co-exist with high CO2 in caves (Hutchens et al., 2004). However, other sources could not be excluded for the methane in the studied caves due to the lack of stable carbon isotopic characteristic of methane and microbial methane production rate test, which awaits further investigation.
Karst caves with different CO2 concentrations had different microbial community compositions and potential functions. Microbial community responded differently to various environmental factors in the studied caves with high CO2. The HCO3-/CO2 concentration was an important factor affecting the microbial community composition of the two caves. The high CO2 may affect the microbial growth by changing the pH of the cave environment, affecting the microbial enzyme systems, and by changing microbial preference for different types of carbon sources.
ACKNOWLEDGMENTS: This study was supported by the National Key Research and Development Program of China (No. 2016YFC0502501), the Special Funds for Local Science and Technology Development Guided by the Central Government, China (No. GuikeZY20198009), the Natural Science Foundation of Guangxi (Nos. 2015GXNSFGA139010 and 2017GXNSFBA198204), the Science and Technology Development Fund of Guangxi Academy of Agricultural Sciences (No. 2018YT07) and the Fundamental Research Funds of CAGS (No. 2020022). We are grateful to the anonymous reviewers whose constructive comments significantly improved the quality of the manuscript. The final publication is available at Springer via https://doi.org/10.1007/s12583-020-1368-9.Anderson, M. J., Willis, T. J., 2003. Canonical Analysis of Principal Coordinates: A Useful Method of Constrained Ordination for Ecology. Ecology, 84(2): 511–525. https://doi.org/10.1890/0012-9658(2003)084[0511:caopca]2.0.co;2 |
Baldini, J. U. L., Mcdermott, F., Hoffmann, D. L., et al., 2008. Very High-Frequency and Seasonal Cave Atmosphere PCO2 Variability: Implications for Stalagmite Growth and Oxygen Isotope-Based Paleoclimate Records. Earth and Planetary Science Letters, 272(1/2): 118–129. https://doi.org/10.1016/j.epsl.2008.04.031 |
Barton, H. A., Taylor, M. R., Pace, N. R., 2004. Molecular Phylogenetic Analysis of a Bacterial Community in an Oligotrophic Cave Environment. Geomicrobiology Journal, 21(1): 11–20. https://doi.org/10.1080/01490450490253428 |
Barton, H. A., Taylor, N. M., Kreate, M. P., et al., 2007. The Impact of Host Rock Geochemistry on Bacterial Community Structure in Oligotrophic Cave Environments. International Journal of Speleology, 36(2): 93–104. https://doi.org/10.5038/1827-806X.36.2.5 |
Bauermeister, J., Ramette, A., Dattagupta, S., 2012. Repeatedly Evolved Host-Specific Ectosymbioses between Sulfur-Oxidizing Bacteria and Amphipods Living in a Cave Ecosystem. PLoS One, 7(11): e50254. https://doi.org/10.1371/journal.pone.0050254 |
Bremner, J. M., 1960. Determination of Nitrogen in Soil by the Kjeldahl Method. The Journal of Agricultural Science, 55(1): 11–33. https://doi.org/10.1017/s0021859600021572 |
Caporaso, J. G., Lauber, C. L., Walters, W. A., et al., 2012. Ultra-High-Throughput Microbial Community Analysis on the Illumina HiSeq and MiSeq Platforms. The ISME Journal, 6(8): 1621–1624. https://doi.org/10.1038/ismej.2012.8 |
Chelius, M. K., Beresford, G., Horton, H., et al., 2009. Impacts of Alterations of Organic Inputs on the Bacterial Community within the Sediments of Wind Cave, South Dakota, USA. International Journal of Speleology, 38(1): 1–10. https://doi.org/10.5038/1827-806x.38.1.1 |
Chen, F. H., Jia, J., Chen, J. H., et al., 2016. A Persistent Holocene Wetting Trend in Arid Central Asia, with Wettest Conditions in the Late Holocene, Revealed by Multi-Proxy Analyses of Loess-Paleosol Sequences in Xinjiang, China. Quaternary Science Reviews, 146: 134–146. https://doi.org/10.1016/j.quascirev.2016.06.002 |
Chen, J. Y., Lu, Z. J., He, Q. F., et al., 2020. Characteristics of Culturable Bacterial Communities in Karst Caves with Different CO2 Concentrations―An Example from Xueyu Cave and Shuiming Cave in Chongqing. Carsologica Sinica, 39(2): 264–274. https://doi.org/10.11932/karst2020y20 (in Chinese with English Abstract) |
de Mandal, S., Chatterjee, R., Kumar, N. S., 2017. Dominant Bacterial Phyla in Caves and Their Predicted Functional Roles in C and N Cycle. BMC Microbiology, 17(1): 90. https://doi.org/10.1186/s12866-017-1002-x |
Deininger, M., Lippold, J., Abele, F., et al., 2016. Comparison of a Spatio-Temporal Speleothem-Based Reconstruction of Late Holocene Climate Variability to the Timing of Cultural Developments. EGU General Assembly Conference Abstracts |
Deng, S. L., Liu, F. R., Zhang, Y. M., 2016. Effects of Elevated Temperature and Doubling of CO2 Concentration on the Soil Microbial Community Structure in the Subalpine Coniferous Forest of Western Sichuan, China. Chinese Journal of Applied and Environmental Biology, 22(1): 20–26 https://doi.org/10.3724/SP.J.1145.2015.06021 (in Chinese with English Abstract) |
Dubbs, L. L., Whalen, S. C., 2010. Reduced Net Atmospheric CH4 Consumption is a Sustained Response to Elevated CO2 in a Temperate Forest. Biology and Fertility of Soils, 46(6): 597–606. https://doi.org/10.1007/s00374-010-0467-7 |
Ebersberger, D., Niklaus, P. A., Kandeler, E., 2003. Long Term CO2 Enrichment Stimulates N-Mineralisation and Enzyme Activities in Calcareous Grassland. Soil Biology and Biochemistry, 35(7): 965–972. https://doi.org/10.1016/S0038-0717(03)00156-1 |
Edgar, R. C., 2013. UPARSE: Highly Accurate OTU Sequences from Microbial Amplicon Reads. Nature Methods, 10(10): 996–998. https://doi.org/10.1038/nmeth.2604 |
Edgar, R. C., Haas, B. J., Clemente, J. C., et al., 2011. UCHIME Improves Sensitivity and Speed of Chimera Detection. Bioinformatics, 27(16): 2194–2200. https://doi.org/10.1093/bioinformatics/btr381 |
Fu, G., Zhang, H. R., Li, S. W., et al., 2019. A Meta-Analysis of the Effects of Warming and Elevated CO2 on Soil Microbes. Journal of Resources and Ecology, 10(1): 69–76. https://doi.org/10.5814/j.issn.1674-764x.2019.01.009 |
Fuhrman, J. A., 2009. Microbial Community Structure and Its Functional Implications. Nature, 459(7244): 193–199. https://doi.org/10.1038/nature08058 |
Gao, K. S., Yu, A. J., 2000. Influence of CO2, Light and Watering on Growth of Nostoc Flagelliforme Mats. Journal of Applied Phycology, 12(2): 185–189. https://doi.org/10.1023/A:1008123203409 |
Garrity, G. M., Holt, J. G., Castenholz, R. W., et al., 2001. Phylum BVI. Chloroflexi Phy. Nov. . In: Boone, D. R., Castenholz, R. W., Garrity, G. M., eds., Bergey's Manual® of Systematic Bacteriology. Springer, New York. 427–446. https://doi.org/10.1007/978-0-387-21609-6_23 |
Goldfarb, K. C., Karaoz, U., Hanson, C. A., et al., 2011. Differential Growth Responses of Soil Bacterial Taxa to Carbon Substrates of Varying Chemical Recalcitrance. Frontiers in Microbiology, 2: 94. https://doi.org/10.3389/fmicb.2011.00094 |
Groth, I., Vettermann, R., Schuetze, B., et al., 1999. Actinomycetes in Karstic Caves of Northern Spain (Altamira and Tito Bustillo). Journal of Microbiological Methods, 36(1/2): 115–122. https://doi.org/10.1016/S0167-7012(99)00016-0 |
He, M., Mei, C. F., Sun, G. P., et al., 2016. The Effects of Molecular Properties on Ready Biodegradation of Aromatic Compounds in the OECD 301B CO2 Evolution Test. Archives of Environmental Contamination and Toxicology, 71(1): 133–145. https://doi.org/10.1007/s00244-015-0236-6 |
Hiraishi, A., Hoshino, Y., Satoh, T., 1991. Rhodoferax Fermentans Gen. Nov., Sp. Nov., a Phototrophic Purple Nonsulfur Bacterium Previously Referred to as the "Rhodocyclus Gelatinosus-Like" Group. Archives of Microbiology, 155(4): 330–336. https://doi.org/10.1007/BF00243451 |
Hutchens, E., Radajewski, S., Dumont, M. G., et al., 2004. Analysis of Methanotrophic Bacteria in Movile Cave by Stable Isotope Probing. Environmental Microbiology, 6(2): 111–120. https://doi.org/10.1046/j.1462-2920.2003.00543.x |
Jeong, S. Y., Kim, T. G., 2019. Development of a Novel Methanotrophic Process with the Helper Micro-Organism Hyphomicrobium Sp. NM3. Journal of Applied Microbiology, 126(2): 534–544. https://doi.org/10.1111/jam.14140 |
Jiang, H. C., Dong, H. L., Zhang, G. X., et al., 2006. Microbial Diversity in Water and Sediment of Lake Chaka, an Athalassohaline Lake in Northwestern China. Applied and Environmental Microbiology, 72(6): 3832–3845. https://doi.org/10.1128/AEM.02869-05 |
Könneke, M., Bernhard, A. E., de la Torre, J. R., et al., 2005. Isolation of an Autotrophic Ammonia-Oxidizing Marine Archaeon. Nature, 437(7058): 543–546. https://doi.org/10.1038/nature03911 |
Kramer, C., Gleixner, G., 2008. Soil Organic Matter in Soil Depth Profiles: Distinct Carbon Preferences of Microbial Groups during Carbon Transformation. Soil Biology and Biochemistry, 40(2): 425–433. https://doi.org/10.1016/j.soilbio.2007.09.016 |
Li, Q., Song, A., Peng, W. J., et al., 2017. Contribution of Aerobic Anoxygenic Phototrophic Bacteria to Total Organic Carbon Pool in Aquatic System of Subtropical Karst Catchments, Southwest China: Evidence from Hydrochemical and Microbiological Study. FEMS Microbiology Ecology, 93(6): fix065. https://doi.org/10.1093/femsec/fix065 |
Liu, X. H., Song, X. S., Wang, Y., et al., 2015. Effects of drought and double CO2 in atmosphere on soil microbial biomass and activities. Jiangsu Agricultural Sciences, 43(12): 336–338. https://doi.org/10.15889/j.issn.1002-1302.2015.12.106 (in Chinese with English Abstract) |
Liu, Y. C., Whitman, W. B., 2008. Metabolic, Phylogenetic, and Ecological Diversity of the Methanogenic Archaea. Annals of the New York Academy of Sciences, 1125(1): 171–189. https://doi.org/10.1196/annals.1419.019 |
Louca, S., Parfrey, L. W., Doebeli, M., 2016. Decoupling Function and Taxonomy in the Global Ocean Microbiome. Science, 353(6305): 1272–1277. https://doi.org/10.1126/science.aaf4507 |
Lü, X. F., He, Q. F., Wang, Z. J., et al., 2019. Calcium Carbonate Precipitation Mediated by Bacterial Carbonic Anhydrase in a Karst Cave: Crystal Morphology and Stable Isotopic Fractionation. Chemical Geology, 530: 119331. https://doi.org/10.1016/j.chemgeo.2019.119331 |
Luo, W. Q., 2009. Analysing Ecological Data. Journal of Applied Statistics, 36(2): 233–234. https://doi.org/10.1080/02664760802340267 |
Magoč, T., Salzberg, S. L., 2011. FLASH: Fast Length Adjustment of Short Reads to Improve Genome Assemblies. Bioinformatics, 27(21): 2957–2963. https://doi.org/10.1093/bioinformatics/btr507 |
McCann, K. S., 2000. The Diversity–Stability Debate. Nature, 405(6783): 228–233. https://doi.org/10.1038/35012234 |
McDonough, L. K., Iverach, C. P., Beckmann, S., et al., 2016. Spatial Variability of Cave-Air Carbon Dioxide and Methane Concentrations and Isotopic Compositions in a Semi-Arid Karst Environment. Environmental Earth Sciences, 75(8): 700. https://doi.org/10.1007/s12665-016-5497-5 |
Paerl, H. W., Gardner, W. S., Havens, K. E., et al., 2016. Mitigating Cyanobacterial Harmful Algal Blooms in Aquatic Ecosystems Impacted by Climate Change and Anthropogenic Nutrients. Harmful Algae, 54: 213–222. https://doi.org/10.1016/j.hal.2015.09.009 |
Palmer, A. N., 2017. Geology of Mammoth Cave. In: Hobbs, H. III, Olson, R., Winkler, E., et al., eds., Mammoth Cave: Cave and Karst Systems of the World. Springer. https://doi.org/10.1007/978-3-319-53718-4_6 |
Pearson, A., McNichol, A. P., Benitez-Nelson, B. C., et al., 2001. Origins of Lipid Biomarkers in Santa Monica Basin Surface Sediment: A Case Study Using Compound-Specific δ14C Analysis. Geochimica et Cosmochimica Acta, 65(18): 3123–3137. https://doi.org/10.1016/S0016-7037(01)00657-3 |
Pedersen, K., 2000. Exploration of Deep Intraterrestrial Microbial Life: Current Perspectives. FEMS Microbiology Letters, 185(1): 9–16. https://doi.org/10.1016/S0378-1097(00)00061-6 |
Pierce, S., Sjögersten, S., 2009. Effects of below Ground CO2 Emissions on Plant and Microbial Communities. Plant and Soil, 325(1): 197. https://doi.org/10.1007/s11104-009-9969-1 |
Rothschild, L. J., Mancinelli, R. L., 2001. Life in Extreme Environments. Nature, 409(6823): 1092–1101. https://doi.org/10.1038/35059215 |
Team, R. D. C., 2009. R: A Language and Environment for Statistical Computing. R Foundation for Statistical Computing, Vienna, Austria. Computing, 14: 12–21. https://doi.org/10.1890/0012-9658(2002)083[3097:CFHIWS]2.0.CO;2. |
Tian, C. Q., Shao, K., 2013. Determination of Total Phosphorus in Soils and Stream Sediments by Microwave Digestion-Phosphorus Molybdenum Blue Spectrophotometry. Metallurgical Analysis, 33(12): 52–56. https://doi.org/10.13228/j.issn.1000-7571.2013.12.010 (in Chinese with English Abstract) |
Vanfossen, A. L., Verhaart, M. R. A., Kengen, S. M. W., et al., 2009. Carbohydrate Utilization Patterns for the Extremely Thermophilic Bacterium Caldicellulosiruptor Saccharolyticus Reveal Broad Growth Substrate Preferences. Applied and Environmental Microbiology, 75(24): 7718–7724. https://doi.org/10.1128/AEM.01959-09 |
Wang, F. X., Cao, J. H., Huang, J. F., 1998. Biokarst in Cave Twilight Zones. Carsologica Sinica, 17(1): 41–48.https://doi.org/CNKI:SUN:ZGYR.0.1998-01-005 (in Chinese with English Abstract) |
Wang, J. F., Wang, Y. H., Song, X. S., et al., 2017. Elevated Atmospheric CO2 and Drought Affect Soil Microbial Community and Functional Diversity Associated with Glycine Max. Revista Brasileira De Ciência Do Solo, 41: e0160460. https://doi.org/10.1590/18069657rbcs20160460 |
Willis, K. J., MacDonald, G. M., 2011. Long-Term Ecological Records and Their Relevance to Climate Change Predictions for a Warmer World. Annual Review of Ecology, Evolution, and Systematics, 42(1): 267–287. https://doi.org/10.1146/annurev-ecolsys-102209-144704 |
Wong, C. I., Breecker, D. O., 2015. Advancements in the Use of Speleothems as Climate Archives. Quaternary Science Reviews, 127: 1–18. https://doi.org/10.1016/j.quascirev.2015.07.019 |
Wuchter, C., Schouten, S., Boschker, H. T. S., et al., 2003. Bicarbonate Uptake by Marine Crenarchaeota. FEMS Microbiology Letters, 219(2): 203–207. https://doi.org/10.1016/S0378-1097(03)00060-0 |
Xie, S. C., Wang, F. P., Yan, J. X., et al., 2016. Geobiological Processes during Critical Environmental Transitions in Earth History. Science & Technology Information, 14(21): 176–177. https://doi.org/10.3969/j.issn.1672-3791.2016.21.107 (in Chinese with English Abstract) |
Yang, S. H., Zheng, Q. S., Yuan, M. T., et al., 2019. Long-Term Elevated CO2 Shifts Composition of Soil Microbial Communities in a Californian Annual Grassland, Reducing Growth and N Utilization Potentials. Science of the Total Environment, 652: 1474–1481. https://doi.org/10.1016/j.scitotenv.2018.10.353 |
Yun, Y., Cheng, X. Y., Wang, W. Q., et al., 2018. Seasonal Variation of Bacterial Community and Their Functional Diversity in Drip Water from a Karst Cave. Chinese Science Bulletin, 63(36): 3932–3944, 3932. https://doi.org/10.1360/N972018-00627 (in Chinese with English Abstract) |
Zhang, J., Gu, T., Zhou, Y., et al., 2012. Terrimonas Rubra Sp. Nov., Isolated from a Polluted Farmland Soil and Emended Description of the Genus Terrimonas. International Journal of Systematic and Evolutionary Microbiology, 62(Pt_11): 2593–2597. https://doi.org/10.1099/ijs.0.036079-0 |
Zhang, L. M., He, J. Z., 2012. A Novel Archaeal Phylum: Thaumarchaeota—A Review. Acta Microbiologica Sinica, 52(4): 411–421. https://doi. org/http://ir.rcees.ac.cn/handle/311016/8332. |
Zhang, Z. H., Li, X. N., Peng T., et al., 2004. New Records of Luminous Liverworts from the Karst Caves of Guangxi Province, P. R. China: Cyathodium Cavernarum Kunze and C. Smaragdium Schiffin ex Keissler (Cyathodiaceae, Hepaticae). Carsologica Sinica, 23(2): 154–157. https://doi.org/10.3969/j.issn.1001-4810.2004.02.011 (in Chinese with English Abstract) |
Zhao, H. B., Xu, B. Q., Yao, T. D., et al., 2012. Deuterium Excess Record in a Southern Tibetan Ice Core and Its Potential Climatic Implications. Climate Dynamics, 38(9): 1791–1803. https://doi.org/10.1007/s00382-011-1161-7 |
Zhao, J., Lu, W., Zhang, F. J., et al., 2014. Evaluation of CO2 Solubility-Trapping and Mineral-Trapping in Microbial-Mediated CO2-Brine-Sandstone Interaction. Marine Pollution Bulletin, 85(1): 78–85. https://doi.org/10.1016/j.marpolbul.2014.06.019 |
1. | Wei Xu, Lei Liao, Dongliang Liao, et al. Distribution of Carbon-Sequestering Microbes in Different Habitats and the Interaction with Habitat Factors in a Natural Karst Cave. Sustainability, 2024, 16(17): 7357. doi:10.3390/su16177357 | |
2. | Qinzhu Tian, Ling Feng, Chen Wu, et al. Iron coupled with hydroxylamine turns on the “switch” for free radical degradation of organic pollutants under high pH conditions. Journal of Colloid and Interface Science, 2024, 669: 1006. doi:10.1016/j.jcis.2024.05.021 | |
3. | Xue Zhu, Lei Meng, Chen Jiang, et al. The Mechanism of a Multifunctional Strain of Streptomyces sp. on the Growth of Pinus massoniana Seedlings. Journal of Soil Science and Plant Nutrition, 2024. doi:10.1007/s42729-024-02102-3 | |
4. | Qianqian Yu, Junwei Wen, Sili Zhang, et al. The coupling of sulfide and Fe-Mn mineral promotes the migration of lead and zinc in the redox cycle of high pH floodplain soils. Journal of Hazardous Materials, 2024, 472: 134546. doi:10.1016/j.jhazmat.2024.134546 |
Sample ID | Observed_OTUs | Shannon | Simpson | Equitability |
SMCIWater | 470 | 3.191 | 0.861 | 0.519 |
SMCOWater | 450 | 3.599 | 0.920 | 0.589 |
XYCIWater | 570 | 3.648 | 0.914 | 0.575 |
XYCOWater | 602 | 3.769 | 0.869 | 0.589 |
SMCSediment | 787 | 5.445 | 0.989 | 0.817 |
XYCSediment | 976 | 5.443 | 0.980 | 0.791 |
SMCWall | 787 | 5.378 | 0.978 | 0.806 |
XYCWall | 721 | 5.144 | 0.975 | 0.782 |
ID of Isolates | Isolation source | The closest reference strains (GenBank Accession no.) | Identity |
SMC_S_097 | More abundant in SMC and less abundant in XYC | Acinetobacter junii (MK053916) | 100% |
SMC_S_234 | More abundant in SMC and less abundant in XYC | Pseudomonas sp. (HE614849) | 99% |
SMC_W_131 | Present in the sediment (SMC and XYC) and rock wall (SMC) | Lysobacter sp. (JX415443) | 99% |
SMC_S_312 | Present in the sediment (SMC and XYC) | Gordonia sp. (MH101280) | 100% |
XYC_W_90 | Present in the rock wall (SMC and XYC) | Bacillus amyloliquefaciens (MK336717) | 100% |