Processing math: 100%
Advanced Search

Indexed by SCI、CA、РЖ、PA、CSA、ZR、etc .

Shahpara Sheikh Dola, Junmeng Zhao, Heng Zhang, Shunping Pei. Upper-Mantle Velocity Heterogeneity of Eastern Tibetan Plateau from Teleseismic P-Wave Tomography and Its Tectonic Implications. Journal of Earth Science, 2023, 34(1): 280-290. doi: 10.1007/s12583-021-1478-z
Citation: Shahpara Sheikh Dola, Junmeng Zhao, Heng Zhang, Shunping Pei. Upper-Mantle Velocity Heterogeneity of Eastern Tibetan Plateau from Teleseismic P-Wave Tomography and Its Tectonic Implications. Journal of Earth Science, 2023, 34(1): 280-290. doi: 10.1007/s12583-021-1478-z

Upper-Mantle Velocity Heterogeneity of Eastern Tibetan Plateau from Teleseismic P-Wave Tomography and Its Tectonic Implications

doi: 10.1007/s12583-021-1478-z
More Information
  • Corresponding author: Junmeng Zhao, zhaojm@itpcas.ac.cn
  • Received Date: 10 Sep 2020
  • Accepted Date: 10 May 2021
  • Available Online: 02 Feb 2023
  • Issue Publish Date: 28 Feb 2023
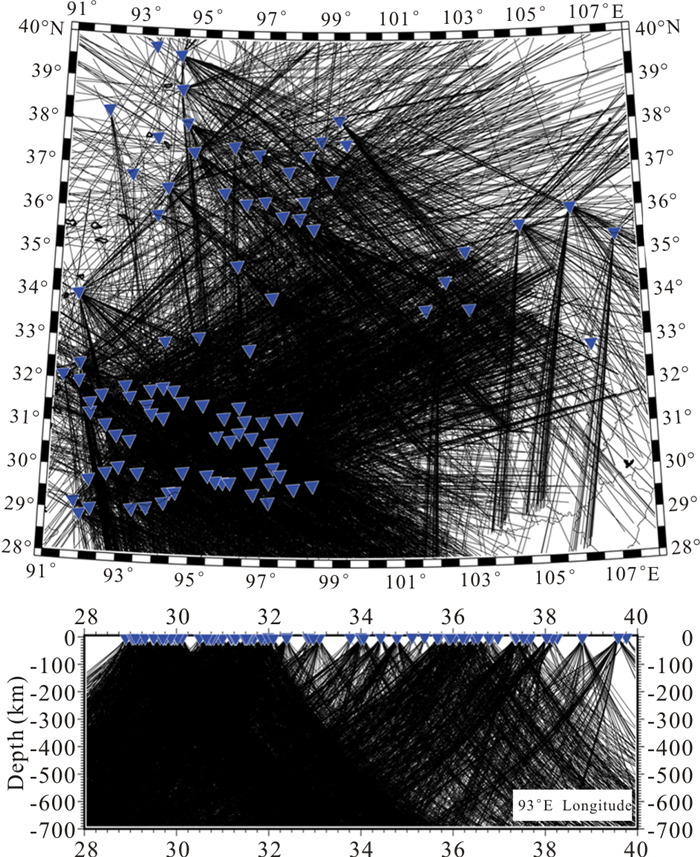
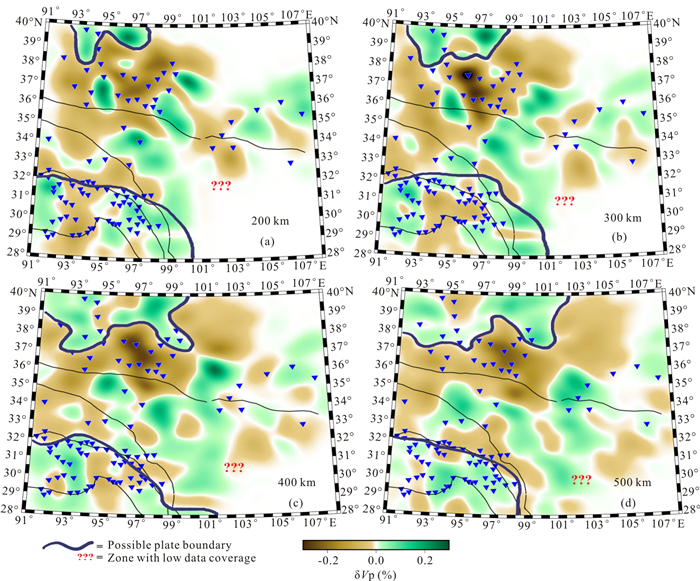
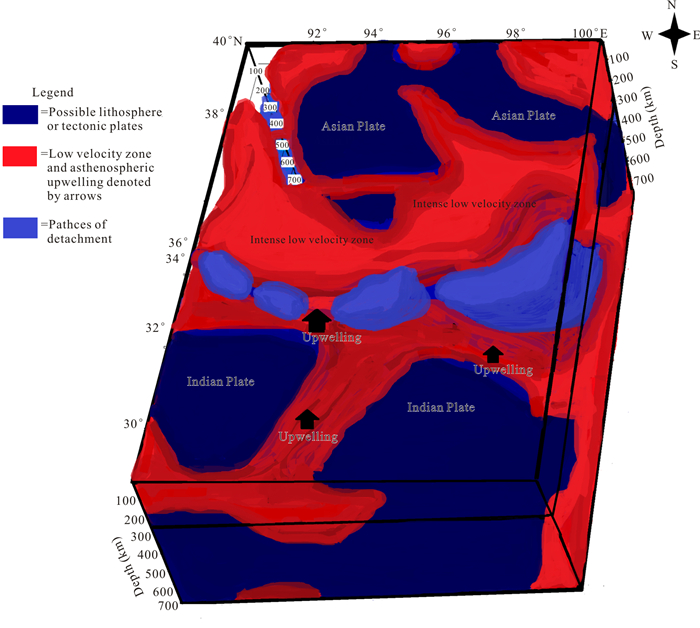
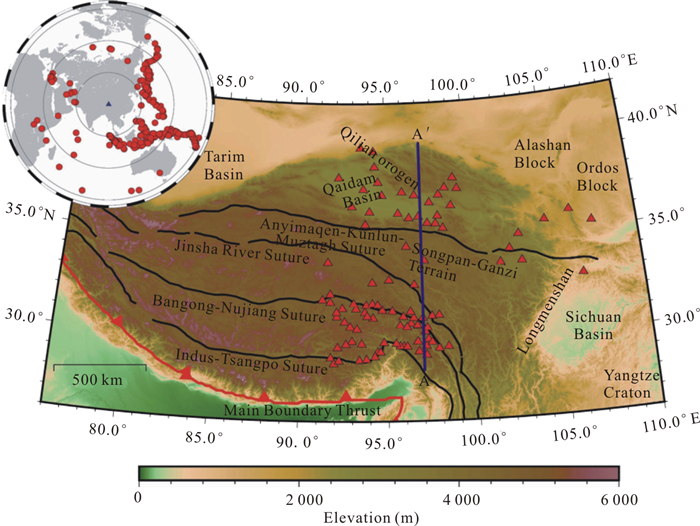
  • An attempt has been made to reveal the upper mantle velocity structure of the eastern Tibetan Plateau using 628 teleseismic events recorded from 2003 to 2009 at 95 stations. A total of 8 532 P-wave arrival time residuals were inverted by using the FMTOMO (fast marching tomography) software package. Tomographic results show upper mantle velocity heterogeneity in many aspects. In the southern part visible high velocity anomaly is denoted as the Indian lithosphere. This part seems to be affected by slab tearing at 94°E longitude as it is located on the eastern Himalayan syntaxis (EHS). The high velocity zone down to 500 km depth in the northern part could be the Asian lithosphere. At the central part some high velocity anomalies can be identified as detached patches of the lithosphere, surrounded by low velocity anomalies. These anomalies are the potential to create thermal convection and trigger plateau uplift or plateau growth. Sudden velocity change occurs on both sides of patches where low velocity anomaly is visible in between patches and Bangong-Nujiang suture even in between Songpan-Ganzi terrain and Asian Plate. In both cases intense low velocity zone spread down to 500 km. The depth range of low velocity anomalies in between two plates observed from 200 to ~500 km. Hence the low velocity anomalies detected in our results may reflect either the hot asthenosphere upwelling or the mantle wedge due to the presence of the cold lithosphere.


  • The Tibetan Plateau, known as the roof of the Earth and the highest plateau or 'third pole' is not only a plateau with high elevation, but is also famous for its complex history and evolutionary theories. It is supposed to be formed more or less 50 million years ago (Yin and Harrison, 2000; Molnar and Tapponnier, 1975). Some famous statements about Tibetan Plateau state that the plateau was caused by the northward subduction of the Indian Plate lithosphere beneath the southern Tibetan Plateau (Replumaz et al., 2013; Zhao et al., 2011; Li et al., 2008; Tilmann et al., 2003) and southward subduction of Eurasian Plate lithosphere beneath northern Tibetan Plateau (Zhao et al., 2011; Kind et al., 2002; Willett and Beaumont, 1994). Also, the continental subduction of both plates contributes greatly to the plateau growth in the southern and northern Tibetan Plateau (Replumaz et al., 2013). Although good number of studies have been done and going on in this area, still many unrevealed facts and questions arise about this plateau. This means undoubtedly it is essential to keep continuing research around this region for a better understanding. There are many geodynamic models based on the evolution and structure of the Tibetan Plateau. Most of the models have tried to explain the reason for high topography but the mantle structure of the eastern Tibetan Plateau and its effects on topography is not revealed clearly (Lei et al., 2019). Maximum large earthquake epicenters of the eastern Tibetan Plateau are located at boundaries of the plateau which consists of heterogeneous low and high velocity anomalies (Lei and Zhao, 2016a). More and more precise research is needed to clear up the idea about upper mantle dynamics. Many studies have been done along the eastern margin of Tibetan Plateau to reveal the crust and upper mantle structure although differences among tomographic maps can be seen, which means all results are not giving same interpretations (Zheng et al., 2019; Guo and Chen, 2017; Bao et al., 2015).

    A large number of studies have been carried out in the eastern Tibetan Plateau, but only a few studies focus on the lateral variations of underground structures or the velocity variation beneath the eastern Tibetan Plateau. To keep consistency with the tradition of finding unknown facts we attempt to focus on some unclear facts to bring them to light. For that reason, an attempt has been made to visualize the upper mantle heterogeneity of the eastern Tibetan Plateau.

    In the last few decades many research works have been done to reveal the detailed tectonics of the Tibetan Plateau using seismic tomography, magneto telluric study, shear wave splitting analysis, receiver function, GPS etc. (Zhang H et al., 2021, 2018, 2017, 2012; Lei et al., 2019, 2014; Pei et al., 2019; Xu et al., 2019; Zhang F X et al., 2018; Ye et al., 2017; Zhang X Y et al., 2017; Peng et al., 2016; Lei and Zhao, 2016a, b, 2009; Li M K et al., 2016; Zhao J et al., 2014; Hu et al., 2013, 2011; Wei W et al., 2013; Sun et al., 2011; Bai et al., 2010; Zhang Z J et al., 2010; Gan et al., 2007; Li C et al., 2008; Royden et al., 2008; Lev et al., 2006; Zhang P Z et al., 2004; Wei W B et al., 2001).

    The eastern part of the Tibetan Plateau belongs to Phanerozoic orogeny (Zheng et al., 2013; Xiao et al., 2010; Windley et al., 2007; Jahn et al., 2000; Şengör et al., 1993). Consequently, eastern Tibetan Plateau started lifting with time and reached its present-day elevation (more or less 3 000 m) by the Late Miocene or 11 Ma (Xu et al., 2016). Eastern Tibetan Plateau is topographically higher than the gently dipping south-eastern Tibetan Plateau thus their margin is mantled by the elevated low-relief relict landscape which was formed before the uplift of the eastern Tibetan Plateau (Clark et al., 2005). Previous observation and geodetic study shows that since the last 4 million years there has been a little crustal shortening along the eastern margin of the Tibetan Plateau (Royden et al., 1997). Also some results suggest that the uplift of the eastern Tibetan Plateau during the Late Cenozoic might have been produced by eastward over-thrusting and crustal shortening (Liu et al., 2017). The horizontal shortening and vertical stretching, in short 'weak lithosphere deformation' caused the plateau growth in the eastern Tibetan Plateau (Zhang F X et al., 2018). The topography, crustal thickness and sutures are assumed to be formed during the continental-continental collision of the Indian Plate and Asian Plate (Royden et al., 2008; Tapponnier et al., 2001; Yin and Harrison, 2000). Analysis from velocity variation and anisotropy reveals that the Tibetan Plateau might have extruded and its mantle materials might have flowed around the East Himalayan syntaxis (Pei et al., 2007). Another research shows lithosphere mantle thinning under the eastern Tibetan Plateau where the depth of the lithosphere-asthenosphere boundary is 140 km (Tunini et al., 2016). Recent ambient-noise tomographic result (Bao et al., 2020) suggests that, the eastern Tibetan plateau may be uplifted mainly by crustal shortening with later disordered crustal flow modulating the landscape. The topography of the eastern Tibetan Plateau is visibly different from northern and southern boundaries of the Tibetan Plateau thus eastern Tibetan Plateau has two long continuous slopes without distinct topographic boundaries (Burchfiel, 2004). Research reveals that, eastern Tibetan Plateau growth is induced by the push-squeeze mechanism based on a lithospheric scale (Zhang F X et al., 2018). The eastern margin of the Tibetan Plateau is surrounded by the Qaidam Basin and Qilian Orogen in the north, Alashan Block and Ordos Block in the northeast, Sichuan Basin and Yangtze Craton in the east. Few distinct sutures called the Jinsha River suture, Bangong-Nujiang suture and Indus-Tsangpo suture, Anyimaqen-Kunlun-Muztagh suture can be found across the eastern Tibetan Plateau (Fig. 1).

    Figure  1.  Basic tectonic settings of the Tibetan Plateau with the station location indicated by red triangles. Sutures and thrust faults are created by using an open database available from previous research work (Styron et al., 2010; Taylor and Yin, 2009). The upper left map is an Azimuthal equidistant map showing 628 teleseismic events denoted by red circles, where the blue triangle indicates the study area. The epicentral distance between events ranges from 30° to 90°.

    From the results of shear wave splitting measurements, it is evident that the northeastern part of the Tibetan Plateau is an undoubtedly complex region to portray all splitting measurements in a unique geodynamic model (Li et al., 2011). Also, seismic anisotropy results indicate that in Tibetan Plateau, mountain building processes caused significant deformation of the lithosphere beneath Tibetan Plateau but the asthenosphere seems to be less affected by the mountain building process (Huang et al., 2011). Many results show the diversity of this area. That is why a more detailed study can reveal unsorted and undefined facts.

    Seismic data, as well as travel time data from the Namche Barwa Broadband Seismic Network (Meltzer, 2003) and ASCENT project, has been adopted in this study. Most of the data has been downloaded from IRIS (Incorporated Research Institutions for Seismology) and sorted according to the research area. Although datasets from these projects have been used in several studies (Yang et al., 2012; Zhang H et al., 2012, 2011; Fu et al., 2010; Singh and Kumar, 2009; Li et al., 2008; Sol et al., 2007) but a different approach with fast marching tomography method has been applied with the combined datasets, to find out the upper mantle heterogeneity. By using a MATLAB software package (Yu et al., 2017) with a waveform cross-correlation technique, at least 6 P-wave arrivals for each event were manually picked. As this research is based on teleseismic analysis, 628 distant earthquake data which has a magnitude of more than Mw 5.5 was considered (Fig. 1). These earthquakes have been recorded from 2003 to 2009 at 95 seismic stations. In total 8 532 P-wave arrivals were inverted for the upper mantle structure. The ray coverage in the study area is considerable (Fig. 2).

    Figure  2.  A depth slice (at 400 km) and a vertical slice (93°E longitude) along with the ray coverage detected by stations.

    For 3-D travel-time tomography, FMTOMO (fast marching tomography), a FORTRAN-90 software has been used (Rawlinson and Urvoy, 2006; Rawlinson and Sambridge, 2004a, b). FMTOMO software package is based on the fast marching method (Sethian and Popovici, 2012; Sethian, 1996). FMTOMO is based on a fast-marching method (FMM) for the forward step of travel-time prediction and also has a subspace inversion scheme to adjust model parameters for satisfying data observations. The eikonal equation of fast marching, which represents the propagation of seismic waves in the high frequency looks like this

    |ΔxT|=s(x)

    Here, Δx is the gradient operator, T is travel time and s(x) is the slowness function of position x (Rawlinson et al., 2006). In short, the purpose of FMTOMO software is to let any velocity or interface structure be inverted by using most classes of travel time datasets (especially teleseismic which is used in this research work) (Rawlinson and Kennett, 2008). For the inversion step the iterative non-linear approach is the following equation (Kennett et al., 1988).

    S(m)=(g(m)dobs)TCd1(g(m)dobs)+ε(mm0)TCm1(mm0)+ηmTDTDm

    where m = model parameter, m0 = starting model or reference model parameter g(m) = predicted residuals, dobs = observed residuals, Cd = priori data covariance matrix, Cm = priori model covariance matrix, D = second derivative smoothing operator, ε = damping parameter, η = smoothing parameter.

    These last two parameters ε, η controls the level of imposed regularization and also control the trade-off between the best way that satisfies data (Rawlinson and Kennett, 2008).

    This multi-stage FMM (fast marching method) was given an extension form by introducing 3-D coordinates that included huge flexibility by allowing teleseismic phases to it (de Kool et al., 2006). This method is accomplished by computing travel time from distant source through a global reference model to the boundary nodes of a given or predefined model volume (Rawlinson and Kennett, 2008), in this case the global reference model is, ak135 (Kennett et al., 1995) which has been used in our research as well. More detailed information is available in these published papers (Rawlinson and Urvoy, 2006; Rawlinson and Sambridge, 2004a, b). For the reference model, the 1D reference or starting model ak135 (Kennett et al., 1995) has been used (Fig. 3).

    Figure  3.  The starting or reference 1-D model ak135 (Kennett et al., 1995).

    Synthetic resolution tests can evaluate the constraints of the dataset on the model parameters to justify the robustness of datasets. This means resolution tests give us a chance to find out where we have good data coverage and where we do not. Based on adequate ray-path coverage and arrival time uncertainty (Rawlinson and Kennett, 2008) we have conducted several resolution tests. The checkerboard test has been used in this research where the starting or initial model's checkerboard pattern is a combination of alternating fast and slow anomalies in the 3-D model (Rawlinson and Kennett, 2008; Rawlinson and Sambridge, 2003). Synthetic resolution tests showed good resolution in most places around the station location. Also, in some places where fewer stations are available but the good resolution is achieved due to the ray path coverage around those stations. The tomographic inversion scheme beneath the 95-station array is represented with a model volume comprising 46 464 velocity nodes with 33 km spacing in depth, 17.21 km in both latitude and longitude. Also, this model spans 700 km in depth, 12° in latitude and 17° in longitude. Before establishing tomographic results as well as a solution model, synthetic checkerboard tests (Rawlinson and Sambridge, 2003) have been done to find out the robustness of the model. The synthetic test was done using the identical sources, receivers and phase types the same as the observational dataset to determine the arrival-time residuals. These residual values are synthetic. After getting these values, they were inverted with the same procedure of solution model inversion (Fig. 4).

    Figure  4.  Input model image and recovered model image in checkerboard resolution test.

    Six iterations of the tomographic inversion scheme had been applied to the 8 532 relative arrival-time residuals to produce a solution model that satisfies the data to an acceptable level. The subspace dimension value was set at 20 for inversion where SVD (singular value decomposition) was used. The solution model has reduced data variance from 0.655 55 to 0.354 74 s2, which represents a 46% variance reduction. This corresponds to an RMS reduction from an initial value of 809.61 ms to a final value of 595.57 ms. After running a big number of tests, the damping and smoothing parameters were selected by considering data variance. For the final solution model damping, ε = 5 and smoothing, η = 150 were imposed during inversion. Several depth slices have been created at 200, 300, 400 and 500 km (Fig. 5) from the tomographic solution of the eastern Tibetan Plateau.

    Figure  5.  The tomographic solution model at 200 km (a), 300 km (b), 400 km (c) and 500 km (d) depth. In addition, because we use relative travel time residuals for the inversion, we usually adopt velocity variations in percentage (%) because we cannot derive absolute velocity variation.

    Figure 5 shows depth slices at 200, 300, 400 and 500 km depth respectively where high velocity anomalies can be seen on the southern and northern parts of the eastern Tibetan Plateau. In our results down to 200 km low velocity zone can be seen longitudinally from 92°E to 100°E and the corresponding latitude from 28°N to 38°N but at 30°N to 32°N, it seems to be disconnected by the high velocity zone. In between 30°N to 32°N and at 94°E longitude low velocity anomalies were observed significantly. At 300 km depth, the distribution of low velocity anomaly seems more dispersed. But an intense low velocity zone is observed under Songpan-Ganzi terrain in all depth slices. At 200, 300, and 400 km depth under the Bangong-Nujiang suture, low velocity anomalies can be seen to be disconnected at 30°N to 32°N by high velocity anomalies. This high velocity anomaly is supposed to be the Indian lithosphere (Replumaz et al., 2013; Zhao et al., 2011; Li et al., 2008; Tilmann et al., 2003). Also a very high velocity anomaly can be seen at 200, 300, and 400 km depth slices spread from 37°N to 40°N, which is beneath Qilian Orogen indicating possible Asian lithosphere (Zhao et al., 2011; Willett and Beaumont, 1994).

    There have been a good number of studies conducted in the eastern Tibetan Plateau. For example, the upper mantle S velocity model created from Rayleigh wave tomography also shows two subducting continental plates facing opposite to each other indicating that the Indian Plate is subducting under the southern Tibetan Plateau and the Asian Plate is subducting under the northern Tibetan Plateau (Li Y H et al., 2013). P-wave speed is observed low beneath the central and eastern Tibetan Plateau (Li et al., 2008). GPS measurements also suggest that mantle flow promotes block extrusion under Tibetan Plateau although hot asthenospheric upwelling under Tibetan Plateau can lead to post-collisional magmatism under the southern Tibetan Plateau widely (Zou et al., 2019). Another study suggests that low velocity anomalies of the upper mantle under the Songpan-Ganzi terrain portray hot and wet mantle upwelling which possibly occurred and was induced via the Moho interface to add fluids to the crustal flow of the eastern Tibetan Plateau (Lei et al., 2019). Also it is suggested that the upwelling counter flow might be the reason for the low velocity zone beneath the Songpan-Ganzi terrain (Yue et al., 2012). The Indian lithospheric mantle is underthrusting sub-horizontally beneath the eastern Tibetan Plateau also on the northern side Asian lithospheric mantle is detected close to Qaidam Basin (Zhang et al., 2012; Nábělek et al., 2009; Tilmann et al., 2003; Kind et al., 2002). This Asian lithospheric mantle is also clearly visible in our results. From a recent study by (Zheng et al., 2019) it is assumed that seismic velocities of the uppermost mantle are slow in the northeastern Songpan-Ganzi terrain in comparison to the south although the outward expansion of the Tibetan Plateau might have evolved by a combination of crustal flow along with the southeastern margin. Zheng et al. (2019) also suggested that mantle upwelling could be triggered by the removal of the thickened lithosphere in its eastern marginal places.

    Velocity heterogeneity of the eastern Tibetan Plateau can be portrayed by observing our tomographic results. Beneath the Bangong-Nujiang suture, where the Indian Plate is subducting, a sudden change in velocity can be observed (Fig. 6). Another sudden change in velocity can be seen under Qaidam Basin and Qilian Orogen, where possible Asian lithosphere is present. Also, between 33°N to 35°N low velocity zone seems to be disconnected by a relatively high velocity zone. This portion could be a part of subducting lithosphere or some detached block of pre-existed lithosphere probably causing large scale thermal convection, which might be a reason for plateau growth and uplift. A recent study shows strong evidence of the convective removal of the lithosphere (what we called detached patches in our results) beneath the Bangong-Nujiang suture in the central Tibetan Plateau (Xiao et al., 2020). In between the subducting Indian Plate and Asian Plate, low velocity anomalies can be seen from 200 to 500 km mostly (in some places more than 500 km) (Fig. 5 and Fig. 6). From results of other parts of the eastern Tibetan Plateau it is assumed that the low velocity zone ranges from 200 to 400 km on average (Fig. 6). Although in some places this depth increases down to 660 km (Fig. 6). This low velocity zone ranging from 200 to 400 km is interpreted as a possible mantle wedge in a prominent recent study (Xiao et al., 2020; Lei et al., 2019). In our results we interpret this zone as hot asthenosphere disconnected by subducted continental lithosphere.

    Figure  6.  Vertical slice along 97°E or AA' (profile location has been drawn in Fig. 1).

    The main objective of this research work contains the determination of velocity variation of the upper mantle along the eastern part of the Tibetan Plateau. From these observations, the abrupt change in the low velocity zone can be seen in the middle of our study area (beneath the Bangong-Nujiang suture and Songpan-Ganzi terrain in the eastern part of the Tibetan Plateau) ranging from 200 to ~500 km depth. Following previous studies, the large-scale high velocity anomaly in the southern part and northern part of our image is explained as the subducting Indian Plate and Asian Plate accordingly. The subducted Indian Plate is visible with low velocity anomalies at longitude 94°E may be caused by slab tearing because it is located at EHS (eastern Himalayan syntaxis) (Peng et al., 2016; Li Z H et al., 2013).

    Another feature is the mantle upwelling in and around the eastern Tibetan Plateau, which is sandwiched by two continental lithospheres (Indian lithosphere and Asian lithosphere). In between these two continental lithospheres, some high velocity anomalies of detached patches (remains of a plate that is supposed to be pre-existed or possibly detached from subducting plates) are visible which might be causing thermal convection and plateau uplift. Down to 500 km low velocity zones can also be observed with some lithospheric fragmentation. Hence the low velocity anomalies, which are detected in our results, may reflect the relatively hot asthenosphere. Moreover, either the asthenosphere upwelling or the mantle wedge can occur here due to the presence of the cold lithospheric mantle in the surrounding areas as we mentioned above.

    From 92°E to 100°E good resolution has been achieved. To visualize the tomographic results in a 3-D way, a conceptual model has been established to portray our results distinctly. In consideration of depth slices and vertical slices (both along latitude and longitude) a 3-D model has been built (Fig. 7). In our model dark blue or navy-blue colored features are considered as two prominent continental lithospheres such as the Indian and Asian plates. The blue colored feature is considered as patches of the detachment of a plate that is supposed to be pre-existed or possibly detached from subducting plates, and the red colored features are low velocity anomalies. Possible mantle upwelling is indicated by black arrows. For the most part, a low velocity zone means weak material there, so it is easy to uplift under the strong pushing by the Indian Plate and form a plateau with a large range. Our results suggest the low velocity zone in the central Tibetan Plateau plays an important role to form a large and high plateau.

    Figure  7.  Conceptual model created by considering tomographic results.

    Teleseismic events recorded on various seismometers deployed by different projects and organizations have been used to visualize the 3-D P-wave velocity structure of the upper mantle of the eastern Tibetan Plateau. To reveal the image of the upper mantle structure of the eastern Tibetan Plateau, travel time residuals have been used for tomography by following the eikonal solution of the fast-marching method. Teleseismic data consists of 628 events from the period of 2003–2009 were focused mostly. From the tomographic results some points are summarized.

    (1) A high velocity anomaly in the southern part indicates subducting Indian Plate or lithosphere, which shows low velocity at 94°E longitude, which might be caused by slab tearing as it is located on the eastern Himalayan syntaxis (EHS).

    (2) High velocity anomaly in the northern part represents Asian Plate or lithosphere. This anomaly is observed down to 500 km depth at 37°N to 40°N beneath Qaidam Basin and Qilian Orogen. In between the subducting Indian Plate and Asian Plate, low velocity anomalies can be seen from a depth of 200 to 500 km mostly (in some places more than 500 km).

    (3) At the central part of the study area high velocity detached patches surrounded by low velocity anomalies trigger the possibility of thermal convection and plateau uplift. This scenario is observed down to 500 km. The abrupt change in velocity can be seen between these patches and the Bangong-Nujiang suture. This indicates a possible asthenospheric upwelling. Also, another abrupt change in velocity is observed between detached patches and Songpan-Ganzi terrain on the eastern part of the Tibetan Plateau. This might represent the existence of a mantle wedge. In both cases these low velocity anomalies range from a depth of 200 to ~500 km.

    We conclude that the low velocity zone in the central Tibetan Plateau play an important role to form large and high plateau and also the low velocity anomalies detected in our results may reflect either the hot asthenosphere upwelling or the mantle wedge due to the presence of the cold lithosphere.

    ACKNOWLEDGMENTS: This work was supported by the National Natural Science Foundation of China (No. 41974109), the Equipment Development Project of CAS (No. YJKYYQ20190075), grants of the Wong K. C. Education Foundation (No. GJTD-201904) and CAS 'The Belt and Road' Master Fellowship Program. We are thankful to Professor Nicholas Rawlinson for providing his codes of fast marching tomography. Most of the figures in this article were produced by using Generic Mapping Tools (Wessel et al., 2013). We thank the organizers of the Namche Barwa Broadband Seismic Network and ASCENT project for sharing the seismic data and the original data used in this study can be obtained from the IRIS data services (http://ds.iris.edu/ds) or the IRIS Data Management Center. The facilities of IRIS Data Services, and specifically the IRIS Data Management Center, were used for access to waveforms, related metadata, and/or derived products used in this study. IRIS Data Services are funded through the Seismological Facilities for the Advancement of Geoscience (SAGE) Award of the National Science Foundation under Cooperative Support Agreement EAR-1851048. Finally, we express our special thanks to the editors of Journal of Earth Science and anonymous reviewers for their valuable comments and reviews, which have improved this research work. The final publication is available at Springer via https://doi.org/10.1007/s12583-021-1478-z.
  • Bai, D. H., Unsworth, M. J., Meju, M. A., et al., 2010. Crustal Deformation of the Eastern Tibetan Plateau Revealed by Magnetotelluric Imaging. Nature Geoscience, 3(5): 358–362. https://doi.org/10.1038/ngeo830
    Bao, X. W., Song, X. D., Eaton, D. W., et al., 2020. Episodic Lithospheric Deformation in Eastern Tibet Inferred from Seismic Anisotropy. Geophysical Research Letters, 47(3): e2019GL085721. . https://doi.org/10.1029/2019GL085721
    Bao, X. W., Song, X. D., Li, J. T., 2015. High-Resolution Lithospheric Structure beneath Mainland China from Ambient Noise and Earthquake Surface-Wave Tomography. Earth and Planetary Science Letters, 417: 132–141. https://doi.org/10.1016/j.epsl.2015.02.024
    Burchfiel, B. C., 2004. New Technology; New Geological Challenges. GSA Today, 14(2): 4–9. https://doi.org/10.1130/1052-5173(2004)0144:panngc>2.0.co;2 doi: 10.1130/1052-5173(2004)0144:panngc>2.0.co;2
    Clark, M. K., House, M. A., Royden, L. H., et al., 2005. Late Cenozoic Uplift of Southeastern Tibet. Geology, 33(6): 525–528. https://doi.org/10.1130/G21265.1
    Fu, Y. V., Li, A. B., Chen, Y. J., 2010. Crustal and Upper Mantle Structure of Southeast Tibet from Rayleigh Wave Tomography. Journal of Geophysical Research: Solid Earth, 115(B12): B12323. https://doi.org/10.1029/2009JB007160
    Gan, W., Zhang, P. Z., Shen, Z. K., et al., 2007. Present‐Day Crustal Motion within the Tibetan Plateau Inferred from GPS Measurements. Journal of Geophysical Research: Solid Earth, 112(B8): B08416. https://doi.org/10.1029/2005JB004120
    Guo, Z., Chen, Y. J., 2017. Mountain Building at Northeastern Boundary of Tibetan Plateau and Craton Reworking at Ordos Block from Joint Inversion of Ambient Noise Tomography and Receiver Functions. Earth and Planetary Science Letters, 463: 232–242. https://doi.org/10.1016/j.epsl.2017.01.026
    Hu, J. F., Xu, X. Q., Yang, H. Y., et al., 2011. S Receiver Function Analysis of the Crustal and Lithospheric Structures beneath Eastern Tibet. Earth and Planetary Science Letters, 306(1/2): 77–85. https://doi.org/10.1016/j.epsl.2011.03.034
    Hu, J. F., Yang, H. Y., Li, G. Q., et al., 2013. Seismic Signature of the Mantle Transition Zone beneath Eastern Tibet and Sichuan Basin. Journal of Asian Earth Sciences, 62: 606–615. https://doi.org/10.1016/j.jseaes.2012.11.009
    Huang, Z. C., Wang, L. S., Zhao, D. P., et al., 2011. Seismic Anisotropy and Mantle Dynamics beneath China. Earth and Planetary Science Letters, 306(1/2): 105–117. https://doi.org/10.1016/j.epsl.2011.03.038
    Jahn, B. M., Wu, F. Y., Chen, B., 2000. Granitoids of the Central Asian Orogenic Belt and Continental Growth in the Phanerozoic. Transactions of the Royal Society of Edinburgh: Earth Sciences, 91(1/2): 181–193. https://doi.org/10.1017/s0263593300007367
    Kennett, B. L. N., Engdahl, E. R., Buland, R., 1995. Constraints on Seismic Velocities in the Earth from Traveltimes. Geophysical Journal International, 122(1): 108–124. https://doi.org/10.1111/j.1365-246X.1995.tb03540.x
    Kennett, B. L. N., Sambridge, M. S., Williamson, P. R., 1988. Subspace Methods for Large Inverse Problems with Multiple Parameter Classes. Geophysical Journal International, 94(2): 237–247. https://doi.org/10.1111/j.1365-246X.1988.tb05898.x
    Kind, R., Yuan, X., Saul, J., et al., 2002. Seismic Images of Crust and Upper Mantle beneath Tibet: Evidence for Eurasian Plate Subduction. Science, 298(5596): 1219–1221. https://doi.org/10.1126/science.1078115
    de Kool, M., Rawlinson, N., Sambridge, M., 2006. A Practical Grid-Based Method for Tracking Multiple Refraction and Reflection Phases in Three-Dimensional Heterogeneous Media. Geophysical Journal International, 167(1): 253–270. https://doi.org/10.1111/j.1365-246X.2006.03078.x
    Lei, J. S., Li, Y., Xie, F. R., et al., 2014. Pn Anisotropic Tomography and Dynamics under Eastern Tibetan Plateau. Journal of Geophysical Research: Solid Earth, 119(3): 2174–2198. https://doi.org/10.1002/2013jb010847 doi: 10.1002/2013JB010847
    Lei, J. S., Zhao, D. P., 2009. Structural Heterogeneity of the Longmenshan Fault Zone and the Mechanism of the 2008 Wenchuan Earthquake (ms 8.0). Geochemistry, Geophysics, Geosystems, 10(10): Q10010. https://doi.org/10.1029/2009GC002590
    Lei, J. S., Zhao, D. P., 2016a. Large Earthquakes and Structural Heterogeneity in Eastern Tibetan Plateau. In: Duarte, J. C., Schellart, W. P., eds., Plate Boundaries and Natural Hazards. Wiley. 167–191. https://doi.org/10.1002/9781119054146.ch8
    Lei, J. S., Zhao, D. P., 2016b. Teleseismic P-Wave Tomography and Mantle Dynamics beneath Eastern Tibet. Geochemistry, Geophysics, Geosystems, 17(5): 1861–1884. https://doi.org/10.1002/2016GC006262
    Lei, J. S., Zhao, D. P., Xu, X. W., et al., 2019. Is There a Big Mantle Wedge under Eastern Tibet?. Physics of the Earth and Planetary Interiors, 292: 100–113. https://doi.org/10.1016/j.pepi.2019.04.005
    Lev, E., Long, M. D., van der Hilst, R. D., 2006. Seismic Anisotropy in Eastern Tibet from Shear Wave Splitting Reveals Changes in Lithospheric Deformation. Earth and Planetary Science Letters, 251(3/4): 293–304. https://doi.org/10.1016/j.epsl.2006.09.018
    Li, C., van der Hilst, R. D., Meltzer, A. S., et al., 2008. Subduction of the Indian Lithosphere beneath the Tibetan Plateau and Burma. Earth and Planetary Science Letters, 274(1/2): 157–168.
    Li, M. K., Zhang, S. X., Wang, F., et al., 2016. Crustal and Upper-Mantle Structure of the Southeastern Tibetan Plateau from Joint Analysis of Surface Wave Dispersion and Receiver Functions. Journal of Asian Earth Sciences, 117: 52–63. https://doi.org/10.1016/j.jseaes.2015.12.002
    Li, Y. H., Wu, Q. J., Pan, J. T., et al., 2013. An Upper-Mantle S-Wave Velocity Model for East Asia from Rayleigh Wave Tomography. Earth and Planetary Science Letters, 377/378: 367–377. https://doi.org/10.1016/j.epsl.2013.06.033
    Li, Y. H., Wu, Q. J., Zhang, F. X., et al., 2011. Seismic Anisotropy of the Northeastern Tibetan Plateau from Shear Wave Splitting Analysis. Earth and Planetary Science Letters, 304(1/2): 147–157. https://doi.org/10.1016/j.epsl.2011.01.026
    Li, Z. H., Xu, Z., Gerya, T., et al., 2013. Collision of Continental Corner from 3-D Numerical Modeling. Earth and Planetary Science Letters, 380: 98–111. https://doi.org/10.1016/j.epsl.2013.08.034
    Liu, Z., Tian, X., Gao, R., et al., 2017. New Images of the Crustal Structure beneath Eastern Tibet from a High-Density Seismic Array. Earth and Planetary Science Letters, 480: 33–41. https://doi.org/10.1016/j.epsl.2017.09.048
    Meltzer, A., 2003. Geodynamics of Indentor Corners. International Federation of Digital Seismograph Networks. https://doi.org/10.7914/SN/XE_2003
    Molnar, P., Tapponnier, P., 1975. Cenozoic Tectonics of Asia: Effects of a Continental Collision: Features of Recent Continental Tectonics in Asia can be Interpreted as Results of the India-Eurasia Collision. Science, 189(4201): 419–426. https://doi.org/10.1126/science.189.4201.419
    Nábělek, J., Hetényi, G., Vergne, J., et al., 2009. Underplating in the Himalaya-Tibet Collision Zone Revealed by the Hi-CLIMB Experiment. Science, 325(5946): 1371–1374. https://doi.org/10.1126/science.1167719
    Pei, S. P., Niu, F. L., Ben-Zion, Y., et al., 2019. Seismic Velocity Reduction and Accelerated Recovery Due to Earthquakes on the Longmenshan Fault. Nature Geoscience, 12(5): 387–392. https://doi.org/10.1038/s41561-019-0347-1
    Pei, S. P., Zhao, J. M., Sun, Y. S., et al., 2007. Upper Mantle Seismic Velocities and Anisotropy in China Determined through Pn and Sn Tomography. Journal of Geophysical Research Atmospheres, 112(B5): B05312. https://doi.org/10.1029/2006JB004409
    Peng, M., Jiang, M., Li, Z. H., et al., 2016. Complex Indian Subduction Style with Slab Fragmentation beneath the Eastern Himalayan Syntaxis Revealed by Teleseismic P-Wave Tomography. Tectonophysics, 667: 77–86. https://doi.org/10.1016/j.tecto.2015.11.012
    Rawlinson, N., Kennett, B. L. N., 2008. Teleseismic Tomography of the Upper Mantle beneath the Southern Lachlan Orogen, Australia. Physics of the Earth and Planetary Interiors, 167(1/2): 84–97. https://doi.org/10.1016/j.pepi.2008.02.007
    Rawlinson, N., Sambridge, M., 2003. Seismic Traveltime Tomography of the Crust and Lithosphere. Advances in Geophysics. Amsterdam: Elsevier, 81–198. https://doi.org/10.1016/s0065-2687(03)46002-0
    Rawlinson, N., Sambridge, M., 2004a. Multiple Reflection and Transmission Phases in Complex Layered Media Using a Multistage Fast Marching Method. Geophysics, 69(5): 1338–1350. https://doi.org/10.1190/1.1801950
    Rawlinson, N., Sambridge, M., 2004b. Wave Front Evolution in Strongly Heterogeneous Layered Media Using the Fast Marching Method. Geophysical Journal International, 156(3): 631–647. https://doi.org/10.1111/j.1365-246X.2004.02153.x
    Rawlinson, N., Kool, M. D., Sambridge, M., 2006. Seismic Wavefront Tracking in 3D Heterogeneous Media: Applications with Multiple Data Classes. Exploration Geophysics, 37(4): 322–330. https://doi.org/10.1071/EG06322
    Rawlinson, N., Urvoy, M., 2006. Simultaneous Inversion of Active and Passive Source Datasets for 3-D Seismic Structure with Application to Tasmania. Geophysical Research Letters, 33(24): L24313. https://doi.org/10.1029/2006gl028105 doi: 10.1029/2006GL028105
    Replumaz, A., Guillot, S., Villaseñor, A., et al., 2013. Amount of Asian Lithospheric Mantle Subducted during the India/Asia Collision. Gondwana Research, 24(3/4): 936–945. https://doi.org/10.1016/j.gr.2012.07.019
    Royden, L. H., Burchfiel, B. C., van der Hilst, R. D., 2008. The Geological Evolution of the Tibetan Plateau. Science, 321(5892): 1054–1058. https://doi.org/10.1126/science.1155371
    Royden, L. H., Burchfiel, B. C., King, R. W., et al., 1997. Surface Deformation and Lower Crustal Flow in Eastern Tibet. Science, 276(5313): 788–790. https://doi.org/10.1126/science.276.5313.788
    Şengör, A. M. C., Natal'In, B. A., Burtman, V. S., 1993. Evolution of the Altaid Tectonic Collage and Palaeozoic Crustal Growth in Eurasia. Nature, 364(6435): 299–307. https://doi.org/10.1038/364299a0
    Sethian, J. A., 1996. A Fast Marching Level Set Method for Monotonically Advancing Fronts. Proceedings of the National Academy of Sciences of the United States of America, 93(4): 1591–1595. https://doi.org/10.1073/pnas.93.4.1591
    Sethian, J. A., Popovici, A. M., 2012. 3-D Traveltime Computation Using the Fast Marching Method. Geophysics, 64(2): 516–523. https://doi.org/10.1190/1.1444558
    Singh, A., Kumar, M. R., 2009. Seismic Signatures of Detached Lithospheric Fragments in the Mantle beneath Eastern Himalaya and Southern Tibet. Earth and Planetary Science Letters, 288(1/2): 279–290. https://doi.org/10.1016/j.epsl.2009.09.031
    Sol, S., Meltzer, A., Bürgmann, R., et al., 2007. Geodynamics of the Southeastern Tibetan Plateau from Seismic Anisotropy and Geodesy. Geology, 35(6): 563. https://doi.org/10.1130/g23408a.1 doi: 10.1130/G23408A.1
    Styron, R., Taylor, M., Okoronkwo, K., 2010. Database of Active Structures from the Indo-Asian Collision. Eos, Transactions American Geophysical Union, 91(20): 181. https://doi.org/10.1029/2010eo200001
    Sun, C. Q., Chen, Y., Gao, E. G, 2011. The Crustal Anisotropy and Its Geodynamical Significance of the Strong Basin-Range Interaction Zone beneath the East Margin of Qinghai-Tibet Plateau. Chinese Journal of Geophysics, 54(5): 1205–1214. https://doi.org/10.3969/j.issn.0001-5733.2011.05.009 (in Chinese with English Abstract)
    Tapponnier, P., Xu, Z. Q., Roger, F., et al., 2001. Oblique Stepwise Rise and Growth of the Tibet Plateau. Science, 294(5547): 1671–1677. https://doi.org/10.1126/science.105978
    Taylor, M., Yin, A., 2009. Active Structures of the Himalayan-Tibetan Orogen and Their Relationships to Earthquake Distribution, Contemporary Strain Field, and Cenozoic Volcanism. Geosphere, 5(3): 199–214. https://doi.org/10.1130/ges00217.1 doi: 10.1130/GES00217.1
    Tilmann, F., Ni, J., Hearn, T., et al., 2003. Seismic Imaging of the Downwelling Indian Lithosphere beneath Central Tibet. Science, 300: 1424–1427. https://doi.org/10.1126/science.1082777
    Tunini, L., Jiménez-Munt, I., Fernandez, M., et al., 2016. Geophysical-Petrological Model of the Crust and Upper Mantle in the India-Eurasia Collision Zone. Tectonics, 35(7): 1642–1669. https://doi.org/10.1002/2016tc004161 doi: 10.1002/2016TC004161
    Wei, W. B., Unsworth, M., Jones, A., et al., 2001. Detection of Widespread Fluids in the Tibetan Crust by Magnetotelluric Studies. Science, 292(5517): 716–719. https://doi.org/10.1126/science.1010580
    Wei, W., Zhao, D. P., Xu, J. D., 2013. P-Wave Anisotropic Tomography in Southeast Tibet: New Insight into the Lower Crustal Flow and Seismotectonics. Physics of the Earth and Planetary Interiors, 222: 47–57. https://doi.org/10.1016/j.pepi.2013.07.002
    Wessel, P., Smith, W. H. F., Scharroo, R., et al., 2013. Generic Mapping Tools: Improved Version Released. Eos, Transactions American Geophysical Union, 94(45): 409–410. https://doi.org/10.1002/2013eo450001
    Willett, S. D., Beaumont, C., 1994. Subduction of Asian Lithospheric Mantle beneath Tibet Inferred from Models of Continental Collision. Nature, 369(6482): 642–645. https://doi.org/10.1038/369642A0 doi: 10.1038/369642a0
    Windley, B. F., Alexeiev, D., Xiao, W. J., et al., 2007. Tectonic Models for Accretion of the Central Asian Orogenic Belt. Journal of the Geological Society, 164(1): 31–47. https://doi.org/10.1144/0016-76492006-022
    Xiao, W. J., Huang, B. C., Han, C. M., et al., 2010. A Review of the Western Part of the Altaids: A Key to Understanding the Architecture of Accretionary Orogens. Gondwana Research, 18(2/3): 253–273. https://doi.org/10.1016/j.gr.2010.01.007
    Xiao, Z., Fuji, N., Iidaka, T., et al., 2020. Seismic Structure beneath the Tibetan Plateau from Iterative Finite-Frequency Tomography Based on ChinArray: New Insights into the Indo-Asian Collision. Journal of Geophysical Research: Solid Earth, 125(2): e2019jb018344. https://doi.org/10.1029/2019jb018344
    Xu, Q., Liu, X. H., Ding, L., 2016. Miocene High-Elevation Landscape of the Eastern Tibetan Plateau. Geochemistry, Geophysics, Geosystems, 17(10): 4254–4267. https://doi.org/10.1002/2016gc006437 doi: 10.1002/2016GC006437
    Xu, Q., Pei, S., Yuan, X., et al., 2019. Seismic Evidence for Lateral Asthenospheric Flow beneath the Northeastern Tibetan Plateau Derived from S Receiver Functions. Geochemistry, 20(2): 883–894. https://doi.org/10.1029/2018GC007986
    Yang, Y. J., Ritzwoller, M. H., Zheng, Y., et al., 2012. A Synoptic View of the Distribution and Connectivity of the Mid-Crustal Low Velocity Zone beneath Tibet. Journal of Geophysical Research: Solid Earth, 117(B4): B04303. https://doi.org/10.1029/2011JB008810
    Ye, Z., Li, J. T., Gao, R., et al., 2017. Crustal and Uppermost Mantle Structure across the Tibet-Qinling Transition Zone in NE Tibet: Implications for Material Extrusion beneath the Tibetan Plateau. Geophysical Research Letters, 44(20): 10316–10323. https://doi.org/10.1002/2017gl075141 doi: 10.1002/2017GL075141
    Yin, A., Harrison, T. M., 2000. Geologic Evolution of the Himalayan-Tibetan Orogen. Annual Review of Earth and Planetary Sciences, 28: 211–80. https://doi.org/10.1146/annurev.earth.28.1.211.
    Yu, C. Q., Zheng, Y. C., Shang, X. F., 2017. Crazyseismic: A MATLAB GUI-Based Software Package for Passive Seismic Data Preprocessing. Seismological Research Letters, 88(2A): 410–415. https://doi.org/10.1785/0220160207
    Yue, H., Chen, Y. J., Sandvol, E., et al., 2012. Lithospheric and Upper Mantle Structure of the Northeastern Tibetan Plateau. Journal of Geophysical Research: Solid Earth, 117(B5): B05307. https://doi.org/10.1029/2011jb008545
    Zhang, F. X., Wu, Q. J., Li, Y. H., et al., 2018. Seismic Tomography of Eastern Tibet: Implications for the Tibetan Plateau Growth. Tectonics, 37(9): 2833–2847. https://doi.org/10.1029/2018TC004977
    Zhang, H., Li, Y., Zhao, D. P., et al., 2018. Formation of Rifts in Central Tibet: Insight from P Wave Radial Anisotropy. Journal of Geophysical Research: Solid Earth, 123: 8827–8841. https://doi.org/10.1029/2018JB015801
    Zhang, H., Zhao, D. P., Zhao, J. M., et al., 2017. Internal Deformation of Lithosphere beneath Central Tibet. Journal of Geophysical Research: Solid Earth, 122(9): 7329–7342. https://doi.org/10.1002/2017jb014184
    Zhang, H., Zhao, D. P., Zhao, J. M., et al., 2021. Upper Mantle Heterogeneity and Radial Anisotropy beneath the Western Tibetan Plateau. Tectonics, 40(2): e2020TC006403. https://doi.org/10.1029/2020TC006403
    Zhang, H., Zhao, D. P., Zhao, J. M., et al., 2012. Convergence of the Indian and Eurasian Plates under Eastern Tibet Revealed by Seismic Tomography. Geochemistry, Geophysics, Geosystems, 13(6): Q06W14. https://doi.org/10.1029/2012gc004031
    Zhang, H., Zhao, J., Xu, Q., 2011. Seismic P-Wave Tomography in Eastern Tibet: Formation of the Rifts. Chinese Science Bulletin, 56(23): 2450–2455. https://doi.org/10.1007/s11434-011-4577-x
    Zhang, P. Z., Shen, Z. K., Wang, M., et al., 2004. Continuous Deformation of the Tibetan Plateau from Global Positioning System Data. Geology, 32(9): 809–812. https://doi.org/10.1130/g20554.1
    Zhang, X. Y., Wang, Y. H., Gao, R., et al., 2017. Vertical Crustal Motions across Eastern Tibet Revealed by Topography-Dependent Seismic Tomography. Scientific Reports, 7: 3243. https://doi.org/10.1038/s41598-017-03578-z
    Zhang, Z. J., Yuan, X., Chen, Y., et al., 2010. Seismic Signature of the Collision between the East Tibetan Escape Flow and the Sichuan Basin. Earth and Planetary Science Letters, 292(3/4): 254–264. https://doi.org/10.1016/J.EPSL.2010.01.046
    Zhao, J. M., Murodov, D., Huang, Y., et al., 2014. Upper Mantle Deformation beneath Central-Southern Tibet Revealed by Shear Wave Splitting Measurements. Tectonophysics, 627: 135–140. https://doi.org/10.1016/j.tecto.2013.11.003
    Zhao, W. J., Kumar, P., Mechie, J., et al., 2011. Tibetan Plate Overriding the Asian Plate in Central and Northern Tibet. Nature Geoscience, 4(12): 870–873. https://doi.org/10.1038/ngeo1309
    Zheng, C., Zhang, R. Q., Wu, Q. J., et al., 2019. Variations in Crustal and Uppermost Mantle Structures across Eastern Tibet and Adjacent Regions: Implications of Crustal Flow and Asthenospheric Upwelling Combined for Expansions of the Tibetan Plateau. Tectonics, 38(8): 3167–3181. https://doi.org/10.1029/2018tc005276
    Zheng, Y. F., Xiao, W. J., Zhao, G., 2013. Introduction to Tectonics of China. Gondwana Research, 23(4): 1189–1206. https://doi.org/10.1016/j.gr.2012.10.001
    Zou, Y., Tian, X. B., Yu, Y. Q., et al., 2019. Seismic Evidence for the Existence of an Entrained Mantle Flow Coupling the Northward Advancing Indian Plate under Tibet. Earth and Planetary Physics, 3(1): 62–68. https://doi.org/10.26464/epp2019007
  • Relative Articles

    [1]Yiqiu Yan, Changbao Guo, Wenkai Chen, Zhendong Qiu, Caihong Li, Hao Yuan, Xinxia Yuan. Deformation Characteristics and Mechanisms of Large Deep-Seated Slow-Moving Landslides in Active Fault Zones: Insights from the Renniang River Watershed of the Jinsha River Fault, Tibetan Plateau[J]. Journal of Earth Science. doi: 10.1007/s12583-024-0158-1
    [2]Kai Yi, Xianyong Cao. Recent vegetation shifts on the Tibetan Plateau exceed the range of variations seen over past millennia in pollen record[J]. Journal of Earth Science. doi: 10.1007/s12583-025-2029-9
    [3]Si-Wen Zhang, Feng Wang, Ren-Yi Jia, Wen-Liang Xu, Yi-Ni Wang, De-Bin Yang, Hai-Hong Zhang. Trench-perpendicular mantle flow recorded by late Mesozoic intraplate magmatism and implications for the formation of the eastern Asian big mantle wedge[J]. Journal of Earth Science. doi: 10.1007/s12583-025-0220-7
    [4]Jibin Han, Jianping Wang, Hongkui Ma, Yongshou Li, Zhao An, Yong Xiao, Wenhua Han, Huaide Cheng, Haizhou Ma, Hongchen Jiang. Flow variation and circulation process of saline springs in the Nangqen Basin, Tibetan Plateau[J]. Journal of Earth Science. doi: 10.1007/s12583-024-0086-0
    [5]Yanwen Chen, Daoyang Yuan, Hao Sun, Yan Zhan, Hongqiang Li, Yameng Wen, Ruihuan Su, Jinchao Yu. Characteristics of the recently identified seismic surface rupture zone along the eastern segment of the Kunzhong fault and its seismogeological significance, northern Tibetan Plateau[J]. Journal of Earth Science. doi: 10.1007/s12583-025-0232-3
    [6]Xiao-Dong Deng, Jian-Wei Li. Quantitatively Evaluating the Erosion and Preservation of Supergene Oxide Zones: Evidence from the Yulong Porphyry Cu Deposit, Eastern Tibetan Plateau[J]. Journal of Earth Science, 2024, 35(1): 280-282. doi: 10.1007/s12583-023-1952-x
    [7]Yiming Liu, Chao Chen, Qing Liang, Zhengwang Hu. Crust and Upper Mantle Density Structures beneath the Eastern Tianshan Region and Its Tectonic Implications[J]. Journal of Earth Science, 2024, 35(3): 828-838. doi: 10.1007/s12583-021-1599-4
    [8]Olga Zabinyakova, Elena Bataleva, Irina Medved. Comparison Analysis of Longitudinal Electrical Conductivity Distribution and Seismic Tomography Velocity Models for the Central Tien Shan Region[J]. Journal of Earth Science, 2023, 34(2): 580-587. doi: 10.1007/s12583-022-1621-5
    [9]Xiaobo He. Small-Scale Heterogeneity and Seismic Anisotropy in the Mid-Mantle: Oceanic Crust versus Meta-Stable Olivine[J]. Journal of Earth Science, 2022, 33(4): 1056-1058. doi: 10.1007/s12583-022-1700-7
    [10]Shiyuan Wang, Rongjun Zhou, Mingjian Liang, Shao Liu, Nina Liu, Jianyu Long. Co-Seismic Surface Rupture and Recurrence Interval of Large Earthquakes along Damaoyaba-Litang Segment of the Litang Fault on the Eastern Margin of the Tibetan Plateau in China[J]. Journal of Earth Science, 2021, 32(5): 1139-1151. doi: 10.1007/s12583-021-1425-z
    [11]Vladimir R. Shmelev, Shoji Arai, Akihiro Tamura. Heterogeneity of Mantle Peridotites from the Polar Urals (Russia): Evidence from New LA-ICP-MS Data[J]. Journal of Earth Science, 2019, 30(3): 431-450. doi: 10.1007/s12583-019-1224-y
    [12]Weibing Qin, Shuangxi Zhang, Mengkui Li, Tengfei Wu, Chaoyu Zhang. Distribution of Intra-Crustal Low Velocity Zones beneath Yunnan from Seismic Ambient Noise Tomography[J]. Journal of Earth Science, 2018, 29(6): 1409-1418. doi: 10.1007/s12583-017-0815-8
    [13]Xiaowei Li, Xuanxue Mo, Mark Scheltens, Qi Guan. Mineral chemistry and crystallization conditions of the Late Cretaceous Mamba pluton from the eastern Gangdese, Southern Tibetan Plateau[J]. Journal of Earth Science, 2016, 27(4): 545-570. doi: 10.1007/s12583-016-0713-5
    [14]Jing Tan, Hongyi Li, Xinfu Li, Ming Zhou, Longbin Ouyang, Sanjian Sun, Dan Zheng. Radial anisotropy in the crust beneath the northeastern Tibetan Plateau from ambient noise tomography[J]. Journal of Earth Science, 2015, 26(6): 864-871. doi: 10.1007/s12583-015-0543-x
    [15]Shugen Liu, Bin Deng, Zhiwu Li, Luba Jansa, Shun Liu, Guozhi Wang, Wei Sun. Geological Evolution of the Longmenshan Intracontinental Composite Orogen and the Eastern Margin of the Tibetan Plateau[J]. Journal of Earth Science, 2013, 24(6): 874-890. doi: 10.1007/s12583-013-0391-5
    [16]Satoru Tanaka. One-Dimensional Modeling of Multiple Scattering in the Upper Inner Core: Depth Extent of a Scattering Region in the Eastern Hemisphere[J]. Journal of Earth Science, 2013, 24(5). doi: 10.1007/s12583-013-0366-6
    [17]Zengbao Zhang, Chuanbo Shen, Chun Shao, Zhaoqian Liu. Tectonothermal Evolution of the Eastern Tibetan Plateau Foreland: Fission-Track Thermochronology of the Southern Dabashan Fold-Thrust Belt[J]. Journal of Earth Science, 2013, 24(4): 479-490. doi: 10.1007/s12583-013-0344-z
    [18]Xiaoming Xu, Hongyi Li, Meng Gong, Zhifeng Ding. Three-Dimensional S-Wave Velocity Structure in Eastern Tibet from Ambient Noise Rayleigh and Love Wave Tomography[J]. Journal of Earth Science, 2011, 22(2): 195-204. doi: 10.1007/s12583-011-0172-y
    [19]Sheng JIN, Gao-feng YE, Wen-bo WEI, Ming DENG, Jian-en JING. Electrical Structure and Fault Features of Crust and Upper Mantle beneath the Western Margin of the Qinghai-Tibet Plateau: Evidence from the Magnetotelluric Survey along Zhada-Quanshui Lake Profile[J]. Journal of Earth Science, 2007, 18(4): 326-333.
    [20]Gao-feng YE, Sheng JIN, Wen-bo WEI, Martyn Unsworth. Research of the Conductive Structure of Crust and the Upper Mantle beneath the South-Central Tibetan Plateau[J]. Journal of Earth Science, 2007, 18(4): 334-343.
  • Cited by

    Periodical cited type(2)

    1. Qihang Yin, Xi Xu, Xiaodong Yang, et al. Imaging the Western Boundary of the Sichuan Craton from Multiple Geophysical Observations. Journal of Earth Science, 2024, 35(6): 1860. doi:10.1007/s12583-023-1974-z
    2. Qian Zhao, Hongtao Zhu, Wei Zou, et al. U–Pb detrital zircon ages from late Eocene to early Oligocene Pinghu formation of the East China Sea Shelf Basin: Inferences on synergistic effects between East Asia offshore sedimentation and major rivers supply. Marine and Petroleum Geology, 2024, 162: 106739. doi:10.1016/j.marpetgeo.2024.106739

    Other cited types(0)

  • Created with Highcharts 5.0.7Amount of accessChart context menuAbstract Views, HTML Views, PDF Downloads StatisticsAbstract ViewsHTML ViewsPDF Downloads2024-062024-072024-082024-092024-102024-112024-122025-012025-022025-032025-042025-0502.557.51012.5
    Created with Highcharts 5.0.7Chart context menuAccess Class DistributionFULLTEXT: 41.3 %FULLTEXT: 41.3 %META: 41.3 %META: 41.3 %PDF: 17.4 %PDF: 17.4 %FULLTEXTMETAPDF
    Created with Highcharts 5.0.7Chart context menuAccess Area Distribution其他: 2.0 %其他: 2.0 %Algeria: 0.4 %Algeria: 0.4 %Bangladesh: 9.2 %Bangladesh: 9.2 %Brazil: 0.3 %Brazil: 0.3 %Canada: 0.5 %Canada: 0.5 %China: 28.2 %China: 28.2 %France: 0.4 %France: 0.4 %Hong Kong, China: 0.3 %Hong Kong, China: 0.3 %India: 3.7 %India: 3.7 %Indonesia: 0.9 %Indonesia: 0.9 %Iraq: 0.4 %Iraq: 0.4 %Italy: 0.3 %Italy: 0.3 %Japan: 0.7 %Japan: 0.7 %Korea Republic of: 0.5 %Korea Republic of: 0.5 %Lithuania: 0.4 %Lithuania: 0.4 %Myanmar: 0.1 %Myanmar: 0.1 %New Zealand: 0.7 %New Zealand: 0.7 %Other: 2.3 %Other: 2.3 %Portugal: 0.5 %Portugal: 0.5 %Reserved: 4.7 %Reserved: 4.7 %Russian Federation: 11.1 %Russian Federation: 11.1 %Singapore: 0.3 %Singapore: 0.3 %Switzerland: 0.8 %Switzerland: 0.8 %Taiwan, China: 0.3 %Taiwan, China: 0.3 %United Kingdom: 0.3 %United Kingdom: 0.3 %United States: 30.5 %United States: 30.5 %罗奥尔凯埃: 0.3 %罗奥尔凯埃: 0.3 %其他AlgeriaBangladeshBrazilCanadaChinaFranceHong Kong, ChinaIndiaIndonesiaIraqItalyJapanKorea Republic ofLithuaniaMyanmarNew ZealandOtherPortugalReservedRussian FederationSingaporeSwitzerlandTaiwan, ChinaUnited KingdomUnited States罗奥尔凯埃

Catalog

    通讯作者: 陈斌, bchen63@163.com
    • 1. 

      沈阳化工大学材料科学与工程学院 沈阳 110142

    1. 本站搜索
    2. 百度学术搜索
    3. 万方数据库搜索
    4. CNKI搜索

    Figures(7)

    Article Metrics

    Article views(307) PDF downloads(130) Cited by(2)
    Proportional views
    Related

    /

    DownLoad:  Full-Size Img  PowerPoint
    Return
    Return