Processing math: 100%
Advanced Search

Indexed by SCI、CA、РЖ、PA、CSA、ZR、etc .

Biao Shu, Fan Zeng, John Kemeny, Runjun Zhu, Keping Chen, Jingqiang Tan. Analysis of the Hydraulic and Heat Transfer Evolution Mechanism of a Single Rock Fracture. Journal of Earth Science, 2023, 34(1): 205-213. doi: 10.1007/s12583-022-1648-7
Citation: Biao Shu, Fan Zeng, John Kemeny, Runjun Zhu, Keping Chen, Jingqiang Tan. Analysis of the Hydraulic and Heat Transfer Evolution Mechanism of a Single Rock Fracture. Journal of Earth Science, 2023, 34(1): 205-213. doi: 10.1007/s12583-022-1648-7

Analysis of the Hydraulic and Heat Transfer Evolution Mechanism of a Single Rock Fracture

doi: 10.1007/s12583-022-1648-7
More Information
  • Corresponding author: Keping Chen, chenkeping@csu.edu.cn
  • Received Date: 29 Jul 2021
  • Accepted Date: 11 Mar 2022
  • Issue Publish Date: 28 Feb 2023
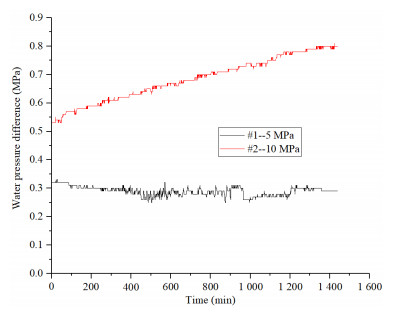
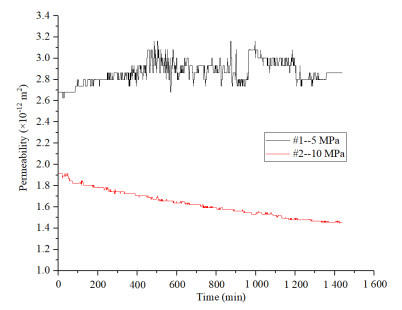
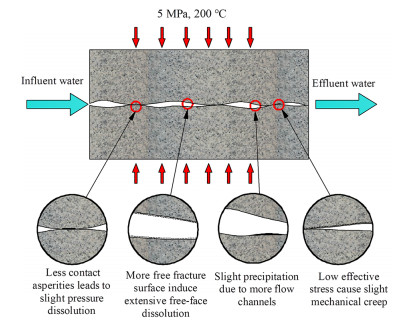
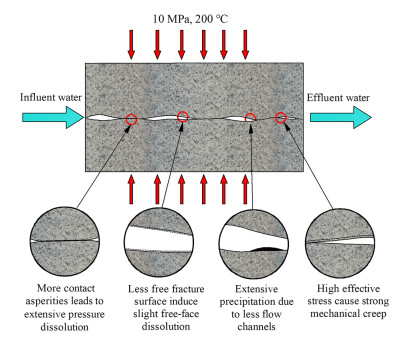
  • Mineral dissolution and mechanical deformation of granite are two main mechanisms that affect permeability evolution of rock fracture. In this study, two water flow-through experiments with large granite fractures were conducted at 200 ℃ with a constant flow rate for 24 h, under confining pressures of 5 and 10 MPa, respectively. Water pressure and temperature were measured, fracture aperture and permeability were calculated, and chemical element concentrations in effluent water were tested for mechanism analysis. The permeability fluctuates up and down between 2.62 × 10⁻¹² and 3.16 × 10⁻¹² m2 at confining pressure of 5 MPa; while it decreased monotonously by 24% from 1.92 × 10⁻¹² to 1.45 × 10⁻¹² m2 at a confining pressure of 10 MPa. The heat transfer rates at both experiments stay stable at about 0.25 J/s. The mass concentration of Ca, Na, K, and Si in effluent water are between 5 to 23 mg/L, indicating slight dissolution of Ca-plagioclase, Na-plagioclase, and K-feldspar, as well as possible precipitation of minor amount of kaolinite or quartz. The total amount of free-face dissolution and pressure dissolution are similar at 5 and 10 MPa. The geochemical reaction counts for only small part of the aperture change, while the mechanical deformation counts the major part of the aperture change.


  • Geothermal energy is a type of promising low carbon energy that can reduce fossil energy consumption and carbon dioxide emissions (Ma et al., 2019; Regenauer-Lieb et al., 2015). The total installed power plant capacity of geothermal was 14.9 GW worldwide in 2019 (Richter, 2019), and it is estimated to reach up to 140 GW by 2050 (Bertani, 2016). One percent of the total estimated geothermal energy in the world can provide 2 500 years of power (Olasolo et al., 2016).

    The enhanced geothermal system (EGS) is considered the most feasible and commonly acceptable method to develop baseload scale geothermal energy from hot dry rocks (HDR) (Bentz et al., 2020). In EGSs, drilling and stimulation are first used to enhance the permeability of geothermal reservoir (Frash et al., 2014), and then, the working fluid (such as water) is injected into geothermal reservoir rocks through an injection well and then pumped to the ground surface through an outlet well after extracting heat from hot rocks (Olasolo et al., 2016). For a successful geothermal energy production of EGS, a high density of artificial fractures created by hydraulic fracturing is required to provide conductive flow pathways, as well as a sufficient contact area between the heat transfer medium, such as water, and the HDR (Guo et al., 2019; Shu et al., 2019a; Wu et al., 2016). The heat extraction and the temperature of water flowing through fractures in EGS can be calculated with a semi-analytical solution (Wu et al., 2017, 2015). Fluid movement in fracture networks is of critical importance to geothermal energy extraction (Bai et al., 2017).

    The permeability of fracture networks is a highly important factor that affects the heat production efficiency and longevity of EGSs (Parisio and Yoshioka, 2020; Zhong et al., 2016; Yasuhara et al., 2006). Permeability reduction with increased duration of circulation (Morrow et al., 2001) and/or increased confining pressure (Yasuhara et al., 2004) has been reported. Additionally, fracture permeability evolution is more sensitive to temperature and confining pressure compared with the permeability of porous media (Polak et al., 2003; Durham et al., 2001; Moore et al., 1994).

    Geochemical dissolution (i.e., pressure dissolution and free-face dissolution) and stress mechanical deformation are two main factors affecting fracture permeability (Yasuhara et al., 2004; Durham et al., 2001; Moore et al., 1994). It was discovered that dissolution and precipitation of minerals occurred at the granitic rock fracture surface during a flow through experiment (Qiao et al., 2019). Among these factors, free-face dissolution can increase the permeability because the mineral mass is net removed from the fracture surface (Taron and Elsworth, 2009; Liu et al., 2006); however, the pressure dissolution of fracture propping asperities can cause permeability to decrease (Polak et al., 2004). Mineral precipitation on a fracture surface, resulting from mineral dissolution, may slightly change the permeability of the fracture surface (Yasuhara et al., 2011). Dissolution and precipitation of minerals in hydrothermal conditions have been observed using scanning electron microscopy and inductively coupled plasma analysis (Morrow et al., 2001). Some minerals are easier to be dissolved in water, such as calcite, feldspar, and biotite, whereas other minerals are much more difficult to be dissolved, such as quartz (Savage et al., 1992). In addition to mineral dissolution, mechanical processes at contacting asperities of a fracture surface may be another important factor causing fracture aperture and permeability change at confining pressures (Yasuhara et al., 2011). A previous study has shown that rock material compressibility and fracture deformation during thermal-hydro coupling processes can significantly affect the discontinuity conductivity of geothermal reservoirs (Chen et al., 2020).

    Experimental studies regarding the permeability evolution pertaining to THMC coupling have been reported; however, most of those studies were conducted on non-granite rocks, such as novaculite (Polak et al., 2003) or limestone (Polak et al., 2004); only a few experimental studies have been performed in granite-rock-type EGS reservoirs (Caulk et al., 2016). In these experimental studies of fracture permeability, most of the experiments were conducted at temperatures less than 150 ℃ or on small rock specimens less than 50 mm long. The main mechanism of chemical dissolution and stress deformation of granite may differ when different compressive pressures were applied on the fracture surface. In conclusion, long-term fluid flow-through experimental studies based on real EGS temperatures and large granite fractures are lacking for investigating the THMC mechanism of the permeability evolution under different in-situ stresses. The reservoir pressure and temperature variation are the most important factors affecting the water-rock reaction (Zheng et al., 2019). Therefore, in this paper, water flow-through experiments of granite fractures were conducted to explore the effect of in-situ stress on fracture permeability under high temperature, and the chemical and mechanical processes behind.

    Two flow-through experiments were conducted on a novel experiment device at 200 ℃ for 24 h under confining pressures of 5 and 10 MPa. Granite rock samples were collected from a major deep geothermal reservoir area, and the temperature used resembled the actual EGS temperature. The pressure and temperature of influent and effluent water were collected continuously to calculate the hydraulic aperture, permeability, and heat transfer rate. It was discovered that the permeability evolution differed vastly owing to the different confining pressures. Chemical element concentrations were tested with effluent water samples. Based on the results, the mechanism of mineral dissolution and mechanical deformation were analyzed and discussed. It was discovered that the permeability evolution in the EGS reservoir environment depended significantly on the confining pressure, but the heat transfer rate was not affected. The result of this study can provide insight into the effects of in-situ stresses on the hydraulic properties and heat recovery properties of EGS reservoirs; therefore, it is crucial to the evaluation of geothermal energy production efficiency.

    Geothermal energy is usually preserved in granite rocks (Xiao et al., 2020), so flow-through experiments were performed on two granite rock samples. The mineral contents of the rock sample, obtained by X-ray diffraction (XRD) analysis, are composed of 25% of quartz, 45% K-feldspar, 25% plagioclase, and 5% biotite. The mineral grain size was between 0.5 and 2.0 mm. The density of the granite samples was 2.65 g/cm3.

    Each cylinder granite core, measuring 50 mm in diameter and 100 mm in length, was split into two halves make it an artificial rough fracture, as shown in Fig. 1a. The two semi-cylinders of each sample were placed together and fit closely in the same manner as before they were split. Polymer tape and soft copper sleeve were used to prevent water leakage and maintain confining pressure.

    Figure  1.  (a) One split granite rock sample and (b) fluid flow-through experiment device.

    The experimental device, as shown in Fig. 1b, can conduct high temperature high pressure fluid flow-through test, with maximum temperature of 350 ℃ and maximum pressure of 50 MPa. It primarily includes a heatable core holder, confining pressure pump, and pore pressure pump, pressure sensors, and temperature sensors. The core holder can heat rock sample to predetermined temperature. The confining pressure, fluid pressure, rock temperature, and flow rate were controlled and monitored using a computer. More details regarding the experimental device is shown in Fig. 2, and its mechanism are reported in a previous study (Shu et al., 2019b). This new study steps forward on the basis of our previous studies, and focused on the effect of in-situ stress on the permeability change, and the mechanism behind that.

    Figure  2.  Schedule of water flow-through experiment (not to scale).

    Two water flow-through experiments were conducted at 200 ℃, under confining pressures of 5 and 10 MPa, separately. Each flow-through process lasted 1 440 min (24 h), and the flow rate was maintained at 1.0 mL/min at all times. The experimental parameters are shown in Table 1.

    Table  1.  Experimental parameter design
    Experiment Confining pressure (MPa) Temperature (ºC) Flow rate (mL/min) Flow time (min)
    #1 5 200 1.0 1 440
    #2 10 200 1.0 1 440
     | Show Table
    DownLoad: CSV

    The experiment can be described as below.

    (1) Install fracture sample into the core holder, gradually increase the temperature of sample to 200 ℃ at a rate of 5 ℃/h, and the temperature was hold for 2 h which is sufficient for thermal equilibration (Browning et al., 2016).

    (2) The confining pressure was increased to 5 or 10 MPa.

    (3) Water was injected into the fracture and the flow rate was maintained at 1.0 mL/min.

    (4) After the water flow reached a steady state in the fracture, the water temperatures and water pressures at both the outlet and inlet were recorded continuously for 1 440 min.

    The water pressures at both sides of fractures were recorded in the experiments. The water pressure of outlet was set to be larger than 1.62 MPa to retain water at the liquid state (Shu et al., 2020, 2019b). The water pressure drop from the inlet to the outlet was the pressure required for the fluid to flow through the fracture. The water pressure differences are plotted in Fig. 3.

    Figure  3.  Fluid pressure differences between inlet and outlet at flow-through experiments.

    As shown in Fig. 3, the water pressure difference, at a confining pressure of 5 MPa, generally stayed at about 0.3 MPa and only fluctuated slightly. However, the water pressure difference at the confining pressure of 10 MPa persistently increased from 0.53 to 0.80 MPa. Overall, the water pressure difference at confining pressure of 10 MPa is about two times of that at confining pressure of 5 MPa. Hence, more power was required to transport the same amount of water to flow through the reservoir fractures in higher in-situ stress conditions, and the power will increase with increased circulation duration.

    The density, specific heat capacity and dynamic viscosity applicable to the following calculation of heat transfer and hydraulic properties can be inferred from Fig. 4 (Shu et al., 2022), which was calculated based on equations described by Qu et al. (2017). As shown in this figure, as the temperature increased, the water dynamic viscosity and density decreased. The specific heat capacity first decreased and then increased as the temperature increased.

    Figure  4.  Changes of density, specific heat capacity, and dynamic viscosity of water with temperature (modified from Shu et al. (2022)).

    It has been proved by many experimental studies that Darcy's law and cubic law are valid for water flow in deformable rock fracture (Witherspoon et al., 1980; Iwai, 1976). Many more recent studies (Klepikova et al., 2021; Ma et al., 2019; Caulk et al., 2016; Liu et al., 2006; Polak et al., 2003; Morrow et al., 2001), also consider Darcy's law and cubic law can be directly used for fluid flow-through experimental and numerical modeling at different confining stresses and temperatures. Therefore, we used Darcy's law and cubic law in our data analysis.

    The modified cubic law, representing water flow through a single granite fracture, was shown in Eq. (1) (Witherspoon et al., 1980)

    q=Pdbe312μL
    (1)

    where q is flow rate (m3/s), P is pressure drop from inlet to outlet (Pa), d is fracture width (sample diameter) (m), be is equivalent hydraulic aperture (m), µ is water dynamic viscosity (Pa·s), and L is flow distance (fracture length) (m).

    Transforming Eq. (1), the be can be represented as

    be=312qμLPd
    (2)

    The calculated hydraulic aperture changes in these two experiments are shown in Fig. 5. The initial hydraulic aperture of experiment #1 is larger than that of experiment #2. This is because the higher confining pressure enables the fracture to be more tightly closed. As the flow time progressed, the hydraulic fracture of experiment #1 fluctuated severely but remained in a small range. Overall, it first increased gradually from 5.7 × 10⁻⁶ m to approximately 6.0 × 10⁻⁶ m and then decreased to 5.9 × 10⁻⁶ m. In experiment #2, it is clear that the hydraulic aperture decreased stably from approximately 4.8 × 10⁻⁶ to 4.2 × 10⁻⁶ m. In a previous study, under the confining pressure of 20 MPa, the hydraulic aperture decreased by 14.3% in 1 440 min (Shu et al., 2019b), while in our current study at the confining pressure of 10 MPa, the hydraulic aperture decreased by 12.5%, which means the higher the confining pressure, the faster the hydraulic aperture decreases.

    Figure  5.  Hydraulic apertures in flow-through experiments.

    The permeability of a single fracture can be described by Darcy's law (Caulk et al., 2016)

    ke=qμLPA
    (3)

    where ke is the permeability of the fracture (m2), and A is the cross sectional area of the fracture (m2) expressed as

    A=dbe
    (4)

    Hence, the permeability ke can also be calculated by combining Eqs. (2), (3), and (4), as follows

    ke=be212=112(12qμLPd)2/3
    (5)

    The permeability changes of these two experiments are shown in Fig. 6. The change trends of permeability were the same as those of the hydraulic aperture. At the confining pressure of 5 MPa, the permeability changed slightly in the entire experiment but fluctuated severely. At the confining pressure of 10 MPa, the permeability decreased monotonously by 24%. In a previous study, permeability decreased by 27% under a confining pressure of 20 MPa at the same temperature of 200 ℃ for a same duration of 1 440 min (Shu et al., 2019b). From the experimental results, we may predict that the permeability decreases more significantly under higher confining pressure.

    Figure  6.  Permeability changes in flow-through experiments.

    The heat transferred from the fracture to water was calculated as follows

    Q=qρc(ToTi)
    (6)

    where Q is the heat transfer rate (J/s), To is the effluent water temperature (K), and Ti is the influent water temperature (K).

    The influent water was warmed up to the desighned high temperature before it entered the rock fracture, so in fact, during the experiment, the temperature of influent water is not as low as we thought. In these two experiments, the influent water temperatures were both around 186.9–187.2 ℃, and the effluent water temperatures were both around 190.6–191.0 ℃. The temperature difference between influent water and rock fracture is not very large, therefore, it is not going to have a large effect on the rock deformation and fracture aperture. As we can see from Figs. 8a and 8b, during the whole tests, the fluctuation of influent and effluent water temperatures are very minor and can be ignored.

    The heat transfer rate is only related to flow rate, water density, water heat specific capacity, and water temperature increasement. In these two experiments, all these parameters were almost the same and hence the heat transfer rates. As shown in Figs. 7c and 7d, the heat transfer rates are both stay stable at about 0.25 J/s.

    Figure  7.  (a) Water temperatures of experiment #1; (b) water temperatures of experiment #2; (c) heat transfer rate of experiment #1; (d) heat transfer rate of experiment #2.
    Figure  8.  Normal pressure on the fracture surface.

    This indicated that regardless of the change in the hydraulic aperture and permeability, the water temperature increased from the inlet to the outlet remained unchanged. This could be because the flow rate was small, and regardless of whether it was flowing slightly faster or slower, the water could be fully heated, provided that the rock sample temperatures were the same.

    In this study, plasma emission spectrometry was performed to examine the mass concentration elements in the effluent water. The average mass concentrations obtained from the effluent water of experiments #1 and #2 are listed in Table 2. The mass concentrations of Ca, Na, K, and Si in experiment #1 were 16.33, 13.32, 7.28, and 22.44 mg/L, respectively, whereas those of Ca, Na, K, and Si in experiment #2 were 16.42, 12.43, 5.90, and 13.97 mg/L, respectively. The mass concentrations of Al and Mg were less than 0.3 mg/L in both experiments.

    Table  2.  Average mass concentrations of chemical elements in effluent water
    Element Average mass concentration (mg/L)
    Experiment #1 Experiment #2
    Ca 16.33 16.42
    Na 13.32 12.43
    K 7.28 5.90
    Si 22.44 13.97
    Al < 0.3 < 0.3
    Mg < 0.3 < 0.3
     | Show Table
    DownLoad: CSV

    Previous studies have disclosed that many chemical elements were dissolved in the EGS fluid pumped out of an outlet well (Savage et al., 1992). Therefore, it is crucial to perform a chemical analysis in the flow-through experiments. Caulk et al. (2016) collected influent and effluent water from granite fracture flow through tests; subsequently, they acidified water and analyzed for Si, Al, Ca, Mg, K, Na, and Fe by elemental analysis. They discovered that the dissolution of K, Ca, and Na implied the dissolution of K-feldspar and plagioclase, as well as the precipitation of kaolinite.

    In Table 2, the mass concentrations of Ca, Na, and K in the effluent water correspond to the dissolution of Ca-plagioclase (CaAl2Si2O8), Na-plagioclase (NaAlSi3O8), and K-feldspar (KAlSi3O8), respectively. Biotite was easy to be dissolved, but the concentration of Mg corresponding to the dissolution of biotite (KMg3AlSi3O10(OH)2) was small. Additionally, the content of biotite in the granite sample was only 5%; therefore, the dissolution of biotite is negligible in this study. Savage et al. (1992) reported that quartz was difficult to be dissolved; therefore, we may ignore quartz dissolution in this study also. In the following analysis, we can primarily focus on the dissolution of Ca-plagioclase, Na-plagioclase, and feldspar.

    From Table 2 we can see that the mass concentrations of Ca, Na, and K are 16.33, 13.32, and 7.28 mg/L at experiment #1, and 16.42, 12.43, and 5.90 mg/L at experiment #2, respectively. According to the chemical formula of Ca-plagioclase (CaAl2Si2O8), as well as the mole fraction of elements in the mineral, the mass concentration of Si versus Ca can be calculated by Eq. (7). The same method can be used to calculate the mass concentration of Si versus Na and K using the chemical formula of Na-plagioclase (NaAlSi3O8) and K-feldspar (KAlSi3O8) by Eqs. (8) and (9), respectively.

    MSi(1)MCa=XSi(1)XCa
    (7)
    MSi(2)MNa=XSi(2)XNa
    (8)
    MSi(3)MK=XSi(3)XK
    (9)

    where Msi(1) and MCa are the mass concentration of Si and Ca from the dissolution of Ca-plagioclase, respectively; XSi(1) and XCa are the mole fraction of Si and Ca in Ca-plagioclase, respectively; MSi(2) and MNa are the mass concentration of Si and Na from the dissolution of Na-plagioclase, respectively; XSi(2) and XNa are the mole fraction of Si and Na in Ca-plagioclase, respectively; MSi(3) and MK are the mass concentration of Si and K from the dissolution of K-feldspar, respectively; XSi(1) and XK are the mole fraction of Si and K in K-feldspar, respectively.

    Theoretically, we expect 87.19 and 81.09 mg/L of Si in the effluent water under 5 and 10 MPa, respectively, according to Eqs. (7), (8) and (9). However, the actual Si concentrations were only 22.44 and 13.97 mg/L under 5 and 10 MPa, respectively. Therefore, it was clear that 64.75 and 67.12 mg/L of Si were consumed as resources for new mineral generations and were precipitated at the fracture surface, at 5 and 10 MPa, respectively.

    However, it is also not easy to find out which mineral was generated and precipitated at fracture surface. Because the amount of precipitation is too little, it was unable to tell which mineral it was even with particle-induced X-ray emission (PIXE) analysis, and it was only able to find the presence of Si in the precipitation (Caulk et al., 2016). Caulk et al. (2016) believed that the low ratios of Si to Ca, Na, and K was owing to the formation of kaolinite (Al2Si2O5(OH)4), which consumed a large amount of Si. This may also explain the low concentration of Al in the effluent water.

    In our experiments, a very thin film of white mineral was observed on the fracture surfaces after the flow-through experiments. However, the mineral precipitation at our test is even less than that in Caulk et al.'s (2016) experiments, so it is impossible to collect them for PIXE analysis. Meanwhile, the geochemistry analysis was conducted by Caulk et al. (2016) using acidified effluent water, whereas we used distilled neutral water, therefore, we are unsure of whether the new mineral is kaolinite. In conclusion, some form of mineral must be formed and precipitated at the fracture surface. It may be kaolinite, or other minerals, such as quartz. Because we don't know what mineral and how much minerals were generated, we don't know what elements and how much elements were consumed. This will lead to an unknown of how much minerals were dissolved during experiments.

    As shown in Table 2, the concentrations of Ca, Na, and K in both experiments are similar; therefore, the amounts of feldspar and plagioclases dissolved at these two experiments should be similar. The concentration of Si in experiment #1 is higher than that in experiment #2; therefore, more new minerals, whether it is kaolinite or quartz, were precipitated in experiment #2 than in experiment #1.

    Geochemical dissolution primarily involves pressure dissolution (Polak et al., 2004) occurring at contact asperities, and free-face dissolution (Liu et al., 2006) at free-fracture surfaces. Owing to the different confining pressure, more contacting asperities exist at the fracture surface of higher confining pressure. It resulted in stronger pressure dissolution and less free-face dissolution in experiment #1. On contrary, more extensive free-face dissolution and less pressure dissolution occurred in experiment #2. The total amounts of pressure dissolution plus free-face dissolution in both experiments are quite small and their effect to hydraulic aperture is very minor.

    As we mentioned in Fig. 5, the fracture aperture of experiment #1 only slightly fluctuated but did not change very much, but it decreases consistently in experiment #2. Previous study found fracture aperture always decreases with increased duration of circulation (Caulk et al., 2016), but in experiment #1, the fracture aperture obviously did not decrease. In these two experiments, the total dissolutions were at the same level, whereas the precipitation only affected the fracture aperture or permeability slightly (Yasuhara et al., 2011), but the fact is that there is significant difference in the fracture aperture change between these two experiments. Therefore, geochemical reaction should only count a small part of the fracture aperture change, and the main mechanism should be the mechanical deformation (Caulk et al., 2016).

    The outlet pressure in both experiments was always larger than 1.62 MPa, which was the minimum pressure to retain water in the liquid state at 200 ℃ (Shu et al., 2020, 2019b), whereas the inlet water pressure was larger than the outlet water pressure. The average water pressures in the fracture were approximately 2.06 and 2.31 MPa in experiments #1 and #2, respectively.

    As shown in Fig. 8, taking a cross section of half rock sample to build the mechanical equilibrium equation. We can see at an angle of θ, the force acting on a micro section of the circle is Pc·r·dθ, and it can be divided into two components, horizontal component Pc·r·cosθ·dθ and vertical component Pc·r·sinθ·dθ. The horizontal component at left side will counteract with that at the right side and balance out, with only the vertical component left.

    The total vertical components and the total reaction force can be calculated with the following equations.

    P1=2·900Pc·r·sinθ·dθ
    (10)
    P2=2·Pr·r
    (11)

    where P1 is the total force of vertical components (N), Pc is the confining pressure (MPa), θ is the angle from horizontal line (°), dθ is the micro angle (°), P2 is the total reaction force on the fracture surface (N), Pr is the reaction pressure acting on the fracture surface (MPa).

    The total reaction force P2 acting on the fracture surface equals to the total confining pressure P1 acting on the periphery of cylinder rock sample. Therefore, we can get that

    Pr=Pc
    (12)

    Therefore, the normal pressures applied on the fracture surface caused by the confining pressure were 5 and 10 MPa at confining pressures of 5 and 10 MPa, respectively. The effective normal stress on the fracture surface may be calculated by

    Pe=PcPw
    (13)

    where Pe is the effective normal pressure on the fracture surface (MPa), and Pw is the average water pressure in the fracture (MPa).

    In this study, the effective normal stresses acting on the fracture surface were 2.94 and 7.69 MPa by subtracting the water pressure, for confining pressures of 5 and 10 MPa, respectively.

    At the confining pressure of 5 MPa, the effective contact stress on the fracture surface was 2.94 MP, which is small; as such, the pressure dissolution was not strong and the mechanical deformation of contact asperities was small. Therefore, the fracture aperture did not decrease. In addition, owing to the low effective normal pressure, the fracture was not stably closed when water was flowing in the fracture; hence, the aperture may fluctuate severely.

    On the contrary, at the confining pressure of 10 MPa, the effective contact stress on the fracture surface was 7.69 MPa, which is high; therefore, more pressure dissolution and mechanical deformation occurred on the contact asperities, which decreased the aperture. Additionally, owing to the high effective normal pressure, the fracture was more stably closed; therefore, the fracture aperture did not fluctuate significantly.

    The permeability change mechanism, i.e., geochemical dissolution and mechanical deformation, can be summarized as follows.

    (1) Pressure dissolution, mineral precipitation, and mechanical deformation decreased the permeability, whereas free-face dissolution increased the permeability.

    (2) For low confining pressures (such as 5 MPa), less pressure dissolution, more extensive free-face dissolution, less precipitation, and slight mechanical deformation occurred. Overall, the fracture permeability did not change significantly. See Fig. 9.

    Figure  9.  Illustration of permeability changes at confining pressure of 5 MPa.

    (3) For high confining pressures (such as 10 MPa), more pressure dissolution, less free-face dissolution, more precipitation, and strong mechanical deformation occurred. Overall, the fracture aperture and permeability decreased steadily. See Fig. 10.

    Figure  10.  Illustration of permeability changes at confining pressure of 10 MPa.

    This study focused on the geochemical and mechanical analysis of the permeability and heat transfer evolution. Two long-term flow-through experiments were conducted at 200 ℃ and a constant flow rate of 1.0 mL/min, under confining pressures of 5 and 10 MPa, respectively. It was discovered that the permeability evolution in the EGS reservoir environment depended significantly on the in-situ stress. The result of this study could provide insight into the effects of in-situ stresses on the hydraulic properties and heat recovery properties of EGS reservoirs. The conclusions of this study can be summarized as follows.

    (1) The hydraulic permeability fluctuated up and down severely between 2.62 × 10⁻¹² and 3.16 × 10⁻¹² m2 at a low confining pressure (5 MPa); however, it decreased monotonously by 24% from 1.92 × 10⁻¹² to 1.45 × 10⁻¹² m2 at a high confining pressure (10 MPa). It is the effective stress acting on the fracture surface determine the fracture aperture/permeability change. A very low effective stress may unable to cause a decrease on the fracture aperture/permeability.

    (2) The heat transfer rates from both experiments are stable at about 0.25 J/s, but the pressure drop at confining pressure is about two times of that at confining pressure of 5 MPa. It indicates that more energy is required to extract the same amount of heat from the higher in-situ stress geothermal sites.

    (3) The chemistry analysis of the effluent water to determine the mass concentrations of Ca, K, Na, and Si revealed that the dissolution of Ca-plagioclase, Na-plagioclase, and K-feldspar at both experiments. The geochemical reaction, including dissolution and precipitation, are both quite mild, so even with the state of the art test technologies, it is still unable to quantify the geochemical reactions.

    (4) The geochemical reaction only contributes very little to the fracture aperture change. The mechanical deformation is most likely the main factor that caused fracture aperture and permeability change.

    ACKNOWLEDGMENTS: This research was funded by the National Natural Science Foundation of China (Nos. 42072304 and 41702387), The Science and Technology Innovation Program of Hunan Province (2021RC3009), and the Natural Science Foundation of Hunan Province (No. 2021JJ40726). The final publication is available at Springer via https://doi.org/10.1007/s12583-022-1648-7.
  • Bai, B., He, Y. Y., Li, X. C., et al., 2017. Experimental and Analytical Study of the Overall Heat Transfer Coefficient of Water Flowing through a Single Fracture in a Granite Core. Applied Thermal Engineering, 116: 79–90. https://doi.org/10.1016/j.applthermaleng.2017.01.020
    Bertani, R., 2016. Geothermal Power Generation in the World 2010–2014 Update Report. Geothermics, 60: 31–43. https://doi.org/10.1016/j.geothermics.2015.11.003
    Bentz, S., Kwiatek, G., Martínez-Garzón, P., et al., 2020. Seismic Moment Evolution during Hydraulic Stimulations. Geophysical Research Letters, 47(5): e2019GL086185. https://doi.org/10.1029/2019gl086185
    Browning, J., Meredith, P. G., Gudmundsson, A., 2016. Cooling-Dominated Cracking in Thermally Stressed Volcanic Rocks. Geophysical Research Letters, 43(16): 8417–8425. https://doi.org/10.1002/2016gl070532
    Caulk, R. A., Ghazanfari, E., Perdrial, J. N., et al., 2016. Experimental Investigation of Fracture Aperture and Permeability Change within Enhanced Geothermal Systems. Geothermics, 62: 12–21. https://doi.org/10.1016/j.geothermics.2016.02.003
    Chen, Y., Ma, G. W., Wang, H. D., et al., 2020. Optimizing Heat Mining Strategies in a Fractured Geothermal Reservoir Considering Fracture Deformation Effects. Renewable Energy, 148: 326–337. https://doi.org/10.1016/j.renene.2019.10.037
    Durham, W. B., Bourcier, W. L., Burton, E. A., 2001. Direct Observation of Reactive Flow in a Single Fracture. Water Resources Research, 37(1): 1–12. https://doi.org/10.1029/2000wr900228
    Frash, L. P., Gutierrez, M., Hampton, J., 2014. True-Triaxial Apparatus for Simulation of Hydraulically Fractured Multi-Borehole Hot Dry Rock Reservoirs. International Journal of Rock Mechanics and Mining Sciences, 70: 496–506. https://doi.org/10.1016/j.ijrmms.2014.05.017
    Guo, T. K., Gong, F. C., Wang, X. Z., et al., 2019. Performance of Enhanced Geothermal System (EGS) in Fractured Geothermal Reservoirs with CO2 as Working Fluid. Applied Thermal Engineering, 152: 215–230. https://doi.org/10.1016/j.applthermaleng.2019.02.024
    Iwai, K., 1976. Fundamental Studies of Fluid Flow through a Single Fracture: [Dissertation]. University of California, Berkeley. 208
    Klepikova, M., Méheust, Y., Roques, C., et al., 2021. Heat Transport by Flow through Rough Rock Fractures: A Numerical Investigation. Advances in Water Resources, 156: 104042. https://doi.org/10.1016/j.advwatres.2021.104042
    Liu, J. S., Sheng, J. C., Polak, A., et al., 2006. A Fully-Coupled Hydrological-Mechanical-Chemical Model for Fracture Sealing and Preferential Opening. International Journal of Rock Mechanics and Mining Sciences, 43(1): 23–36. https://doi.org/10.1016/j.ijrmms.2005.04.012
    Ma, Y. Q., Zhang, Y. J., Huang, Y. B., et al., 2019. Experimental Study on Flow and Heat Transfer Characteristics of Water Flowing through a Rock Fracture Induced by Hydraulic Fracturing for an Enhanced Geothermal System. Applied Thermal Engineering, 154: 433–441. https://doi.org/10.1016/j.applthermaleng.2019.03.114
    Moore, D. E., Lockner, D. A., Byerlee, J. D., 1994. Reduction of Permeability in Granite at Elevated Temperatures. Science, 265(5178): 1558–1561. https://doi.org/10.1126/science.265.5178.1558
    Morrow, C. A., Moore, D. E., Lockner, D. A., 2001. Permeability Reduction in Granite under Hydrothermal Conditions. Journal of Geophysical Research: Solid Earth, 106(B12): 30551–30560. https://doi.org/10.1029/2000jb000010
    Olasolo, P., Juárez, M. C., Morales, M. P., et al., 2016. Enhanced Geothermal Systems (EGS): A Review. Renewable and Sustainable Energy Reviews, 56: 133–144. https://doi.org/10.1016/j.rser.2015.11.031
    Parisio, F., Yoshioka, K., 2020. Modeling Fluid Reinjection into an Enhanced Geothermal System. Geophysical Research Letters, 47(19): e2020GL089886. https://doi.org/10.1029/2020gl089886
    Polak, A., Elsworth, D., Yasuhara, H., et al., 2003. Permeability Reduction of a Natural Fracture under Net Dissolution by Hydrothermal Fluids. Geophysical Research Letters, 30(20): 2003GL017575. https://doi.org/10.1029/2003gl017575
    Polak, A., Elsworth, D., Liu, J. S., et al., 2004. Spontaneous Switching of Permeability Changes in a Limestone Fracture with Net Dissolution. Water Resources Research, 40(3): W035502. https://doi.org/10.1029/2003wr002717
    Qiao, L. P., Huang, A. D., Wang, Z. C., et al., 2019. Alteration of Minerals and Temporal Evolution of Solution in Reactive Flow through Granitic Rock Fractures. International Journal of Rock Mechanics and Mining Sciences, 123: 104105. https://doi.org/10.1016/j.ijrmms.2019.104105
    Qu, Z. Q., Zhang, W., Guo, T. K., 2017. Influence of Different Fracture Morphology on Heat Mining Performance of Enhanced Geothermal Systems Based on COMSOL. International Journal of Hydrogen Energy, 42(29): 18263–18278. https://doi.org/10.1016/j.ijhydene.2017.04.168
    Regenauer-Lieb, K., Bunger, A., Chua, H. T., et al., 2015. Deep Geothermal: The 'Moon Landing' Mission in the Unconventional Energy and Minerals Space. Journal of Earth Science, 26(1): 2–10. https://doi.org/10.1007/s12583-015-0515-1
    Richter, A., 2019. Global Geothermal Capacity Reaches 14 900 MW–New Top 10 Ranking of Geothermal Countries.[2022-09-07]. https://www.thinkgeoenergy.com/global-geothermal-capacity-reaches-14900-mw-new-top10-ranking/
    Savage, D., Bateman, K., Richards, H. G., 1992. Granite-Water Interactions in a Flow-through Experimental System with Applications to the Hot Dry Rock Geothermal System at Rosemanowes, Cornwall, U.K. Applied Geochemistry, 7(3): 223–241. https://doi.org/10.1016/0883-2927(92)90039-6
    Shu, B., Zhu, R. J., Zhang, S. H., et al., 2019a. A Qualitative Prediction Method of New Crack-Initiation Direction during Hydraulic Fracturing of Pre-Cracks Based on Hyperbolic Failure Envelope. Applied Energy, 248: 185–195. https://doi.org/10.1016/j.apenergy.2019.04.151
    Shu, B., Zhu, R. J., Tan, J. Q., et al., 2019b. Evolution of Permeability in a Single Granite Fracture at High Temperature. Fuel, 242: 12–22. https://doi.org/10.1016/j.fuel.2019.01.031
    Shu, B., Zhu, R. J., Elsworth, D., et al., 2020. Effect of Temperature and Confining Pressure on the Evolution of Hydraulic and Heat Transfer Properties of Geothermal Fracture in Granite. Applied Energy, 272: 115290. https://doi.org/10.1016/j.apenergy.2020.115290
    Shu, B., Wang, Y. M., Zhu, R. J., et al., 2022. Experimental Study of the Heat Transfer Characteristics of Single Geothermal Fracture at Different Reservoir Temperature and in situ Stress Conditions. Applied Thermal Engineering, 207: 118195. https://doi.org/10.1016/j.applthermaleng.2022.118195
    Taron, J., Elsworth, D., 2009. Thermal-Hydrologic-Mechanical-Chemical Processes in the Evolution of Engineered Geothermal Reservoirs. International Journal of Rock Mechanics and Mining Sciences, 46(5): 855–864. https://doi.org/10.1016/j.ijrmms.2009.01.007
    Witherspoon, P. A., Wang, J. S. Y., Iwai, K., et al., 1980. Validity of Cubic Law for Fluid Flow in a Deformable Rock Fracture. Water Resources Research, 16(6): 1016–1024. https://doi.org/10.1029/wr016i006p01016
    Wu, B. S., Zhang, X., Jeffrey, R. G., et al., 2015. Perturbation Analysis for Predicting the Temperatures of Water Flowing through Multiple Parallel Fractures in a Rock Mass. International Journal of Rock Mechanics and Mining Sciences, 76: 162–173. https://doi.org/10.1016/j.ijrmms.2015.03.013
    Wu, B. S., Zhang, X., Jeffrey, R. G., et al., 2016. A Simplified Model for Heat Extraction by Circulating Fluid through a Closed-Loop Multiple-Fracture Enhanced Geothermal System. Applied Energy, 183: 1664–1681. https://doi.org/10.1016/j.apenergy.2016.09.113
    Wu, B. S., Zhang, G. Q., Zhang, X., et al., 2017. Semi-Analytical Model for a Geothermal System Considering the Effect of Areal Flow between Dipole Wells on Heat Extraction. Energy, 138: 290–305. https://doi.org/10.1016/j.energy.2017.07.043
    Xiao, Z. C., Wang, S., Qi, S. H., et al., 2020. Petrogenesis, Tectonic Evolution and Geothermal Implications of Mesozoic Granites in the Huangshadong Geothermal Field, South China. Journal of Earth Science, 31(1): 141–158. https://doi.org/10.1007/s12583-019-1242-9
    Yasuhara, H., Elsworth, D., Polak, A., 2004. Yasuhara, H, 2004. Evolution of Permeability in a Natural Fracture: Significant Role of Pressure Solution. Journal of Geophysical Research, 109(B3): B03204. https://doi.org/10.1029/2003jb002663
    Yasuhara, H., Kinoshita, N., Ohfuji, H., et al., 2011. Temporal Alteration of Fracture Permeability in Granite under Hydrothermal Conditions and Its Interpretation by Coupled Chemo-Mechanical Model. Applied Geochemistry, 26(12): 2074–2088. https://doi.org/10.1016/j.apgeochem.2011.07.005
    Yasuhara, H., Polak, A., Mitani, Y., et al., 2006. Evolution of Fracture Permeability through Fluid-Rock Reaction under Hydrothermal Conditions. Earth and Planetary Science Letters, 244(1/2): 186–200. https://doi.org/10.1016/j.epsl.2006.01.046
    Zheng, X. H., Duan, C. Y., Xia, B. R., et al., 2019. Hydrogeochemical Modeling of the Shallow Thermal Water Evolution in Yangbajing Geothermal Field, Tibet. Journal of Earth Science, 30(4): 870–878. https://doi.org/10.1007/s12583-016-0918-7
    Zhong, Z., Elsworth, D., Hu, Y. J., 2016. Evolution of Strength and Permeability in Stressed Fractures with Fluid-Rock Interactions. Pure and Applied Geophysics, 173(2): 525–536. https://doi.org/10.1007/s00024-015-1099-5
  • Relative Articles

    [1]Jiangxia Wang, Panpan Xu, Hui Qian, Yongqi Zang, Qiming Wang, Zhiyuan Ma. Genesis of geothermal water in the hinterland of Guanzhong Basin, China: Insight from hydrochemical and isotopic analysis[J]. Journal of Earth Science. doi: 10.1007/s12583-025-0202-9
    [2]Qianyun Wang, Huiming Tang, Pengju An, Kun Fang, Junrong Zhang, Minghao Miao, Qingwen Tan, Lei Huang, Shengming Hu. Insight into the Permeability and Microstructure Evolution Mechanism of the Sliding Zone Soil: A Case Study from the Huangtupo Landslide, Three Gorges Reservoir, China[J]. Journal of Earth Science, 2024, 35(3): 941-954. doi: 10.1007/s12583-023-1828-0
    [3]You Zhou, Songtao Wu, Zhiping Li, Rukai Zhu, Shuyun Xie, Xiufen Zhai, Lei Lei. Investigation of Microscopic Pore Structure and Permeability Prediction in Sand-Conglomerate Reservoirs[J]. Journal of Earth Science, 2021, 32(4): 818-827. doi: 10.1007/s12583-020-1082-7
    [4]Gang Wang, Yong Qin, Jian Shen, Shuyuan Chen, Beibei Han, Xiaoting Zhou. Dynamic-Change Laws of the Porosity and Permeability of Low- to Medium-Rank Coals under Heating and Pressurization Treatments in the Eastern Junggar Basin, China[J]. Journal of Earth Science, 2018, 29(3): 607-615. doi: 10.1007/s12583-017-0908-4
    [5]Xiaobo Zhang, Qinhong Hu. Development of Geothermal Resources in China: A Review[J]. Journal of Earth Science, 2018, 29(2): 452-467. doi: 10.1007/s12583-018-0838-9
    [6]Cheng Feng, Yujiang Shi, Jiahong Li, Liang Chang, Gaoren Li, Zhiqiang Mao. A New Empirical Method for Constructing Capillary Pressure Curves from Conventional Logs in Low-Permeability Sandstones[J]. Journal of Earth Science, 2017, 28(3): 516-522. doi: 10.1007/s12583-016-0913-6
    [7]Jiafa Zhang, Jinlong Wang, Haodong Cui. Causes of the abnormal seepage field in a dam with asphaltic concrete core[J]. Journal of Earth Science, 2016, 27(1): 74-82. doi: 10.1007/s12583-016-0623-6
    [8]Na Zhang, Manchao He, Bo Zhang, Fengchao Qiao, Hailong Sheng, Qinhong Hu. Pore Structure Characteristics and Permeability of Deep Sedimentary Rocks Determined by Mercury Intrusion Porosimetry[J]. Journal of Earth Science, 2016, 27(4): 670-676. doi: 10.1007/s12583-016-0662-z
    [9]Yucang Wang, Shimin Wang, Sheng Xue, Deepak Adhikary. Numerical Modeling of Porous Flow in Fractured Rock and Its Applications in Geothermal Energy Extraction[J]. Journal of Earth Science, 2015, 26(1): 20-27. doi: 10.1007/s12583-015-0507-1
    [10]Klaus Regenauer-Lieb, David A. Yuen, Shihua Qi, Yanxin Wang, Chisheng Liang. Foreword: Toward a Quantitative Understanding of the Frontier in Geothermal Energy[J]. Journal of Earth Science, 2015, 26(1): 1-1. doi: 10.1007/s12583-015-0601-4
    [11]Ali Karrech, Oussama Beltaief, Ruyan Vincec, Thomas Poulet, Klaus Regenauer-Lieb. Coupling of Thermal-Hydraulic-Mechanical Processes for Geothermal Reservoir Modelling[J]. Journal of Earth Science, 2015, 26(1): 47-52. doi: 10.1007/s12583-015-0518-y
    [12]Peter Mora, Yucang Wang, Fernando Alonso-Marroquin. Lattice Solid/Boltzmann Microscopic Model to Simulate Solid/Fluid Systems—A Tool to Study Creation of Fluid Flow Networks for Viable Deep Geothermal Energy[J]. Journal of Earth Science, 2015, 26(1): 11-19. doi: 10.1007/s12583-015-0516-0
    [13]Klaus Regenauer-Lieb, Andrew Bunger, Hui Tong Chua, Arcady Dyskin, Florian Fusseis, Oliver Gaede, Rob Jeffrey, Ali Karrech, Thomas Kohl, Jie Liu, Vladimir Lyakhovsky, Elena Pasternak, Robert Podgorney, Thomas Poulet, Sheik Rahman, Christoph Schrank, Mike Trefry, Manolis Veveakis, Bisheng Wu, David A. Yuen, Florian Wellmann, Xi Zhang. Deep Geothermal: The ‘Moon Landing’ Mission in the Unconventional Energy and Minerals Space[J]. Journal of Earth Science, 2015, 26(1): 2-10. doi: 10.1007/s12583-015-0515-1
    [14]Fuzong Zhou, Xiuhua Zheng. Heat Transfer in Tubing-Casing Annulus during Production Process of Geothermal Systems[J]. Journal of Earth Science, 2015, 26(1): 116-123. doi: 10.1007/s12583-015-0511-5
    [15]Wei Zhou, Shuxian Liang, Desheng Ma, Zhonghua Tang. Statistical Verification of Hydraulic Units in a Heterogeneous Reservoir of the Liaohe Oilfield[J]. Journal of Earth Science, 2014, 25(6): 991-1002. doi: 10.1007/s12583-001-0434-1
    [16]Shufang Wang; Zhonghe Pang; Jiurong Liu; Pei Lin; Sida Liu; Ming Yin. Origin and Evolution Characteristics of Geothermal Water in the Niutuozhen Geothermal Field, North China Plain[J]. Journal of Earth Science, 2013, 24(6). doi: 10.1007/s12583-013-0390-6
    [17]Tingting Zhang, Echuan Yan, Jiangtao Cheng, Wei Xiang. Mechanism of Reservoir Water in the Deformation of Hefeng Landslide[J]. Journal of Earth Science, 2010, 21(6): 870-875. doi: 10.1007/s12583-010-0139-4
    [18]Ge Lin, Meili Peng, Chongbin Zhao, Lu Zhang, Desheng Zhang, Shilin Liu. Numerical Analysis and Simulation Experiment of Lithospheric Thermal Structures in the South China Sea and the Western Pacific[J]. Journal of Earth Science, 2009, 20(1): 85-94. doi: 10.1007/s12583-009-0009-0
    [19]J A Vargas-Guzmán. Effect of Multipoint Heterogeneity on Nonlinear Transformations for Geological Modeling: Porosity-Permeability Relations Revisited[J]. Journal of Earth Science, 2008, 19(1): 85-92.
    [20]Guxian Lü, Rui Ma, Ruixun Liu, Fangzheng Wang, Chusun Guo. Experimental Study of Confining Pressure Initiated by Tectonic Force[J]. Journal of Earth Science, 2004, 15(2): 162-166.
  • Cited by

    Periodical cited type(9)

    1. Yi-Xiang Wang, Xiao-Pei Guo, Ling Xu, et al. How do Notch Shape and Boundary Conditions Affect the Hydro-Mechanical Behavior of Fractured Geomaterials? Findings via the Darcy-Brinkman-Biot Approach. Journal of Earth Science, 2025, 36(1): 351. doi:10.1007/s12583-024-0148-3
    2. Jie Liu, Heping Xie, Cunbao Li, et al. Effect of complex void structures on flow channeling and heterogeneous heat transfer in fractured rocks. Journal of Hydrology, 2024, 639: 131654. doi:10.1016/j.jhydrol.2024.131654
    3. Kun Huang, Haoran Tang, Dongdong Ma, et al. Mechanical properties and constitutive model of artificial frozen sandy soils under true triaxial stress state conditions. Case Studies in Thermal Engineering, 2024, 61: 105026. doi:10.1016/j.csite.2024.105026
    4. Jiajie Yang, J.G. Wang, Wei Liang, et al. Optimal selection of working fluid for enhanced geothermal systems: A comparative analysis of supercritical carbon dioxide and water under various reservoir and extraction conditions. Applied Thermal Engineering, 2024, 246: 122947. doi:10.1016/j.applthermaleng.2024.122947
    5. Junyi Gao, Zhiqiang Zhou. Numerical study on the influence of heat-flow coupling direction on the temperature of double-fractured rock mass. Nuclear Engineering and Technology, 2024. doi:10.1016/j.net.2024.10.047
    6. Shi-Feng Lu, Yi-Xiang Wang, Ling Xu, et al. Hydro-thermal coupled behaviors in free zones and matrix of porous media: insights from a micro-continuum transport approach. Canadian Geotechnical Journal, 2024. doi:10.1139/cgj-2024-0107
    7. Peng Xiao, Hong Tian, Bin Dou, et al. Orthogonal experimental investigation on permeability evolution of unconsolidated sandstones during geothermal fluid reinjection: A case study in the Minghuazhen Formation, Tianjin, China. Energy, 2024, 313: 133626. doi:10.1016/j.energy.2024.133626
    8. Zhen Zhong, Xing Meng, Yunjin Hu, et al. Quantitative assessments on fluid flow through fractures embedded in permeable host rocks: Experiments and simulations. Engineering Geology, 2023, 327: 107341. doi:10.1016/j.enggeo.2023.107341
    9. Qiaoyun Cheng, Sandong Zhou, Bobo Li, et al. Integrating Embedment and Creep Behavior for Multisize Proppant in Shale: Conceptual Model and Validation. SPE Journal, 2023, 28(06): 3389. doi:10.2118/215844-PA

    Other cited types(0)

  • Created with Highcharts 5.0.7Amount of accessChart context menuAbstract Views, HTML Views, PDF Downloads StatisticsAbstract ViewsHTML ViewsPDF Downloads2024-052024-062024-072024-082024-092024-102024-112024-122025-012025-022025-032025-0405101520
    Created with Highcharts 5.0.7Chart context menuAccess Class DistributionFULLTEXT: 41.7 %FULLTEXT: 41.7 %META: 47.2 %META: 47.2 %PDF: 11.1 %PDF: 11.1 %FULLTEXTMETAPDF
    Created with Highcharts 5.0.7Chart context menuAccess Area Distribution其他: 2.8 %其他: 2.8 %China: 35.5 %China: 35.5 %Germany: 0.2 %Germany: 0.2 %India: 2.2 %India: 2.2 %Indonesia: 0.3 %Indonesia: 0.3 %Japan: 1.1 %Japan: 1.1 %Nigeria: 0.2 %Nigeria: 0.2 %Reserved: 3.0 %Reserved: 3.0 %Russian Federation: 6.0 %Russian Federation: 6.0 %Singapore: 0.6 %Singapore: 0.6 %Taiwan, China: 0.5 %Taiwan, China: 0.5 %United Arab Emirates: 0.2 %United Arab Emirates: 0.2 %United Kingdom: 2.9 %United Kingdom: 2.9 %United States: 44.5 %United States: 44.5 %罗奥尔凯埃: 0.2 %罗奥尔凯埃: 0.2 %其他ChinaGermanyIndiaIndonesiaJapanNigeriaReservedRussian FederationSingaporeTaiwan, ChinaUnited Arab EmiratesUnited KingdomUnited States罗奥尔凯埃

Catalog

    通讯作者: 陈斌, bchen63@163.com
    • 1. 

      沈阳化工大学材料科学与工程学院 沈阳 110142

    1. 本站搜索
    2. 百度学术搜索
    3. 万方数据库搜索
    4. CNKI搜索

    Figures(10)  / Tables(2)

    Article Metrics

    Article views(491) PDF downloads(117) Cited by(9)
    Proportional views
    Related

    /

    DownLoad:  Full-Size Img  PowerPoint
    Return
    Return