| Citation: | Zhihua Ouyang, Derek Elsworth, Jianlong Sheng. Theory of Volumetric Moving Dislocation in Poroelastic Halfspace and Characterization of Magma Intrusion Events. Journal of Earth Science, 2005, 16(1): 58-65.

|
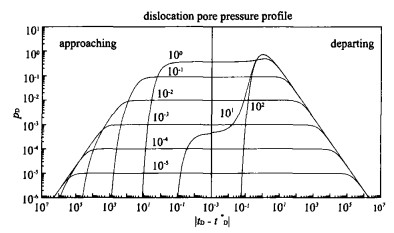
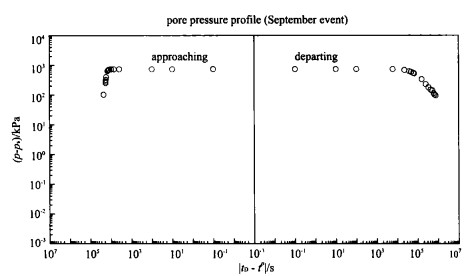
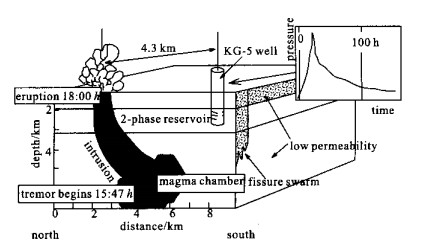
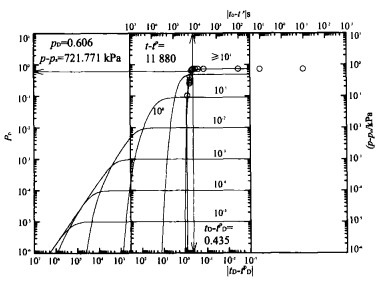
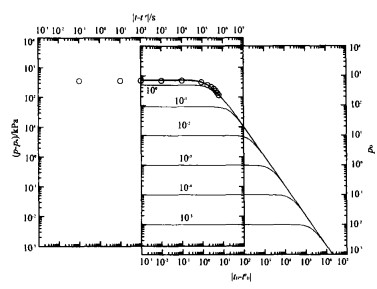
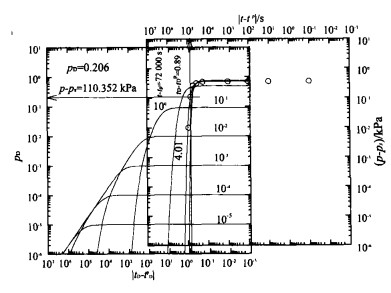
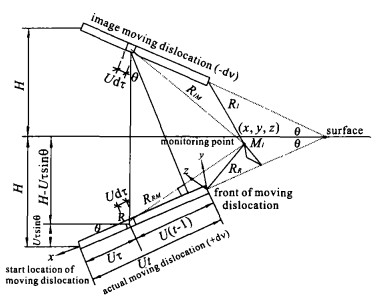
The undrained change in pore fluid pressure that accompanies dike intrusion may be conveniently represented as a moving volumetric dislocation. The concept of a dilation center was developed to represent the field of undrained pressure change in a saturated linear elastic medium. Since instantaneous pore fluid pressures can be developed to a considerable distance from the dislocation, monitoring the rate of pressure generation and subsequent pressure dissipation in a fully coupled manner enables certain characteristics of the resulting dislocation to be defined. The principal focus of this study is the application of dislocation-based methods to analyze the behavior of the fluid pressure response induced by intrusive dislocations in a semi-infinite space, such as dike intrusion, hydraulic fracturing and piezometer insertion. Partially drained pore pressures result from the isothermal introduction of volumetric moving pencil-like dislocations described as analogs to moving point dislocation within a semi-infinite saturated elastic medium. To represent behavior within the halfspace, an image dislocation is positioned under the moving coordinate frame fixed to the front of the primary moving dislocation, to yield an approximate solution for pore pressure for constant fluid pressure conditions. Induced pore pressures are concisely described under a minimum set of dimensionless parameter groupings representing propagation velocity, and relative geometry. Charts defining induced pore fluid pressure at a static measuring point provide a meaningful tool for determining unknown parameters in data reduction. Two intrusive events at Krafla, Iceland are examined using the type curve matching techniques. Predicted parameters agree favorably with field data.

| Bodvarsson, G. S., Benson, S. M., Sigurdsson, O., et al., 1984. The Krafla Geothermal Field, Iceland, 1, Analysis of Well Test Data. Water Resour. Res., 20(11): 1515-1530 doi: 10.1029/WR020i011p01515 |
| Brandsdottir, B., Einarsson, P., 1979. Seismic Activity Associated with the September 1977 Deflation of the Krafla Central Volcano in North-Eastern Iceland. J. Volcanol. and Geotherm. Res., 6: 197-212 doi: 10.1016/0377-0273(79)90001-5 |
| Cleary, M. P., 1977. Fundamental Solutions for a Fluid-Saturated Porous Solid. Int. J. Solids Struct., 13: 785-806 doi: 10.1016/0020-7683(77)90065-8 |
| Elsworth, D., 1992. Pore-Pressure Response due to Penetration through Layered Media. Int. Journal for Num. & Anal. Methods in Geomech., 16: 45-64 |
| Elsworth, D., Day, S. J., 1999. Flank Collapse Triggered by Intrusion: The Canarian and Cape Verde Archipelagoes. J. Volcanol. & Geotherm. Res., 95(1-4): 323-340 |
| Elsworth, D., Voight, B., 1995. Dike Intrusion as a Trigger for Large Earthquakes and the Failure of Volcano Flanks. J. Geophys. Res., 100(B4): 6005-6024 doi: 10.1029/94JB02884 |
| Ewart, J. A., Voight, B., Bjomsson, A., 1990. Dynamics of Krafla Caldera, North Iceland: 1975-1985. In: Ryan, M. P., ed., Magma Transport and Storage. John Wiley, New York. 225-276 |
| Ingraffea, A. R., 1987. Theory of Crack Initiation and Propagation in Rock. In: Atkinson, B. K., ed., Fracture Mechanics of Rock. Academic Press, San Diego. 71-110 |
| Lister, J. R., 1990. Buoyancy Driven Fluid Fracture: The Effects of Material Toughness and of Low Viscosity Precursors. J. Fluid Mechs., 210: 263-280 doi: 10.1017/S0022112090001288 |
| Lister, J. R., Kerr, R. C., 1991. Fluid-Mechanical Models of Crack Propagation and Their Application to Magma-Transport in Dykes. J. Geophys. Res., 96: 10049-10077 doi: 10.1029/91JB00600 |
| Muller, J. R., Ito, G., Martel, S. J., 2001. Effects of Volcano Loading on Dike Propagation in an Elastic Half-Space. J. Geophys. Res., 106(B6): 11101-11113 doi: 10.1029/2000JB900461 |
| Parsons, T., Sleep, N. H., Thompson, G. A., 1992. Host Rock Rheology Controls on the Emplacement of a Tabular Intrusion: Implications for Underplating of Extending Crust. Tectonics, 11: 1348-1356 doi: 10.1029/92TC01105 |
| Rice, J. R., Cleary, M. P., 1976. Some Basic Stress Diffusion Solutions for Fluid-Saturated Elastic Porous Media with Compressible Constituents. Rev. Geophys., 14(2): 227-241 doi: 10.1029/RG014i002p00227 |
| Rubin, A. M., 1993. Dikes vs. Diapirs in Viscoelastic Rock. Earth Planet. Sci. Lett., 119: 641-659 doi: 10.1016/0012-821X(93)90069-L |
| Ryan, M. P., 1987. Neutral Buoyancy and the Mechanical Evolution of Magmatic Systems. In: Mysen, B. O., ed., Magmatic Processes: Physiochemical Principles. Geochem. Soc. Spec. Publ., 1: 259-287 |
| Saemundsson, K., 1991. Jardfraedi Kroflukerfisins in Nattura Myvatns. Hid Islenska Natturufaedifelag, Reykjavik. 24-95 |
| Sigurdsson, O., 1982. Analysis of Pressure Pulses Resulting from Volcanic Activity in the Vicinity of a Well: [Dissertation]. University of Oklahoma, Noman, Oklahoma, USA. 75 |
| Skempton, A. W., 1954. The Pore-Pressure Coefficients A and B. Geotechnique, 4: 143-147 doi: 10.1680/geot.1954.4.4.143 |
| Watanabe, T., Koyaguchi, T., Seno, T., 1999. Tectonic Stress Controls on Ascent and Emplacement of Magmas. J. Volc. and Geophys. Res., 91: 65-78 |
Figures(10)
Copyright © 2013-2020 Journal of Earth Science 鄂ICP备15021562号-2
Tel: +86-27-67885075 Fax: +86-27-67885075 E-mail: xbb@cug.edu.cn
Address: Editorial Office of Journal, China University of Geosciences, Yujiashan, Wuhan, Hubei 430074, P. R. China
Supported by:
Beijing Renhe Information Technology Co. Ltd
E-mail:
info@rhhz.net


 DownLoad: