![]() |
Citation: | Talm Jabbar Mushtak. Desertifjcation Risk Monitoring for North Shaanxi Province, China, Using Normalized Difference Vegetation Index(NDVI). Journal of Earth Science, 2002, 13(1): 58-66, 94. |
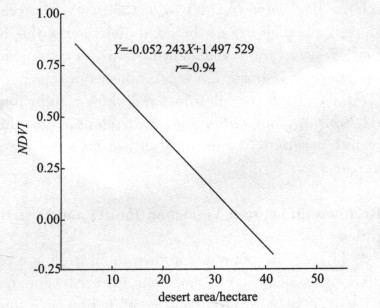
In this study, the remote sensing is applied to the examination of the relationship between desertification and normalized difference vegetation index (
Arid and semi-arid areas occupy one third of the total world area. This vast region is rich in natural resources. In recent years, desertification has become a world-wide phenomenon, due to vegetation-cover activities. China also suffers from this problem. Desertification is especially severe in the northeastern part of the arid and semi-arid region of the country (UNEP.1992).
Desertification refers to the land degradation in arid.semi-arid and dry sub-humid areas resulting from various factors such as climatic variations and human activities(UNCED, 1994). As in the world, desertification is one of the most severe environmental problems in China.occupying a large area, deteriorating the living habitats and threatening the development of China. The desertified land in China is about 2.6×10⁶ km2, nearly 27.3% of the total national land. In addition, approximately 71% of the desertified land is distributed in the North. Northwest and Northeast China. It is concluded from our survey that the desertificatjon is threatening about 1.04×10⁷ km2 arable land, 1×10⁸ km2 grassland, and about 4.2×10⁷ people living in this area(Zhu and Chen, 1994). About 50% of the energy and 60 % of the raw materials needed in east China are from North and Northwest China. Because of this severity in desertification, Chinese researchers have initiated researches in desert and desertification since the end of 1950s.
China, one of the countries that occupy the largest area of desert and desertified land in the world, suffers heavily from various desert-related problems. Expansion of desert and desertified land destroys viilages, buries railways and roads and engulfs cropland and grassland, as well as threatens the people and Jivestock there. That is why the residents in the North, Nortbwest and Northeast China started cornbating desertification long before the desert and desertification research. For example, as early as in 1940s.farmers in Jinbian and Yulin in north Shaanxi Province utilized sandy land by leveling off sand dunes with water flush and collected sediment to make cropland. Every year, about 149 km2 of cuhirated Land in China is lOSt tO the desertification (Planning and Surveying Academy of National Forestry Bureau, 1996).
Arid, semi-arid and dry sub-humid areas refer to those regions where the ratio of annual precipitation to evapotranspiration lies between 0.05 and 0.65 (UNCED.1994). The ratio is called the moisture index, indicating the classification of climate types for desertmcation.
Based on this moisture index.the total area of 1.427X 10⁶ km2 arid.1.139×106 km2 semi-arid and 0.751×10⁶ km2 dry sub-humid areas where the occurrence of desertification is possible reaches approximately 3.317×10⁶ km2, occupying 34.6%of the total territorial area of China(Table 1). These arid, semi-arid and dry sub-humid areas in China are widely distributed in most parts or some parts of 471 counties of 4 autonomous regions(Xinjiang, Inner Mongolia, Tibet and Ningxia), 12 provinces(Qinghai, Gansu, Hebei. Shaanxi, Shanxi, Shandong, Liaoning, Sichuan, Yunnan, Jilin, Hainan, Henan) and 2 cities(Beijing and Tianjin). Inside these geographic locations.the effect of the actual desertificarion area on the national Land area(i.e., the total area of desertification affected land are of China)occurs within 2.622×10⁶ km2(CCICCD, 1997), occupying 79.0%of the geographic locations mentioned above, or 27.3%of the total territory of China.
![]() |
The desert and desertification were monitored in all the Northwest, North and Northeast China in 1950s and 1970s.respectively(Zhu and Chen, 1994).which are based on most of the desert and desertifieation maps in China. Researehers from IDR undertook the mapping work in 1980s and 1990s for the assessment of desertification in North China. But only some typical places were fully surveyed(Zhu and Chen, 1994). With the development and wide applications of remote sensing(RS), geographical information system(GIS) and global positioning sys tem(GPS).it is possible to monitor the desertifieation at the time needed and at different scales. The early-warning system meets our urgent need to provide immediate information on desertifieation-related hazards and provide basic data on the changes in land resources in North, Northwest and Northeast China for decision-making. Monitoring of desertification needs an operational index system for assessment. In the past 40 years, researchers have set up a system of semi-quantitative indexes including dune number of unit area, vegetation coverage and average height of dunes(Wang et al., 1999: Zhu and Chen, 1994). However, no quantitative indexes are present in the changes of soil and land productivity, and very important factors for desertification assessment(Wang et al., 1999).
Vegetation indexes are algorithms for the simplification of data ranging from multiple reflectance bands to a single value related to physical vegetation parameters(such as biomass.productivity, leaf area index, or percent vegetation ground cover)(Tucker, 1979). These vegetation indexes are based on the well-documented unique spectrum of healthy green vegetation over the visible to infrared waveLengths.
NDVI, the traditional vegetation index used by researchers for extracting vegetation abundance from remote sensing data(Tucker, 1979), divides the difference between the reflectance values in the visibie red and near-infrared wavelengths over the overall reflectance in those wavelengths for the estimation of green vegetation abundance(Tucker, 1979). In assence.the algorithm isolates the dramatic increase in reflectance over the visible red to near infrared wavelengths, and normalizes it by dividing the overall brightness of each pixel in those wavelengths. Speeifically. NDVI is expressed as(Table 2)
|
![]() |
where the values in either band have been converted from the raw DN values to the reflectance of solar electromagnetic radiation. The result of this algorithm is a single band data set, ranging from-1 to 1, corresponding to photosynthetic vegetation abundance,
NDVI, widely used to measure vegetation cover on a broad-scale worldwide, has been incorporated into many large-scale forest and crop assessment studies(Bausch and Walter, 1993; Hatfield et al., 1985; Asrar et al., 1984), to provide weekly vegetation maps, to monitor crops over large regions, to monitor vegetation change in much of the tropics, and to estimate biomass. For examples, Shih(1994) used it to monitor agrieuhural areas in the Everglades, Dejong(1994)used it in a model of soil erosion, Wood and Lakshmi(1993)used NDVI to help monitor water and energy fluxes for a climate model. and Dymond et al.(1992)used NDVI to estimate rangeland degradation.
Despite of this wide use, this method also has its well-documented accuracy limitations. The limitalions jn vegetation indexes emanate from the fact that the relationships between vegetation abundance and electromagnetic reflectance values in complex forest structures(and areas with high vegetation abundance)are many times nonlinear, whereas vegetation indexes are simple linear algorithms. Therefore, aging forests may show a decrease in NDVI, while actual biomass increases.because of the increased mutual shadowing in mature stands. Consequently, once the vegetation indexes reach a threshold level.they are no longer accurately correlated to actual vegetal tion abundance(Bausch and Walter, 1993; Hatfield et al., 1985; Asrar et al., 1984).
Studies have also shown that the background soll color affects NDVI. especially in heterogeneous scenes(Bausch and Walter, 1993). Because the difference between the bands is divided by the overall brightness of the two bands, the extreme variations in background soll brightness can cause NDVI values to be artificially high or low. In theory.pixels with dark soll backgrounds such as the basaltic soil patches in the maiority of the northern scene, have a lower overall brightness. Therefore.NDVI values would be artificially higher in these areas, as the difference between the visible and the near infrared would be divided by less. Similarly, bright soll backgrounds would raise the overall brightness levels and, therefore, the vegetation values derived via NDVI would be artificially lower than those in the areas with similar abundance that have dark soll backgrounds. This background soll effect is additionally complicated by the multiple scattering effects between vegetation and soll(Bausch and Walter, 1993; Asrar et al., 1984).
While NDVI correlates reasonably well in medium to low vegetation abundance with various ecological parameters(such as leaf area index or green leaf biomass)(Bausch and walter, 1993; Dymond et al. 1992; Hatfield et al., 1985; Asrar et al., 1984), the literature suggests that in certain environments speeifie types of changes in vegetation may not be accurately depicted with NDVI(Shih 1994; Asrar et al., 1984).
The detection of vegetation change using remote sensing data is dominated by the vegetation indices (Shih, 1994).
Images were provided by the Beijing Remote Sensing Center, on CD Rom. Both images(1999 and 1987)import in ER mapper software,
Because the two images were acquired from different locations via satellite.the data quality varied significantly. Data quality can be checked by the application of strong stretches to the data and the eamination of known material spectra as well as the visual examination of the image for missing data lines or rows. Surprisingly, the data acquired from Yulin have the best quality, while the data acquired from Jinbian were missing over a large area, and there are scattered lines throughout the scene. It is very important to determine these early data quality complications so that they could be accounted and corrected in the whole image processing procedure.
nd control points and RMS By using rectification algorithm image and/or vector, the column and row coordinates of the image can be fit to the Geodetic Datum WGS84 and map projection NUTM49 coordinate system built in to the vector using Iinear method, and the resampling method chosen was the nearest neighbour which preserved original reflectance value. When using the control points for rectifying image, care must be taken to ensure an adequate number of points which should be spread throughout the image(Dejong, 1994: Bausch and Walter, 1993; Dymond et al.1992).
Fifty ground control points were chosen on the images, primarily on clearly visible river(Figs. 1, 2). The points were spread quite evenly throughout the image, allowing for good contr01. Image software was allowed for easy zooming to assist in point selection. The points were registered in the header file of the image for later rectification. Once all ground control points were compiled, an error checking was used to gauge the efficiency of the points used. The RMS errors for linear method of rectification were examined with varying accuracies, all approximately 9.5 m in displacement error.
The term mosaic refers to the assemblage of two or more overlapping images to create a continuous representation of the area covered by the image(amosaic). The process of creating Yulin and Jinhian image mosaics is presented in ER mapper, once the images are rectified to the same datum WGS84 and map projection NUTM49(Fig. 3). Two mosaic methods were attempted: the feather and the overlay. The feather option in ER mapper produces an average for the pixels in both images to remove the line between the images. The output from this method is not adopted, due to the alteration of pixel values in both images. Instead of using the feather option, the image data matching on the border was performed with the overlay option and the histogram matching.
Adjusting image contrast(often called contrast stretching)is the most fundamental and frequentlyused enhancement operation in digital image processing. Yulin and Jinbian image spatial filtering is a common operation applied to raster image data to anhance or to improve visual interDretation and mathematical function to each pixel in the dataset by formula processing(Fig. 4). Histogram statistics for the Yulin and Jinbian images along with the final mosaic are given by bands in Table 3. The pixel value represents brightness detected at various bands of the spectrum from zero to 255. Since the vegetation detection methods offers indices, no investigation of principal component analysis or edge detection was performed during this research.
![]() |
he methods for NDVI require data to be converted from DN values to reflectance, so that the scattering must be removed and divided by solar illumination. Scattering effects are determined by finding the darkest pixel in the scene, usually a deep reservoir.and by determining the difference between the DN value of the infrared band and the visible red band. Because the water does not radiate much in wavelengths over the visible to infrared spectrum, the light ray detected by the satellite in these bands is generally due to path radiance, instead of to the radiation from the water itsetf. However, the atmospheric scattering is only significant in the lower wavelengths, primarily the visible bands. Therefore, the scattering over the wavelengths in visible bands is far greater than that in infrared bands. In this study, because the data was already spectrally aligned, an estimate of the scattered light ray was equally applied to all the scenes. The NDVI algorithm was operated and a new dataset was generated. The algorithm used was
|
The final mosaic, masked to filter out all of the areas that did not have a vegetation response from the normalized difference vegetation lndex(NDVI)formula, includes the desertified area and all the nonpermeable areas such as buildings.roods, and water with no vegetation response. Masking was performed by detecting all the NDVI responses less than zero and assigning the pixels a null value. This masked image was delineated to remove the potential pixels with desert signature.
Unsupervised and supervised methods of classification were tested to delineate the vegetation. Because the assemblages are mixed in the class to be mapped, they will generally be referred to as green vegetation. Supervised methods proved superior and are covered below. Density map were created by correlating several test vegetation indexes to ground data from published papers about north Shaanxi Province.
egetation properties can be delineated on images to gather the spectral responses for similar areas in the rest of the image. By gaining a prior knowledge of an area on the image to be classified, responses across all the bands were matched using supervised methods to produce desirable output Classes.
In order to understand the types of land-cover changes and environments that cause differences between the vegetation change results of NDVI and IPVI, it is helpful to firstly examine the initial vegetation abundance values generated by the two methods. The scatter grams in Fig. 5 show the correlation between the digital numbers in two dataset band. The values for the red band are plotted on the X axis and those for the near infrared on the Y axis. These two digital numbers are used to Ioeate each pixeJ in the two-dimensional measurement space of the graph. Each point on the graph represents a pixel in the scene. If the two methods produce the relatively equal amounts of vegetation for a pixel, the point should fall along a best-fitable line.showing a linear relationship between the two methods. As the graph shows, the majority of the points falls along this line for low vegetation abundance, however, the graph becomes less linear as vegetation values increas. Overall, the scatter plot does not show a tight linear relationship, but rather a good correlation at medium to iow veRetation abundance with a higher-value divergence.
Imagery is commonly known to discriminate vegetation by using a red and near infrared band ratio (Tucker, 1979). This band combination was found to be 7%to 14%better for detection of vegetation than the green red hand combination methods previously used for vegetation detection. The principle component that the band combinations detect is green leaf biomass or green leaf area. The three vegetation indices covered in Table 2, the NDVI, IPVI and MSAVI2 were tested for desert area.
The most common form of vegetation index is the normalized difference vegetation index(NDVI) (Tucker.1979). The NDVI is basically the difference between the red and near infrared band combination divided by the sum of the red and near infrared band combination or
|
This index has a range of -1 to 1.
This index is computationally faster than the NDVI and scales data in percentages. This index eliminates negative numbers and output data range from zero to one(Crippen, 1990). This index is practically the same as NDVI and this efficient method may be preferred with large data sets or slow cornputers. The IPⅥis calculated as
|
This index has a range from 0 to 1.
This index iS used without a soll line(Qi et al., 1994). Problems in software functionality were encountered with soil lines.so that this method without soil lines was preferred.
|
This index has a range from -1 to 1.
The formulae were applied to the pixel values in the mosaic image to create new output pixel values (Fig. 6). The vegetation index chosen for final deterruination of Cover density was the infrared percentage vegetation index(NDVI), with the highest corretation with image data collected(Table 4). The resul ting image, when regressed, is shown in Fig. 6. The modified soil that adjusted vegetation index two was not considered due to the lower correlation with im age data.
![]() |
A strong negative eorre lation exists between NDVI and desert area(Fig. 7). However, the relationship between NDVI and desert iS complex.as indicated by the vegetation response. In this study, the distribution of desertification varied in both areas! Yulin and Jinbian, and in some area, their geographic distribution was not statistically reDresentative. For example, for most areas in Jinbian(the northwestern Shaanxi Province).there iS no more information about desertification for the comparison in our study. The primary classes of areas using different methods correspond to areas with low vegetation abundance (specifically undisturbed, continuous vegetation, highlighteaed in red and desert highlightened in green in Fig. 8). Because this study is concerned with vegetation change, difference in cover vegetation values is much more important than that in desert values.
The red areas seem to be a darker vegetation in the original image(Fig. 9). Most likely, these darker areas of vegetation.forests of complex structure are shadowed due to canopy layers, topographical features or the sun angle. This rounding-off of the graph corresponds to what would be expected from the saturation problem discussed earlier, which iS associated with NDVI results(Fig. 10). This result agrees with those of aret and Guyot(1991);Hatfield et al.(1985). It is a well-known phenomenon that as the biomass, a leaf area index.reaches fl threshold level.fPⅥalso reaches its saturation at high Ievels of vegetation abundance, however, IPVI is employed to accurately detect the vegetation cover at a much higher levels of abundance than NDVI(Smith et al., 1990a, b).
Generally speaking, NDVI has a far greater sensitivity tO subtle differences in high vegetation abundance than does IPVI, which can be lllustrated through fl coarse but more detailed dissection of the scatter plot of IPVI, NDVI. The dark color in Fig. 6 corresponds to the land covers of the pixels in the images in Fig. 7(with Fig. 9 for reference). These dark colors show small, equal intervals of vegetation abundance according to NDVI and IPVI. What is the most noticeable from these plots is that IPVI has more different classes of vegetation abundance at low values of vegetation than does NDVI, indicating a greater potential to detect subtle change in desert.
While it is interesting to note the differences between the initial vegetation abundance results of NDVI and IPVI.the importance is the implications of these discrepancies for vegetation change detection. Based on the nature of the differences in vegetation abundance as calculated by IPVI and NDVI.we can speculate on the types of land cover changes that may result in the differences between vegetation change calculations. For example.Figure 11 shows the possible implications of saturation and the background soil effects on vegetation change analysis. As the dingram indicates, the saturation problem associated with NDVI should cause the values of vegetation change calculated by NDVI to be Iower than those calculated bv IPVI in areas of low vegetation abundance or non vegetation. Subtle changes in vegetation cover, such as small degrees of degradation or drought effects, may not be detected by NDVI, while they can be detected by IPVI. Additionally, Figure 11 shows the implications of soil background color effects on vegetation change calculations. If highly vegetated areas are deforested to expose the background soil levels.the change detected by NDVT should vary with the overall soil brightness.
This study shows that NDVI is a good indicator to interpret desert area. Whilst previous studies in China have highlightened the NDVI response to the analysis of forest structures, this study shows a strong negative relationship between NDVI and desertjfication.due to the influence of arid and semiarid zones on the predominantly north Shaanxi Province/desert area. Furthermore, NDVI is a good indicator of drought risk or desertification risk, and need to be related to other socio economic and bin-physical data in order to be more useful. The precision of the growing season, for each season, for each specific climatic zone, on the base of 10 cal desertification. The methodology adopted here has demonstrated the importance of remote sensing as a tool for integratign various sources of data. Visual analysis of graphed data facilitated the data processing and analysis, as was demonstrated by the shifting of the NDVI method in order to explore the best correlation of the dataset. The plotting of the image data with the correlation coefficient is another example where visualization of data helped the low lighting that the larger desert area with the stronger correlation. For any system for monitoring environmental change, the objectives need to be specific. In particular.it should he clear whether the aim is to monitor environmental change across time or not. An effective desertification warning system using NDVI should take advantage of remote sensing sources in using real time data in order to facilitate timely decision making. If this were to be done, NDVI can be a valuable first-cut indicator, and provide a key input cost-effective, reliable and timely deseftification monitoring systems.
Asrar G, Fuchs M, Kanemasu E T, et al, 1984. Estimating Mushtak Talib Jabbar Absorbed Photosynthetic Radiation and Leaf Area Index from Spectral Reflectance in Wheat. Agron J. 76: 300-306 doi: 10.2134/agronj1984.00021962007600020029x |
Baret F, Guyot G. 1991. Potentials and Limits of Vegelation Indices for LAI and APAR Assessment. Remote Sensing of the Environment. 35: 161-173 doi: 10.1016/0034-4257(91)90009-U |
Bausch W C, 1993. Soil Background Effects on ReflectanceBased Crop Coefficients for Corn(1991). Remote Sensing of the Environment. 46: 213-222 doi: 10.1016/0034-4257(93)90096-G |
CCICCD, 1997. China Country Paper to Combat Desertifieation. Beijing: China Forestry Publishing House. 18-31 |
Crippen R E, 1990. Calculating the Vegetation Index Faster. Remote Sensing of the Environment, 34: 71-73 doi: 10.1016/0034-4257(90)90085-Z |
Dejong S M, 1994. Derivation of Vegetative Variables from a Landsat TM Image for Modeling Soil Erosion. Earth Surface Processes and Landforms, 19(2): 165-178 doi: 10.1002/esp.3290190207 |
Dymond J R, Stephens P R, Newsome P F, el al, 1992. Pereentage Vegetation Cover of a Degrading Rangeland from Spot. International Journal of Remote Sensing, 13(11): 1999-2007 doi: 10.1080/01431169208904248 |
Gaston G G, Bradley P M, Vinson T S, 1997. Forest Ecosys tem Modeling in the Russian Far East Using Vegetation and Land-Cover Regions Identified by Classification of GVI. Photogrammetric Engineering and Remote Sensing, 63(1): 51-58 |
Hatfield J L, Kanemasu E T, Asrar G, et al, 1985. Leaf Area Estimates from Spectral Measurements over Various Planting Dates of Wheat. International Journal of Remote Sensing, 6: 167-175 doi: 10.1080/01431168508948432 |
Huemmrieh K F, Goward S N, 1992. Spectral Vegetation Indexes and the Remote Sensing of Biophysical Parametres. International Geoscience and Remote Sensing Symposium 1992, 2: 1017-1019 |
Jordan C F, 1969. Derivation of Leaf Atea Index from Quality of Light on the Forest Floor. Ecology. 50: 663-666 doi: 10.2307/1936256 |
Major DJ, Baret F, Guyot G. 1990. A Ratio Vegetation Index Adjusted for Soil Brightness. International Journal of Remote Sensing, 11(2): 720-727 |
Planning and Surveying Academy of National Forestry Bureaut, 1996. Surveying on the Desert. Gohi and Desertified Land in China. Beijing |
Qi J, Chehbouni A, Huete A R, et al. 1994. A Modified Soll Adjusted Vegetation Index. Remote Sensing of Environment, 48: 119-126 doi: 10.1016/0034-4257(94)90134-1 |
Rouse J W, Haas R H, Sehell J A, et al. 1973. Monitoring Vegetation Systems in the Grear Plains with ETRS. ThirdETRS Symposium, NASA SP353. Washington, 1: 309-317 |
Shih S F, 1994. NOAA Polar-Orbiting Satellite HRPT Data and GIS in Vegetation Index Estimation for the Everglades Agricultural Area. Soil and Crop Science Society of Florida Proceedings, 53: 19-24 |
Smith M O, Ustin S L, Adams J B, et al, 1990a. Vegetation in Deserts: I. A Regional Measure of Abundance from Multispectral Images Remote Sensing of the Environmerit. 31: 1-26 |
Smith M O, Ustin S L, Adams J B, et al, 1990b. Vegetation in Deserts: Ⅱ. Environmental Influences on Regional Abundance. Remote Sensing of the Environment, 31: 27-52 |
Tucker C J. 1979. Red and Photographic Infrared Linear Corn hinations for Monitoring Vegetation. Remote Sensing of the Environment. 8: 127-150 doi: 10.1016/0034-4257(79)90013-0 |
UNCED. 1994. United Nations Convention to Combat Desertifieation in Those Countries Experiencing Serious Droughl and/or Desertification. Particularly in Atrica |
UNEP. 1992. Status of Desertifieation and Implementation of the United Nations Plan of Action to Combat Desertification |
Wang T. Zhao H. Xiao H. 1999. Advances in Desertilication Researeh of China. J of Desert Research, 19(4): 299-311 |
Wood E F, Lakshmi V, 1993. Scaling Water and Energy Fluxes in Climate Systems-3 Land Atmospheric Modeling Experiments. Journal of Climate, 6(5): 839-857 |
Zhu Z, Chen G, 1994. Sandy Desertification in China. Beijing: Scienee Press |
![]() |
![]() |
![]() |
![]() |