![]() |
Citation: | Min Wei, Yonghui Yao, Xueping Wang. Integrated Assessment of Mineral Resources and Environment in Mid-South of Shandong Province. Journal of Earth Science, 2000, 11(2): 168-170. |
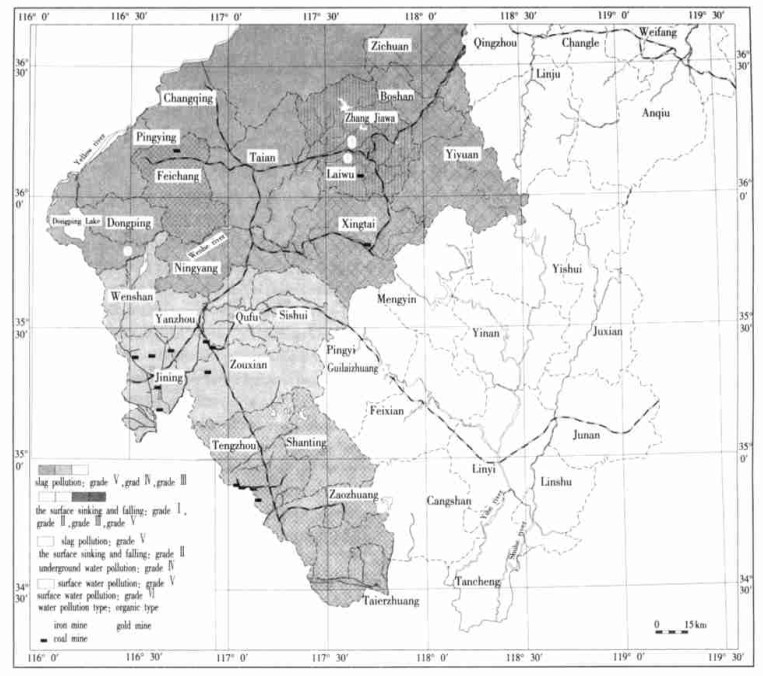
On the bases of the field survey and a large number of testing data, we process the qualitative and quantitative assessment of the mine environment in the mid south of Shandong Province using the following grade Ⅰ factors: the surface subsidence in mining area, the three wastes of mine industries, the pollution sources, the surface water pollution, the underground water pollution and the air pollution. By means of emitting factor judgment and water quality indexes, we locate pollution sources, main pollutants, pollution type and pollution grade in the study area. Using the MAPGIS, we draw a zonality map of the mine environment. This paper attempts to offer a concrete example, including valuable assessment method, data and conclusion, for the assessment of mine environment from the integrated assessment of mineral resources and mine environment. This research is oriented towards the sustainable development and the ecological environment optimization.
In the mid-south Shandong Province, the distribution of mineral resources has zonality: (1) In the west-south part of the district (including Jining, Zaozhuang), are mainly enriched energy mineral resources such as coal, gas and oil. (2) The west-north part (including Zibo, Jinan, Taian and Laiwu) is abundant in iron, coal, auxiliary materials. (3) The east-south part (including Weifang and Linyi) is rich in gold and nonmetallic materials
We choose Laiwu and Yinan as examples to study and illustrate the mining environment in the mid south Shandong Province. Using qualitative and quantitative analyses, we chose the following index system for our present study.
(1) The indexes of natural environment include: (a) geological environment indexes such as topography, landform, tectonics, water system and hydrogeology, rock and soil engineering; (b)three wastes of mining industry and the surface subsidence caused by mining; (c) indexes of watPr condition including surface water, underground wster index, and the assessment of pollution sources; (d) index of air condition; (e) ecological environment index.
(2) The indexes of social and economic condition, including output value, profit, environmental-protection benefit, and utilization ratio of the three wastes.
In this paper, the emitting factor judgment was used to assess the sources of waste water. The water quality indexes were used to evaluate water and air condition. According to these indexes, the grade of environment pollution was divided, as shown in Tables 1 and 2.
![]() |
![]() |
On the bases of our analysis and study, we draw the following conclusions about the environment condition of the study areas. First, the excessive extraction of the underground water and the backward mining technology caused the surface subsidence. Second, the slag took up a large amount of arable land and polluted the environment. According to the statistic results of eight typical mines, the quantity of the three wastes per ten-thousand production value was eighty tons. Third, the surface water and the underground water around the mining area are polluted. In Yi'nan, water pollution is of the organic type, so the mining industry is not the main pollution sources. But study on the waste water in the gold mining industry indicates that the main pollutants in the waste water are SCN, sulfide Cr6+ and suspended solid, suggesting that the pollution of gold mine to the environment be related to the corresponding technological process. In Laiwu district, mining is the main pollution source, and the main pollutants are COD, suspended solid copper, Cr6+ and sulfide.
Fourth, the ecological environment around the mining area is seriously disturbed, resulting in the destruction of natural habitation, arable land and woodland
The analysis mentioned above shows that the main geological hazards are the surface subsidence, three waste pollution of mining industries and the ecological disturbance. In the process of environment assessment, the author suggest that the following factors should be used to delineate the environment pollution zones: the quantity of the slag, the surface subsidence grade, the pollution of water and air and the ecological condition. This paper only chooses the first two factors to delineate the pollution zones and uses GIS to draw the environment map (shown in Fig. 1). The delineation standards are shown in Table 2. The statistical results of the slag and the area of the surface subsidence are shown in Table 3.
![]() |
The environmental pollution map clearly shows that the zonation of the environmental pollution coincided with the zonality resources distribution.
(a) In the west-north part, the slag pollution is the highest: grade Ⅴ. The surface subsidence is grade Ⅱ. According to our studies, we conclude that, in this district, underground mining can easily cause surface subsidence. When ores were mined out of ground, the upper layers and surface have lost their support, then surface subsidence occurred. Moreover, the exploitation of energy minerals (such as coal), iron and auxiliary materials produced a large amount of waste residue and slag.
(b) In the west-south part, the slag pollution is grade Ⅳ, and the surface subsidence is the highest grade Ⅴ. The reason is that this area is a major coal exploration zone. As in the west-north part, a large amount of coal was extracted from its host layers, the upper layers and the surface subs-idence due to the loss of their support, resulting in lots of gangue.
(c) In the east-south part, both the slag and the surface subsidence are grade Ⅲ. Although the exposed mining of building materials and nonmetallic minerals produced only a little of slag, the ecological environment in this region is violently disturbed
(d) In coal, iron and gold mining area, the grades of both the slag and the surface subsidence were high, suggesting that the mining methods and the characteristics of mineral resources be closely related to the grade and the type of mining pollution. Waste capacity per 10000-yuan production value in the mining production is 80 tons in the mid-south of Shandong Province
(e) The water pollution around the mining area is serious. Most mining industries are main pollution sources. Liquid waste capacity per 10000-yuan production value is 600 tons in the mid-south of Shandong Province
(f) In order to realize the sustainable development of economy and environment, the popularization of non-waste technological system and the development of green mining industry are both necessary
Chen S, 1998. The Influence Assessment of Environment. Wuhan: China University of Geosciences Press |
Li G, 1989. The Quality Assessment of Environment. Beijing: Environmental Science of China Publishing House. 199-214 |
Niu J, Tian J, 1996. The Index System and Method of the Influence Assessment of Environment Caused by Exploiting Mineral Resources. The Information of Geological Science, 15(3): 67-70 |
Survey Department of Geological Environment of Shandong Province, The Survey and Assessment Report of Geological Disaster in Shandong Province, 1955. 11 |
![]() |
![]() |
![]() |