| Citation: | Wei Shen. Dynamic Model of Mineralization Enrichment and Its Applications. Journal of Earth Science, 2000, 11(2): 191-193.

|
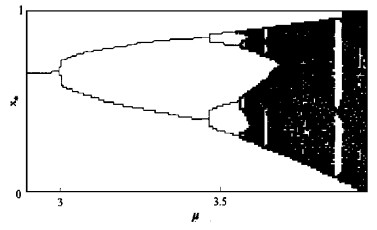
This paper studies the chaos dynamic mechanism of the migration, enrichment and mineralization of elements in the crust. The research shows that the interaction of the nonlinear process in the geological environment is an essential factor for the uneven distribution of elements and the mineralization in the crust, determining the element contents and the fractal structure of the distribution of the large and small sized mineral deposits. The logistic map is a better mathematical model describing the behavior of the chaos dynamic. The parameter μ, i.e., the mineralizing potential, is employed to divide the region into non mineralization region or mineralization region. The value of the parameter μ in model (3) with true data (in Xinjiang Au tomatio region, China) is obtained with the statistical method. The forecasting results are generally in accordance with those obtained with other methods, for example, with the characteristic analysis.

| Barton C C, Scholz C H, 1991. The Fractal Nature of Hydrocarbon Deposits, 2. Spatial Distribution. AAPG Bulletin, 75(3): 539. |
| Bolviken B, Stokke P K, Feder J, et al, 1992. The Fractal Nature of Geochemical Landscapes. Geochem Explo, 43(2): 91-109. doi: 10.1016/0375-6742(92)90001-O |
| Carlson C A, 1991. Spatial Distribution of Ore Deposits. Geology, 19(2): 111-114. doi: 10.1130/0091-7613(1991)019<0111:SDOOD>2.3.CO;2 |
| Cheng Q, 1995. The Perimeter-Area Fractal Model and Its Application to Geology. Math Geoology, 27(2): 69-82. |
| Guan G, 1993. Chaos and Mineralization. Journal of Northeast University of Technology, 14(5): 429-432. |
| Ma T, Zhu X, Li C, 1998. Chaos Dynamic Behaviour of Mineralization. Acta Geologica Sinica, 72(4): 392-398. |
| Mandelbrot B B, 1983. The Fractal Geometry of Nature. New York: W H Freeman and Company. 468. |
| Scholz C H, Barton C C, 1991. The Fractal Nature of Hydrocarbon Deposits, 1. Size Distribution. AAPG Bulletin, 75(3): 668. |
| Shen W, Wang S, 1999. The Study of Quantitative Prediction for Large-Sized and Super Large-Sized Mineral Deposit. Earth Science—Journal of China University of Geosciences, 24(5): 513-515. |
| Sheng B, Sheng Y, 1995. Fractal Characters of Gold Distribution in One Ore Deposit, Xinjiang, China, and Their Significance in China. (Series B), 38(1): 124-128. |
| Turcotte D L, 1986. A Fractals Approach to Relationship between Ore Grade and Tonnage. Econ Geol, 81(6): 1528-1532. doi: 10.2113/gsecongeo.81.6.1528 |
| Turcotte D L, 1997. Fractals and Chaos in Geology and Geophysics. Cambridge: Cambridge University Press. 398. |
| Yu C, 1998. The Complxity and Self-Organized Criticality of the Solid Earth System. Earth Science Frontiers, 5(3-4): 159-182, 347-368. |
| Yu C, 1999. L arge Ore Deposits and Metallogenic Districts at the Edge of Chaos. Earth Science Frontiers, 6(1-2): 85-102, 195-230. |
Figures(1) / Tables(2)
Copyright © 2013-2020 Journal of Earth Science 鄂ICP备15021562号-2
Tel: +86-27-67885075 Fax: +86-27-67885075 E-mail: xbb@cug.edu.cn
Address: Editorial Office of Journal, China University of Geosciences, Yujiashan, Wuhan, Hubei 430074, P. R. China
Supported by:
Beijing Renhe Information Technology Co. Ltd
E-mail:
info@rhhz.net


 DownLoad: